Special notes of this burst
Image
Pre-slew 15.0-350.0 keV image (Event data)
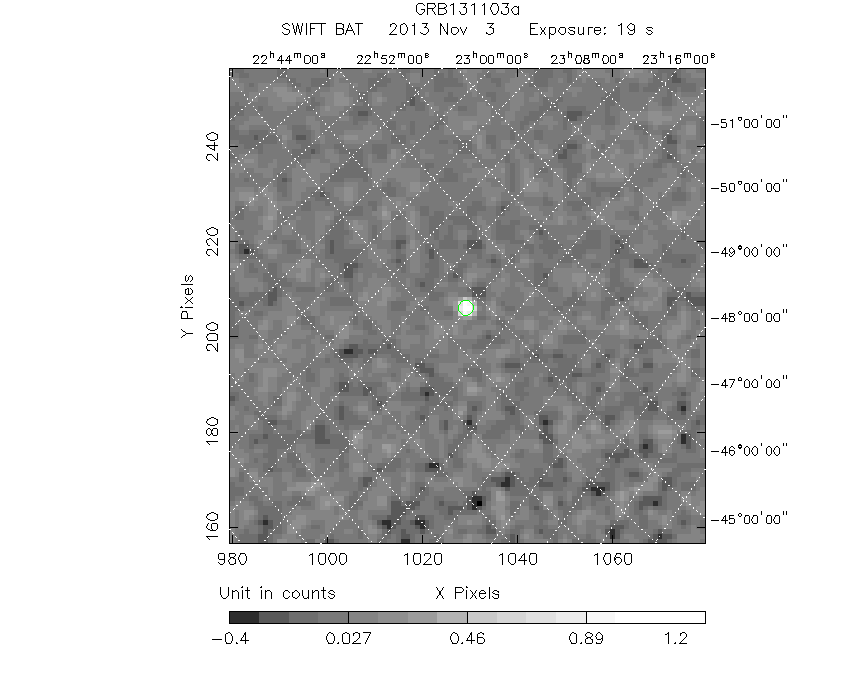
#   RAcent    DECcent   POSerr    Theta     Phi              Peak Cts       SNR   Name
  348.9437   -44.6526   0.0119    32.9996   118.9281         1.4749042     16.198 TRIG_00576562

Foreground time interval of the image:
 -8.284  10.252 (delta_t =  18.536 [sec])
Background time interval of the image:
-400.923 -384.995 (delta_t =  15.928 [sec])
-239.024  -8.284 (delta_t = 230.740 [sec])
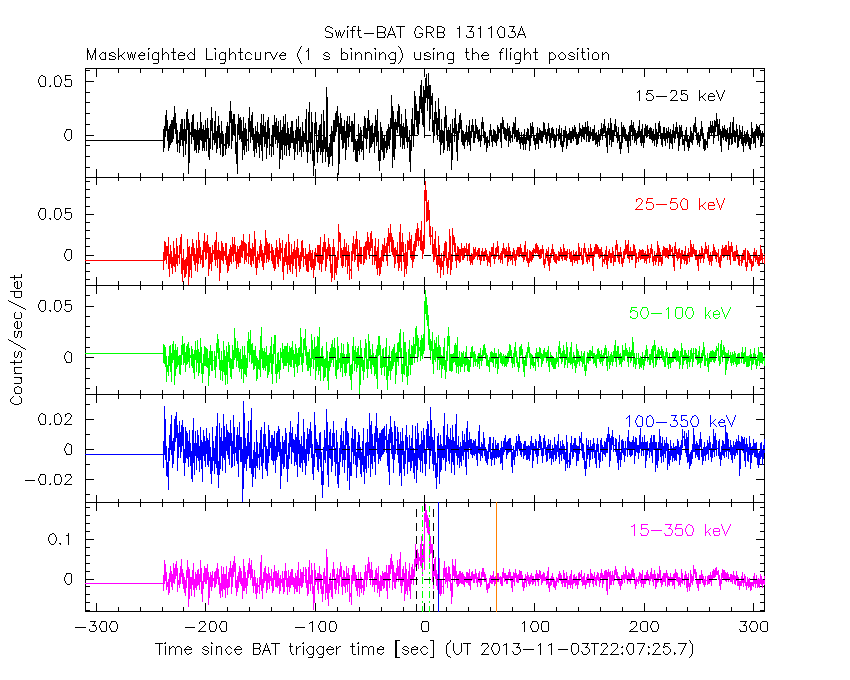
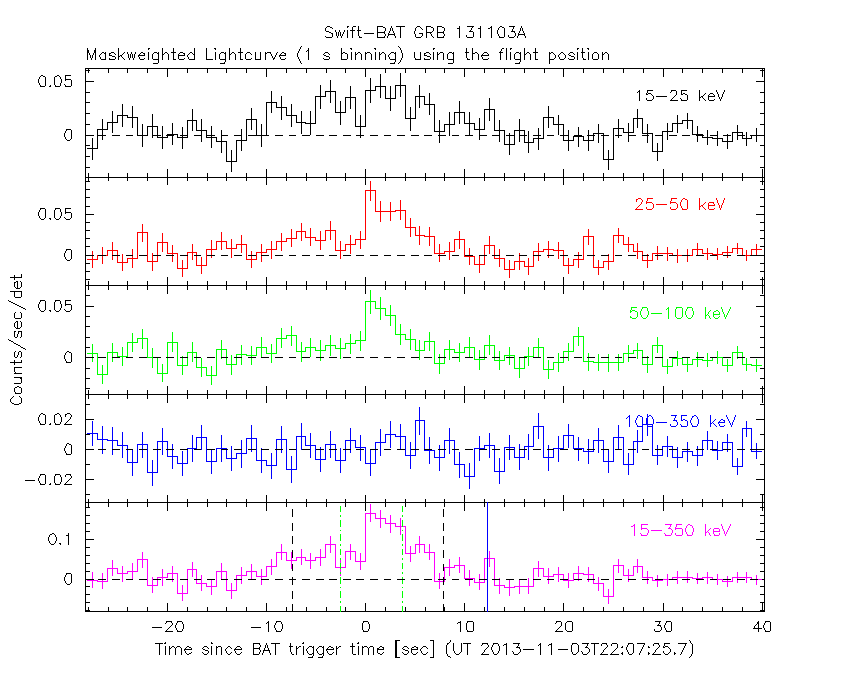
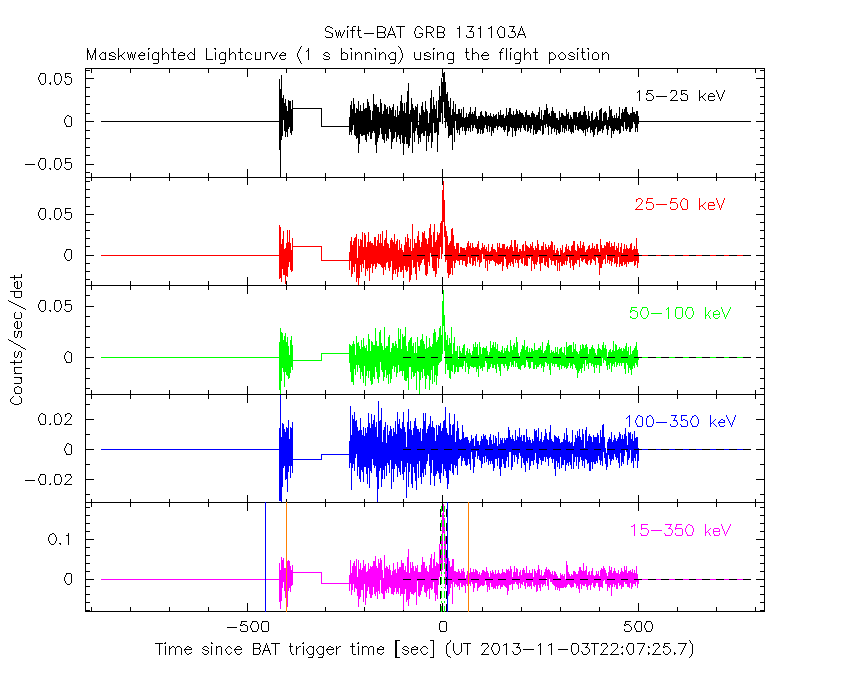
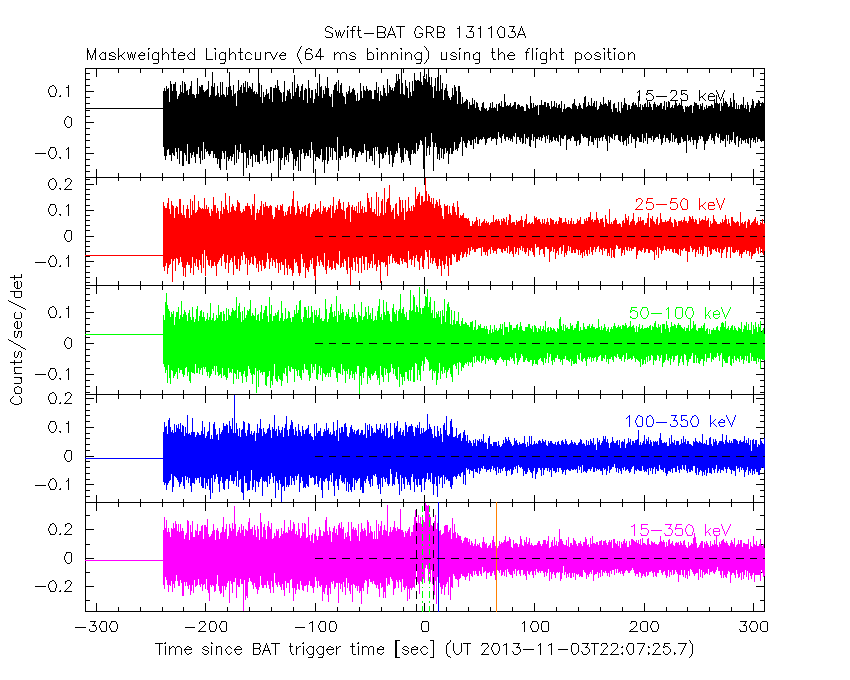
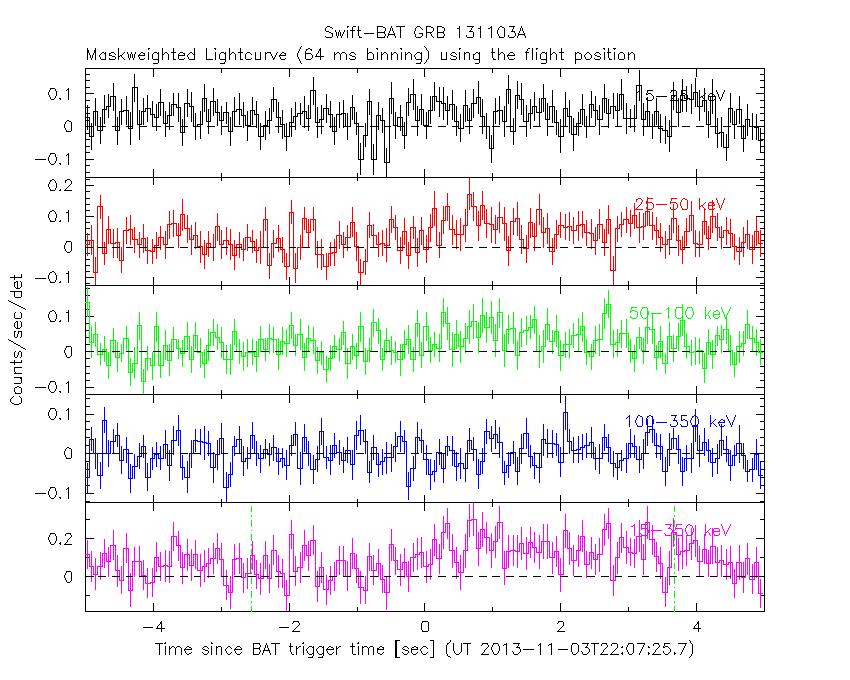
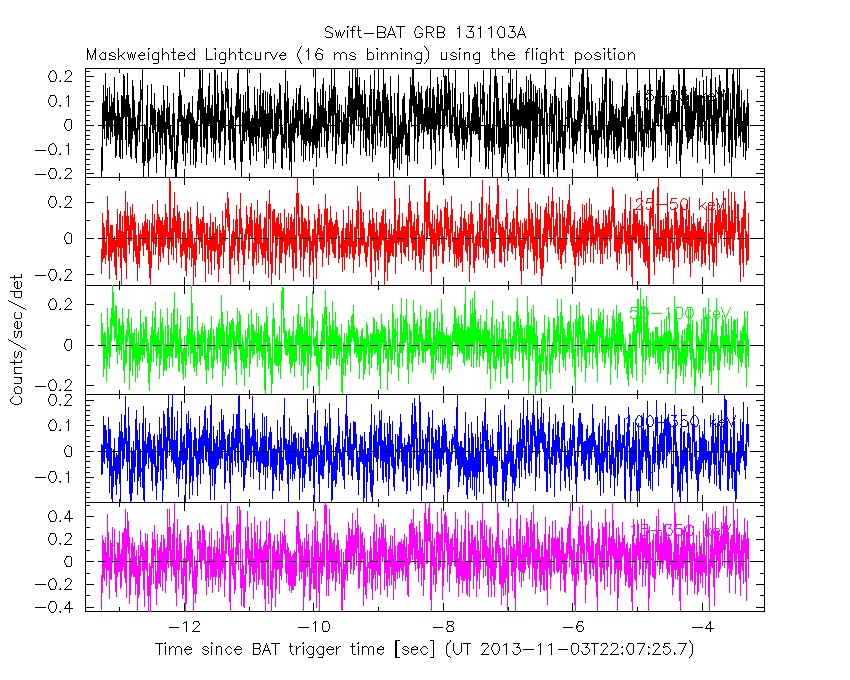
Lightcurves
Notes:
- 1) The mask-weighted light curves are using the flight position.
- 2) Multiple plots of different time binning/intervals are shown to cover all scenarios of short/long GRBs, rate/image triggers, and real/false positives.
- 3) For all the mask-weighted lightcurves, the y-axis units are counts/sec/det where a det is 0.4 x 0.4 = 0.16 sq cm.
- 4) The verticle lines correspond to following: green dotted lines are T50 interval, black dotted lines are T90 interval, blue solid line(s) is a spacecraft slew start time, and orange solid line(s) is a spacecraft slew end time.
- 5) Time of each bin is in the middle of the bin.
1 s binning
From T0-310 s to T0+310 s
From T100_start - 20 s to T100_end + 30 s
Full time interval
64 ms binning
Full time interval
From T100_start to T100_end
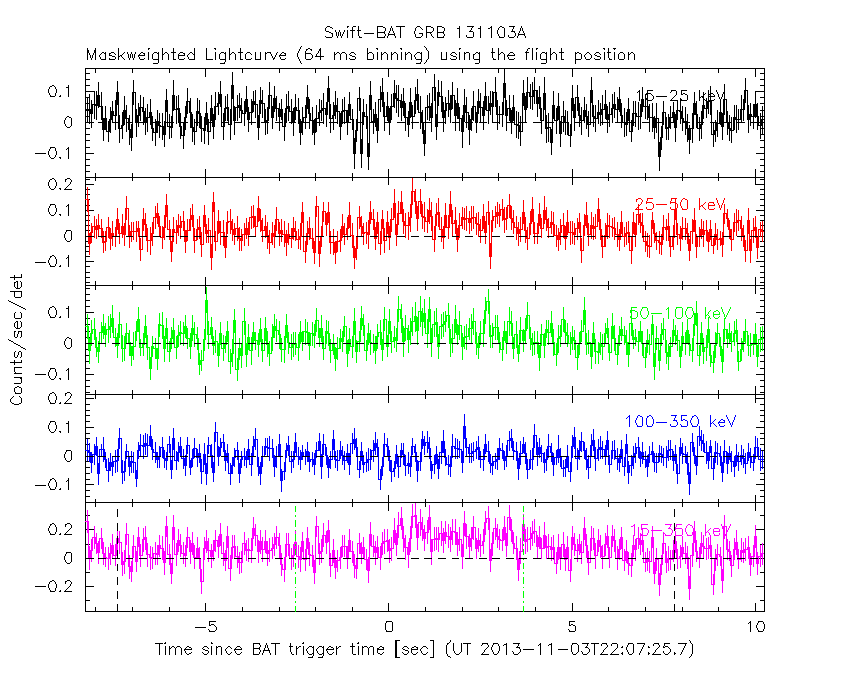
From T0-5 sec to T0+5 sec
16 ms binning
From T100_start-5 s to T100_start+5 s
Blue+Cyan dotted lines: Time interval of the scaled map
From 0.000000 to 1.024000
8 ms binning
From T100_start-3 s to T100_start+3 s

Blue+Cyan dotted lines: Time interval of the scaled map
From 0.000000 to 1.024000
2 ms binning
From T100_start-1 s to T100_start+1 s
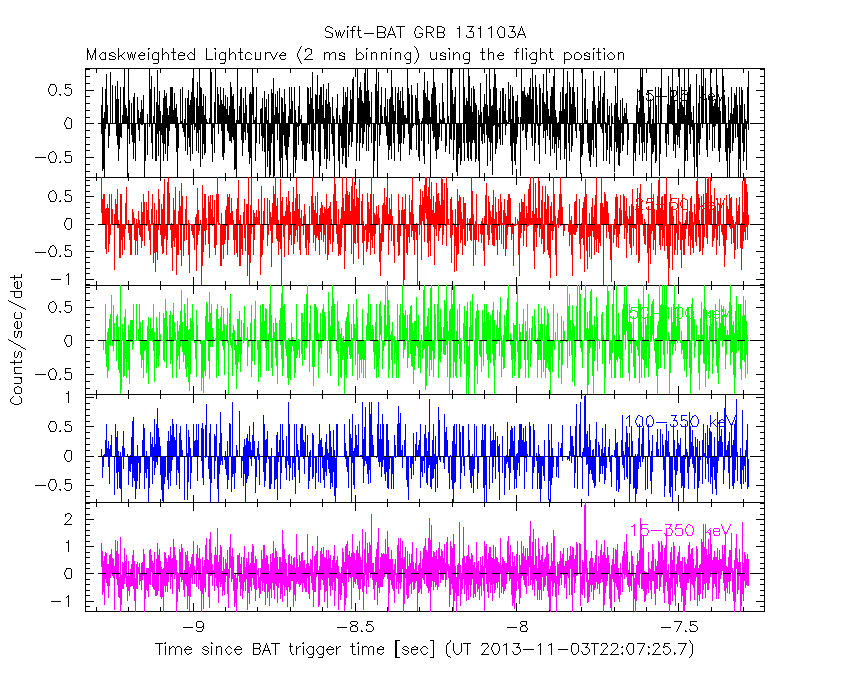
Blue+Cyan dotted lines: Time interval of the scaled map
From 0.000000 to 1.024000
SN=5 or 10 sec. binning (whichever binning is satisfied first)
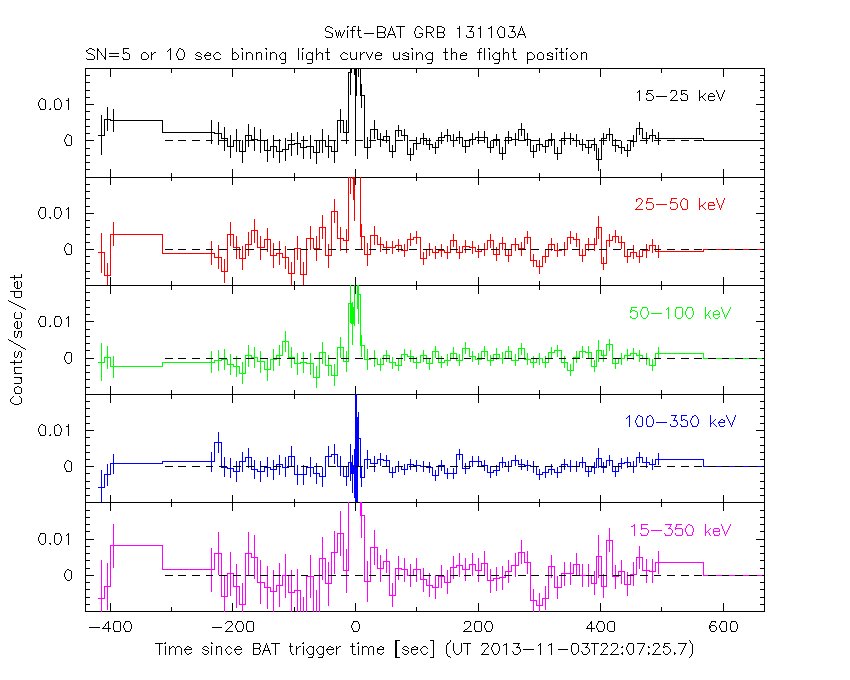
SN=5 or 10 sec. binning (T < 200 sec)

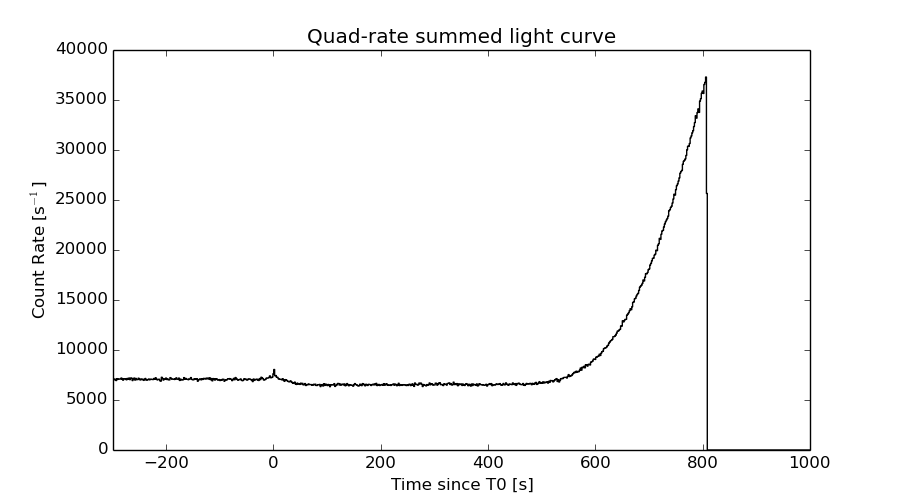
Quad-rate summed light curves (from T0-300s to T0+1000s)
The mask-weighted light curves based on cleaned DPHs

Spectral Evolution
Spectra
Notes:
- 1) The fitting includes the systematic errors.
- 2) When the burst includes telescope slew time periods, the fitting uses an average response file made from multiple 5-s response files through out the slew time plus single time preiod for the non-slew times, and weighted by the total counts in the corresponding time period using addrmf. An average response file is needed becuase a spectral fit using the pre-slew DRM will introduce some errors in both a spectral shape and a normalization if the PHA file contains a lot of the slew/post-slew time interval.
- 3) For fits to more complicated models (e.g. a power-law over a cutoff power-law), the BAT team has decided to require a chi-square improvement of more than 6 for each extra dof.
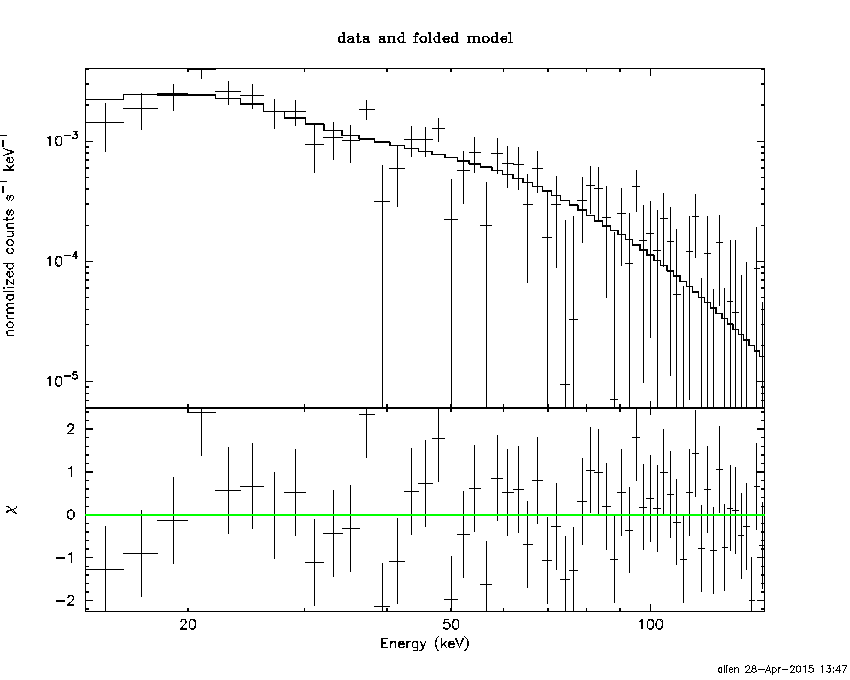
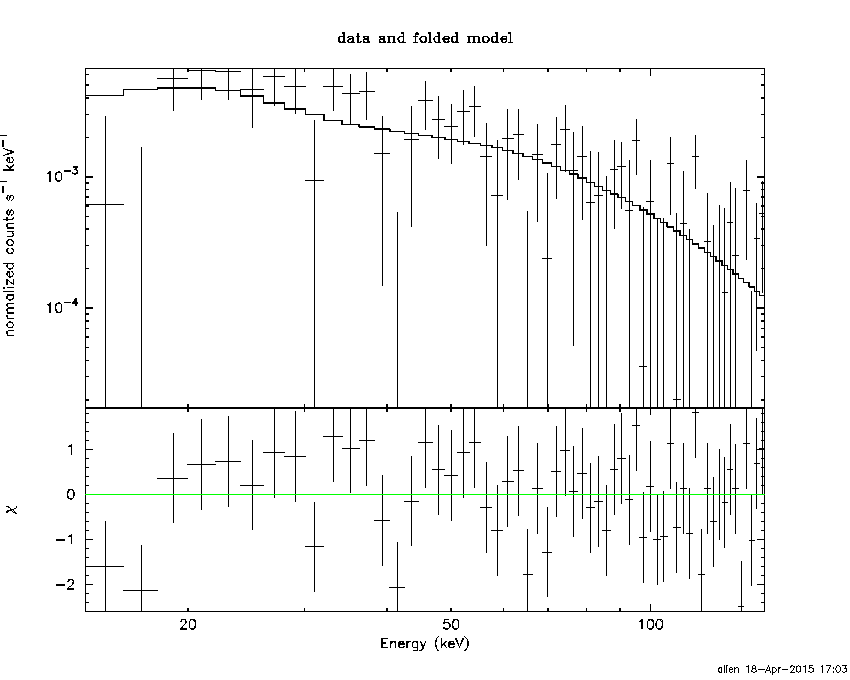
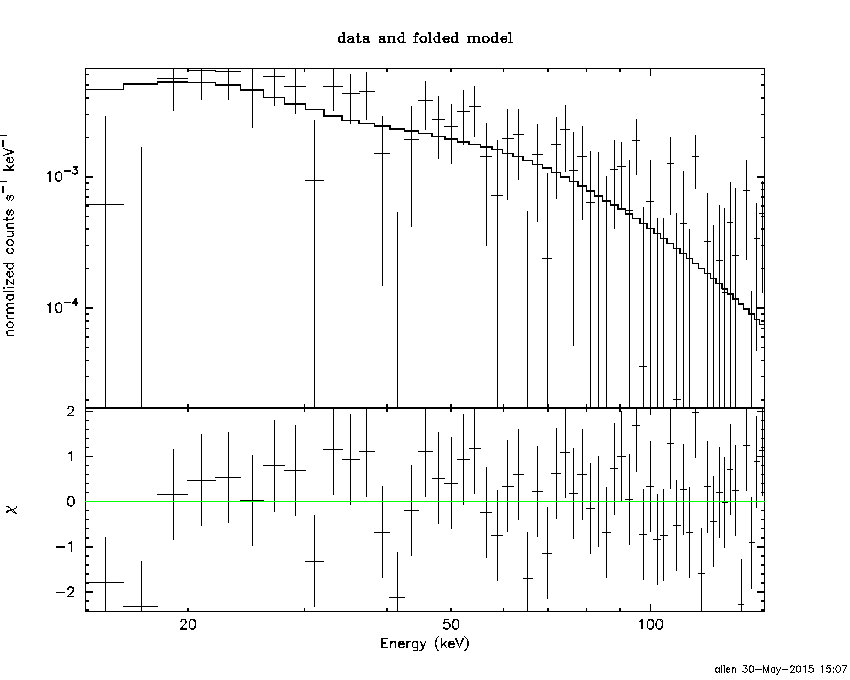
Time averaged spectrum fit using the average DRM
Power-law model

Time interval is from   -8.284 sec. to   10.252 sec.

Spectral model in power-law:
------------------------------------------------------------
Parameters  : value       lower 90%   higher 90%
Photon index: 1.79340     ( -0.172926   0.178148 )
Norm@50keV  : 4.75783E-03    ( -0.000540978   0.000532156 )
------------------------------------------------------------
#Fit statistic : Chi-Squared =          62.45 using 59 PHA bins.
# Reduced chi-squared =          1.096 for     57 degrees of freedom
# Null hypothesis probability =   2.887210e-01

Photon flux (15-150 keV)    in 18.54 sec: 0.653950 ( -0.0647882  0.0648168 ) ph/cm2/s
Energy fluence (15-150 keV)             : 8.12263e-07 ( -9.35176e-08  9.49834e-08 ) ergs/cm2
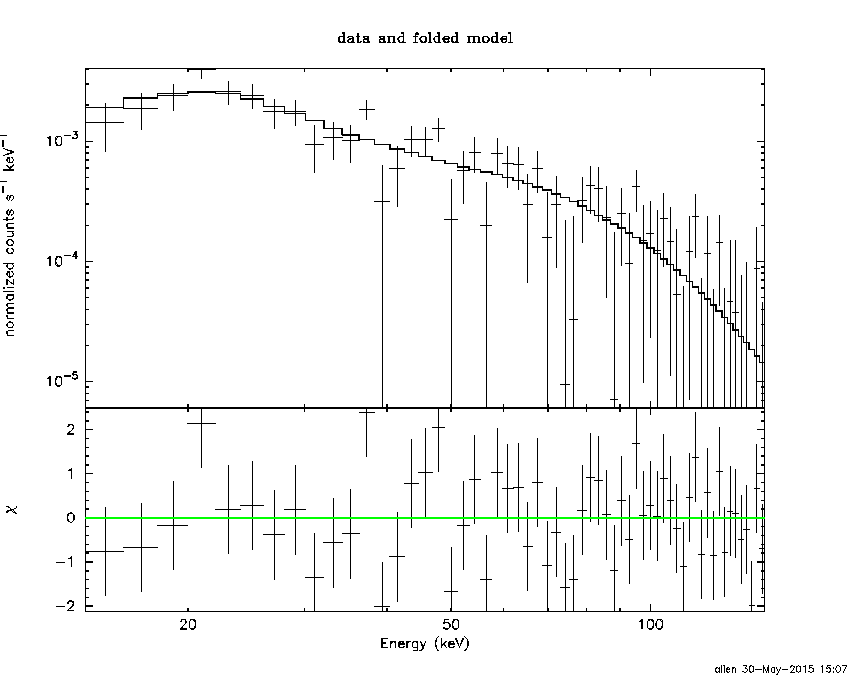
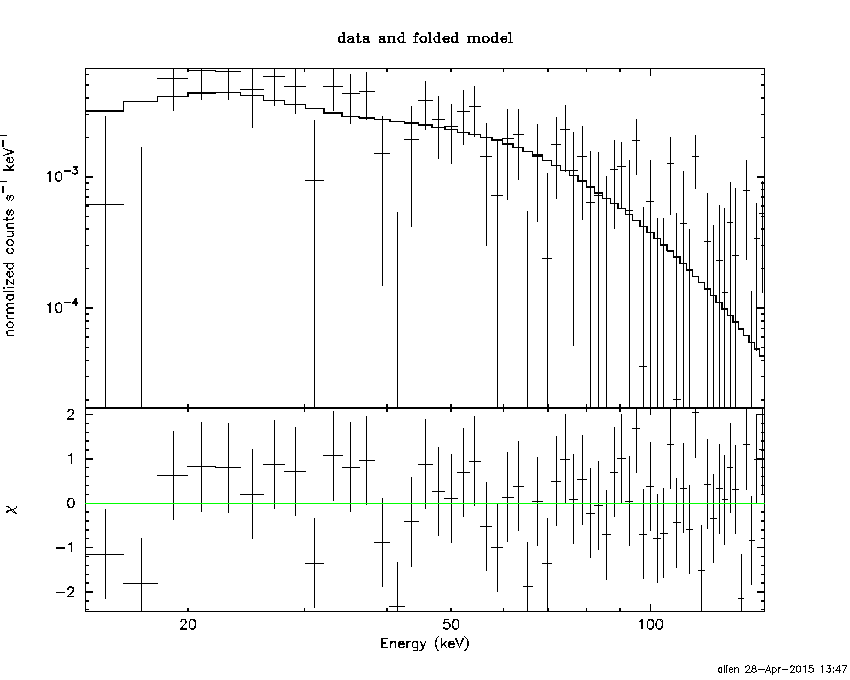
Cutoff power-law model
Time interval is from   -8.284 sec. to   10.252 sec.
Spectral model in the cutoff power-law:
------------------------------------------------------------
Parameters  : value       lower 90%   higher 90%
Photon index: 1.34182     ( -0.766291   0.548495 )
Epeak [keV] : 63.4081      ( -20.2691 -63.4081 )
Norm@50keV  : 8.55919E-03    ( -0.00413537   0.0145769 )
------------------------------------------------------------
#Fit statistic : Chi-Squared =          61.02 using 59 PHA bins.
# Reduced chi-squared =          1.090 for     56 degrees of freedom
# Null hypothesis probability =   3.002184e-01

Photon flux (15-150 keV)    in 18.54 sec: 0.643102 ( -0.066595  0.066556 ) ph/cm2/s
Energy fluence (15-150 keV)             : 7.75413e-07 ( -1.06559e-07  1.08225e-07 ) ergs/cm2
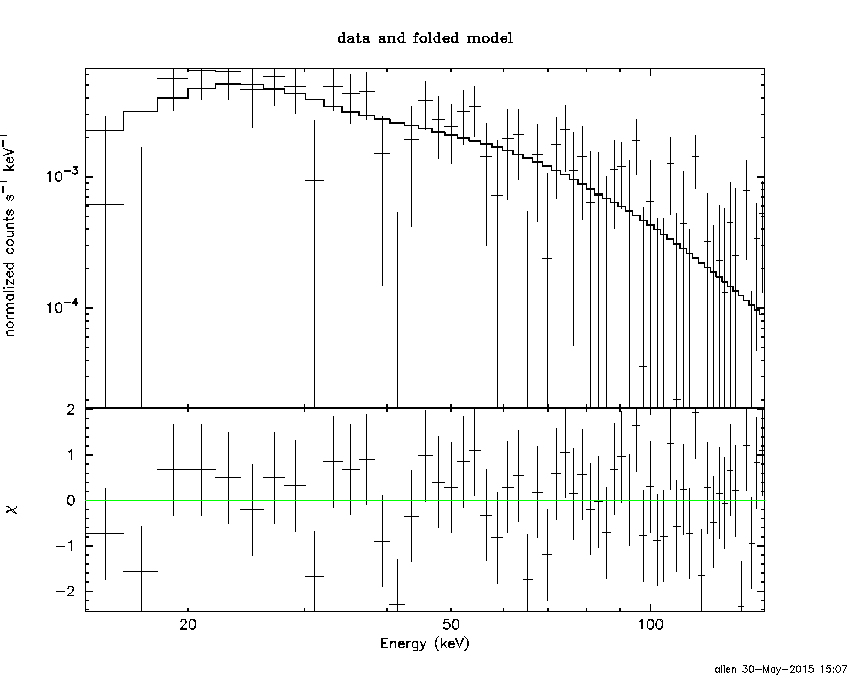
Band function

Time interval is from   -8.284 sec. to   10.252 sec.

Spectral model in the Band function:
------------------------------------------------------------
Parameters  : value       lower 90%   higher 90%
alpha       : -1.34157   ( -0.431996   0.822601 )
beta        : -10.0000    ( 10   3.01981e-14 )
Epeak [keV] : 63.3909      ( -20.2304 -63.391 )
Norm@50keV   : 8.56045E-03    ( -0.00397646   0.0145546 )
------------------------------------------------------------
#Fit statistic : Chi-Squared =          61.02 using 59 PHA bins.
# Reduced chi-squared =          1.110 for     55 degrees of freedom
# Null hypothesis probability =   2.684019e-01

Photon flux (15-150 keV)    in 18.54 sec: 0.646015 (    ) ph/cm2/s
Energy fluence (15-150 keV)             : 7.87878e-07 ( 0  0 ) ergs/cm2
Single BB
Spectral model blackbody:
------------------------------------------------------------
Parameters  : value    Lower 90%  Upper 90%
kT [keV]    : 10.8920  (-1.30946  1.53197)
R^2/D10^2   : 0.223618  (-0.0870533   0.138973)
(R is the radius in km and D10 is the distance to the source in units of 10 kpc)
------------------------------------------------------------
#Fit statistic : Chi-Squared =          83.59 using 59 PHA bins.
# Reduced chi-squared =          1.466 for     57 degrees of freedom
# Null hypothesis probability =   1.244269e-02

Energy  Fluence     90% Error
[keV]   [erg/cm2]   [erg/cm2]
15- 25  1.026e-07   1.748e-08
25- 50  2.863e-07   3.337e-08
50-150  1.904e-07   4.894e-08
15-150  5.793e-07   7.388e-08
Thermal bremsstrahlung (OTTB)
Spectral model: thermal bremsstrahlung
------------------------------------------------------------
Parameters  : value         Lower 90%    Upper 90%
kT [keV]    : 97.3455       (-29.5108      56.0276)
Norm        : 2.91699       (-0.386995     0.47027)
------------------------------------------------------------
#Fit statistic : Chi-Squared =          60.97 using 59 PHA bins.
# Reduced chi-squared =          1.070 for     57 degrees of freedom
# Null hypothesis probability =   3.350913e-01

Energy  Fluence     90% Error
[keV]   [erg/cm2]   [erg/cm2]
15- 25  1.413e-07   2.060e-08
25- 50  2.430e-07   2.837e-08
50-150  3.878e-07   1.556e-07
15-150  7.722e-07   1.831e-07
Double BB
Spectral model: bbodyrad<1> + bbodyrad<2>
------------------------------------------------------------
Parameters  : value         Lower 90%    Upper 90%
kT1 [keV]   : 6.51647        (-1.47112      1.67726)
R1^2/D10^2  : 1.10698        (-0.600378      0.961387)
kT2 [keV]   : 24.1337        (-6.88622      15.0703)
R2^2/D10^2  : 8.37390E-03    (-0.00677348   0.0125376)
------------------------------------------------------------
#Fit statistic : Chi-Squared =          58.24 using 59 PHA bins.
# Reduced chi-squared =          1.059 for     55 degrees of freedom
# Null hypothesis probability =   3.571919e-01

Energy  Fluence     90% Error
[keV]   [erg/cm2]   [erg/cm2]
15- 25  1.452e-07   5.831e-08
25- 50  2.425e-07   7.912e-08
50-150  4.060e-07   2.136e-07
15-150  7.937e-07   3.121e-07
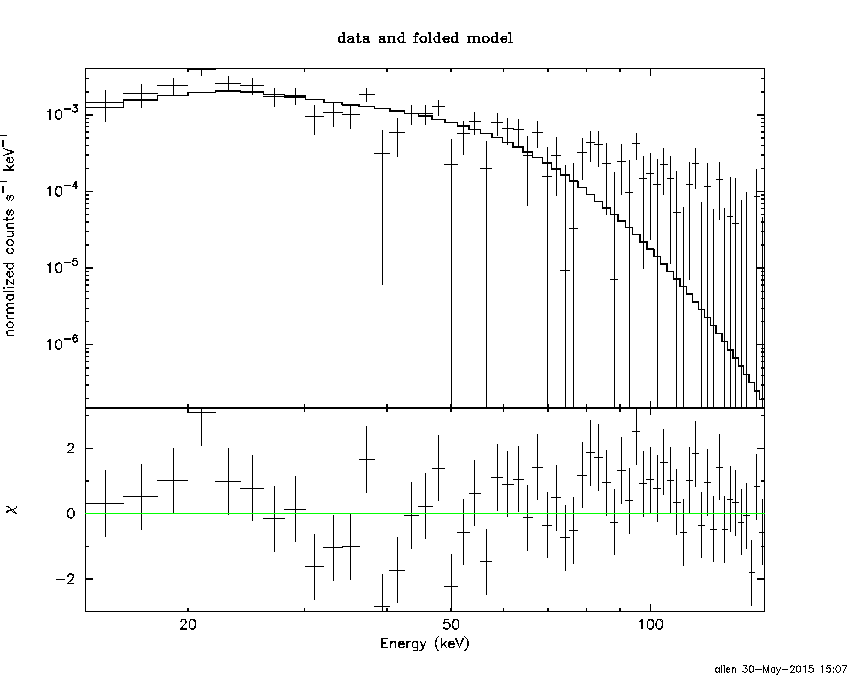
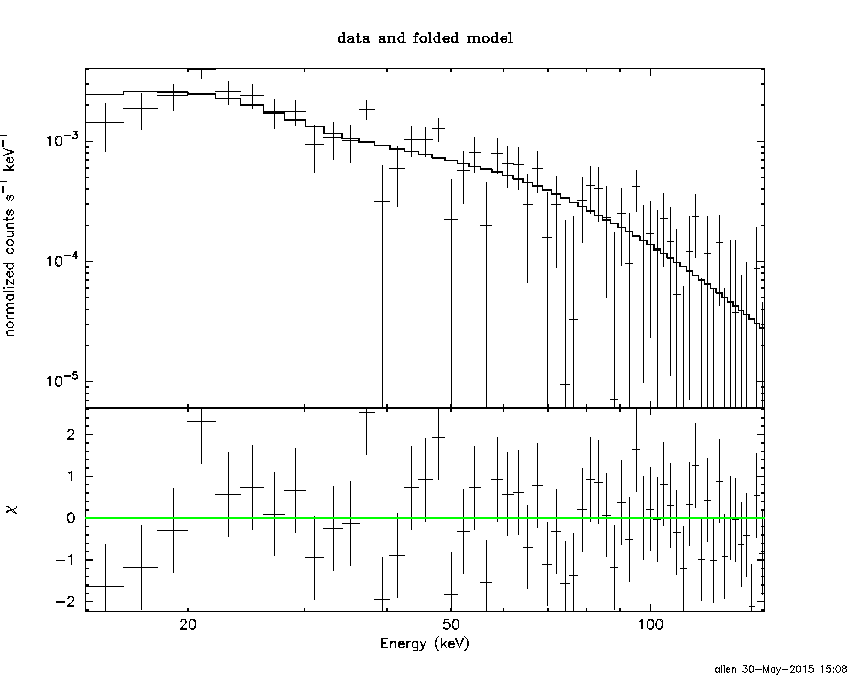
Peak spectrum fit
Power-law model
Time interval is from    0.612 sec. to    1.612 sec.

Spectral model in power-law:
------------------------------------------------------------
Parameters  : value       lower 90%   higher 90%
Photon index: 1.37038     ( -0.280304   0.278361 )
Norm@50keV  : 1.29038E-02    ( -0.00234617   0.00234094 )
------------------------------------------------------------
#Fit statistic : Chi-Squared =          58.25 using 59 PHA bins.
# Reduced chi-squared =          1.022 for     57 degrees of freedom
# Null hypothesis probability =   4.292044e-01

Photon flux (15-150 keV)    in 1 sec: 1.56123 ( -0.28663  0.287263 ) ph/cm2/s
Energy fluence (15-150 keV)             : 1.25462e-07 ( -2.46588e-08  2.49656e-08 ) ergs/cm2
Cutoff power-law model
Time interval is from    0.612 sec. to    1.612 sec.
Spectral model in the cutoff power-law:
------------------------------------------------------------
Parameters  : value       lower 90%   higher 90%
Photon index: 0.209057     ( -1.62027   1.15449 )
Epeak [keV] : 74.8103      ( -22.6204 678.07 )
Norm@50keV  : 5.22202E-02    ( -0.0522047   0.31928 )
------------------------------------------------------------
#Fit statistic : Chi-Squared =          55.29 using 59 PHA bins.
# Reduced chi-squared =         0.9873 for     56 degrees of freedom
# Null hypothesis probability =   5.017364e-01

Photon flux (15-150 keV)    in 1 sec: 1.52130 ( -0.28959  0.29036 ) ph/cm2/s
Energy fluence (15-150 keV)             : 1.16171e-07 ( -2.68294e-08  2.7227e-08 ) ergs/cm2
Band function
Time interval is from    0.612 sec. to    1.612 sec.

Spectral model in the Band function:
------------------------------------------------------------
Parameters  : value       lower 90%   higher 90%
alpha       : 5.00000   ( -5.88875   -5 )
beta        : -1.74540    ( -0.605447   0.392473 )
Epeak [keV] : 32.0699      ( -7.8916 7.93483 )
Norm@50keV   : 312.239    ( -54.3919   1357.43 )
------------------------------------------------------------
#Fit statistic : Chi-Squared =          52.42 using 59 PHA bins.
# Reduced chi-squared =         0.9531 for     55 degrees of freedom
# Null hypothesis probability =   5.737803e-01

Photon flux (15-150 keV)    in 1 sec:  (    ) ph/cm2/s
Energy fluence (15-150 keV)             : 1.21116e-07 ( -1.21109e-07  -2.52566e-08 ) ergs/cm2
Single BB
Spectral model blackbody:
------------------------------------------------------------
Parameters  : value    Lower 90%  Upper 90%
kT [keV]    : 14.9468  (-2.87372  3.79829)
R^2/D10^2   : 0.194238  (-0.106706   0.216116)
(R is the radius in km and D10 is the distance to the source in units of 10 kpc)
------------------------------------------------------------
#Fit statistic : Chi-Squared =          58.46 using 59 PHA bins.
# Reduced chi-squared =          1.026 for     57 degrees of freedom
# Null hypothesis probability =   4.216195e-01

Energy  Fluence     90% Error
[keV]   [erg/cm2]   [erg/cm2]
15- 25  9.090e-09   3.423e-09
25- 50  3.600e-08   1.173e-08
50-150  5.465e-08   2.067e-08
15-150  9.974e-08   2.722e-08
Thermal bremsstrahlung (OTTB)
Spectral model: thermal bremsstrahlung
------------------------------------------------------------
Parameters  : value         Lower 90%    Upper 90%
kT [keV]    : 199.363       (-83.4186      -199.363)
Norm        : 6.52244       (-1.17288     1.17288)
------------------------------------------------------------
#Fit statistic : Chi-Squared =          57.92 using 59 PHA bins.
# Reduced chi-squared =          1.016 for     57 degrees of freedom
# Null hypothesis probability =   4.410567e-01

Energy  Fluence     90% Error
[keV]   [erg/cm2]   [erg/cm2]
15- 25  1.624e-08   9.445e-09
25- 50  3.124e-08   1.809e-08
50-150  6.852e-08   3.888e-08
15-150  1.160e-07   6.645e-08
Double BB
Spectral model: bbodyrad<1> + bbodyrad<2>
------------------------------------------------------------
Parameters  : value         Lower 90%    Upper 90%
kT1 [keV]   : 9.28948        (-4.1431      5.42944)
R1^2/D10^2  : 0.651142        (-0.46232      0.984344)
kT2 [keV]   : 29.1896        (-24.0524      -29.1958)
R2^2/D10^2  : 1.24439E-02    (-0.0119817   0.118559)
------------------------------------------------------------
#Fit statistic : Chi-Squared =          53.90 using 59 PHA bins.
# Reduced chi-squared =         0.9799 for     55 degrees of freedom
# Null hypothesis probability =   5.168698e-01

Energy  Fluence     90% Error
[keV]   [erg/cm2]   [erg/cm2]
15- 25  1.280e-08   7.670e-09
25- 50  3.508e-08   1.932e-08
50-150  7.295e-08   3.945e-08
15-150  1.208e-07   6.085e-08
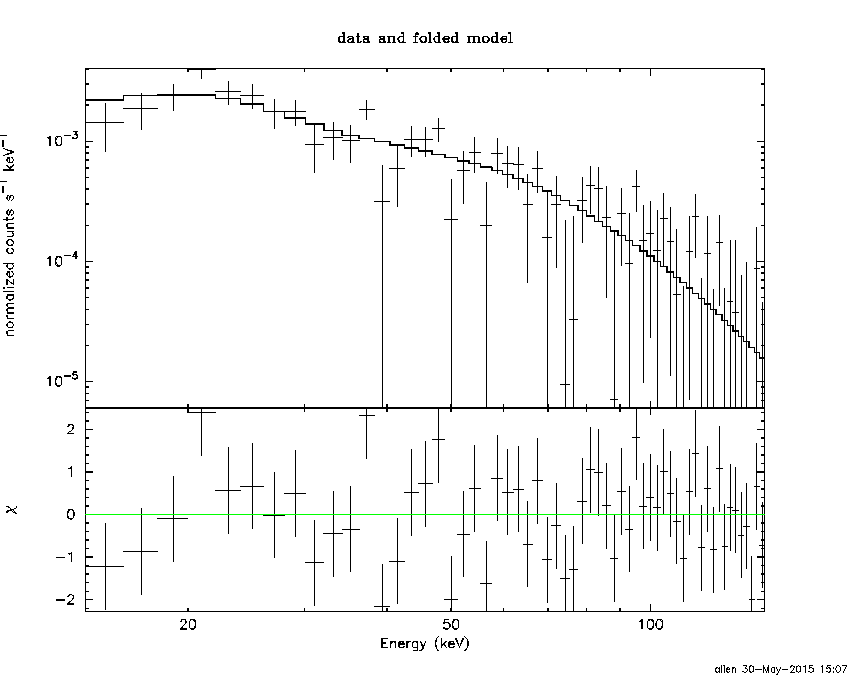
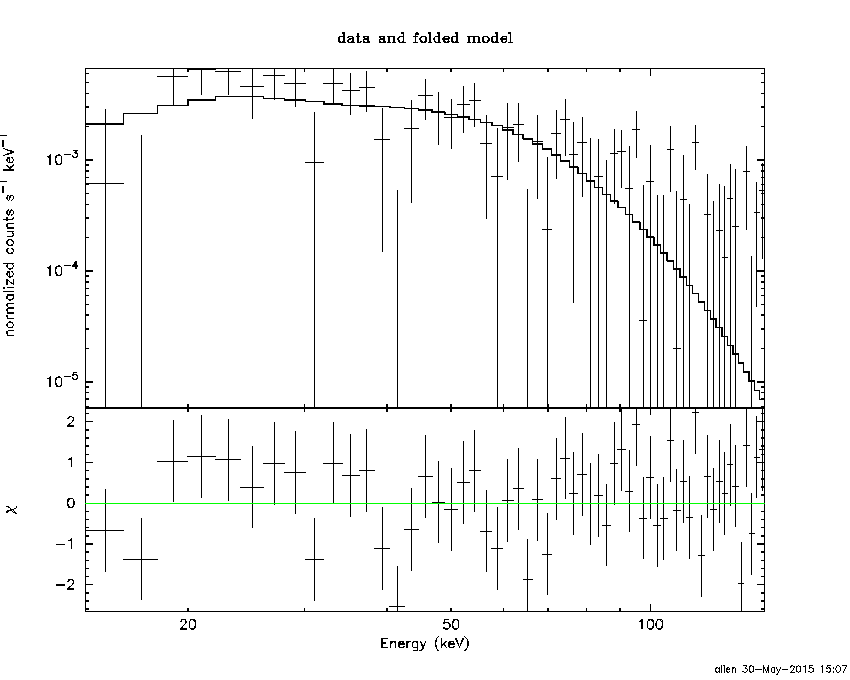
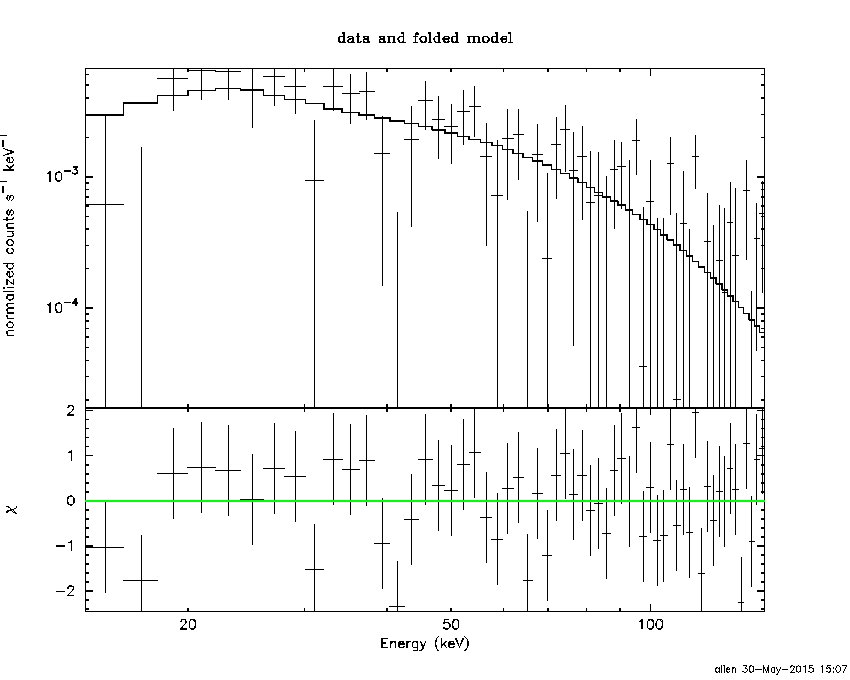
Pre-slew spectrum (Pre-slew PHA with pre-slew DRM)
Power-law model
Spectral model in power-law:
------------------------------------------------------------
Parameters  : value       lower 90%   higher 90%
Photon index: 1.79340     ( -0.172926   0.178148 )
Norm@50keV  : 4.75783E-03    ( -0.000540978   0.000532156 )
------------------------------------------------------------
#Fit statistic : Chi-Squared =          62.45 using 59 PHA bins.
# Reduced chi-squared =          1.096 for     57 degrees of freedom
# Null hypothesis probability =   2.887210e-01

Photon flux (15-150 keV)    in 18.54 sec: 0.653950 ( -0.0647882  0.0648168 ) ph/cm2/s
Energy fluence (15-150 keV)             : 8.12263e-07 ( -9.35176e-08  9.49834e-08 ) ergs/cm2
Cutoff power-law model

Spectral model in the cutoff power-law:
------------------------------------------------------------
Parameters  : value       lower 90%   higher 90%
Photon index: 1.34182     ( -0.766291   0.548495 )
Epeak [keV] : 63.4081      ( -20.2691 -63.4081 )
Norm@50keV  : 8.55919E-03    ( -0.00413537   0.0145769 )
------------------------------------------------------------
#Fit statistic : Chi-Squared =          61.02 using 59 PHA bins.
# Reduced chi-squared =          1.090 for     56 degrees of freedom
# Null hypothesis probability =   3.002184e-01

Photon flux (15-150 keV)    in 18.54 sec: 0.643102 ( -0.066595  0.066556 ) ph/cm2/s
Energy fluence (15-150 keV)             : 7.75413e-07 ( -1.06559e-07  1.08225e-07 ) ergs/cm2
Band function

Spectral model in the Band function:
------------------------------------------------------------
Parameters  : value       lower 90%   higher 90%
alpha       : -1.34157   ( -0.431996   0.822601 )
beta        : -10.0000    ( 10   20 )
Epeak [keV] : 63.3909      ( -20.2304 -63.391 )
Norm@50keV   : 8.56045E-03    ( -0.00397646   0.0145546 )
------------------------------------------------------------
#Fit statistic : Chi-Squared =          61.02 using 59 PHA bins.
# Reduced chi-squared =          1.110 for     55 degrees of freedom
# Null hypothesis probability =   2.684019e-01

Photon flux (15-150 keV)    in 18.54 sec: 0.646015 (    ) ph/cm2/s
Energy fluence (15-150 keV)             : 7.87878e-07 ( 0  0 ) ergs/cm2
S(25-50 keV) vs. S(50-100 keV) plot
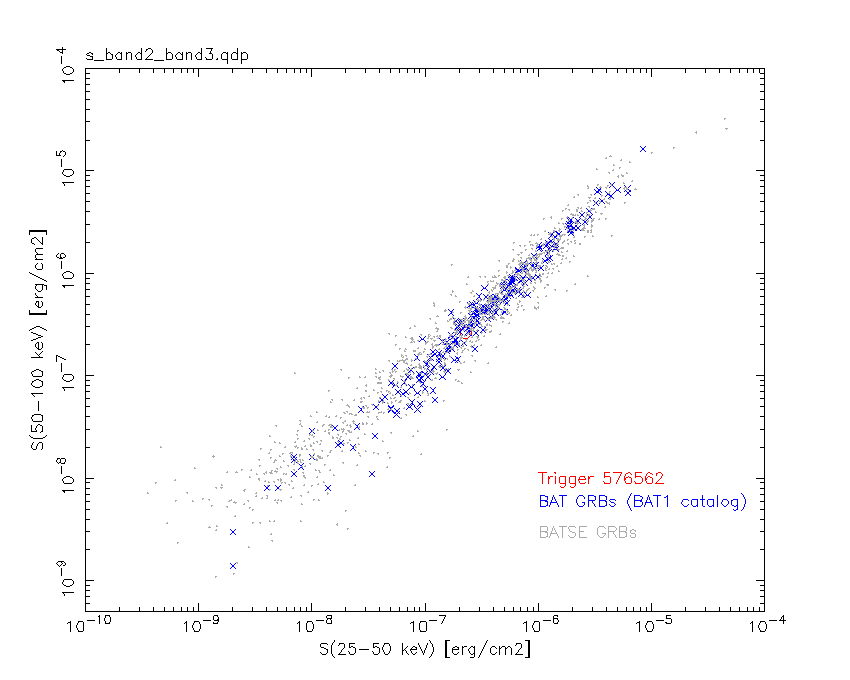
S(25-50 keV)  = 2.28e-07
S(50-100 keV) = 2.63e-07
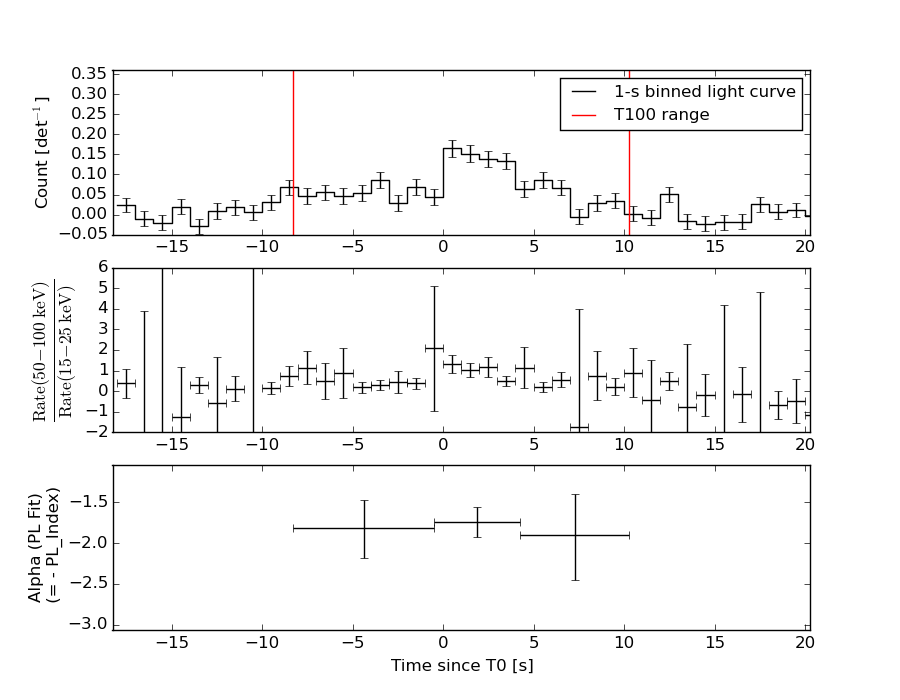
T90 vs. Hardness ratio plot
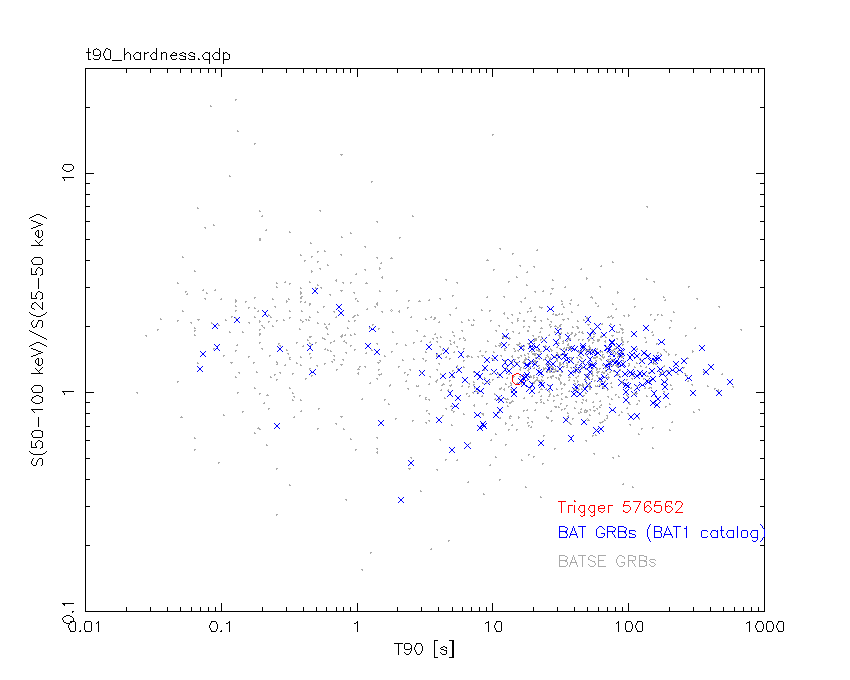
T90                                   = 15.2079999446869 sec.
Hardness ratio (energy fluence ratio) = 1.15351
Color vs. Color plot
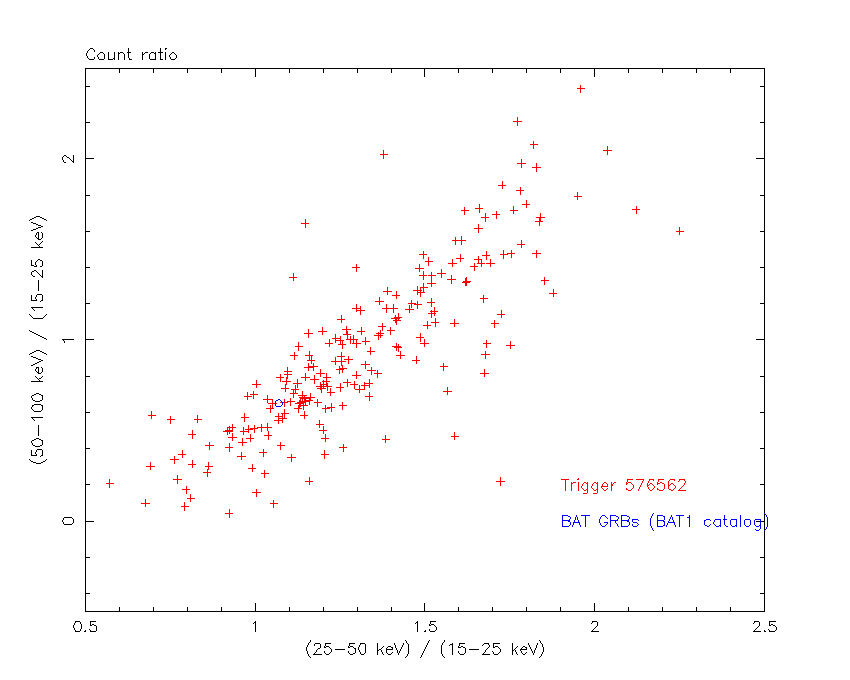
Count Ratio  (25-50 keV) / (15-25 keV) = 1.0693
Count Ratio (50-100 keV) / (15-25 keV) = 0.650837
Mask shadow pattern
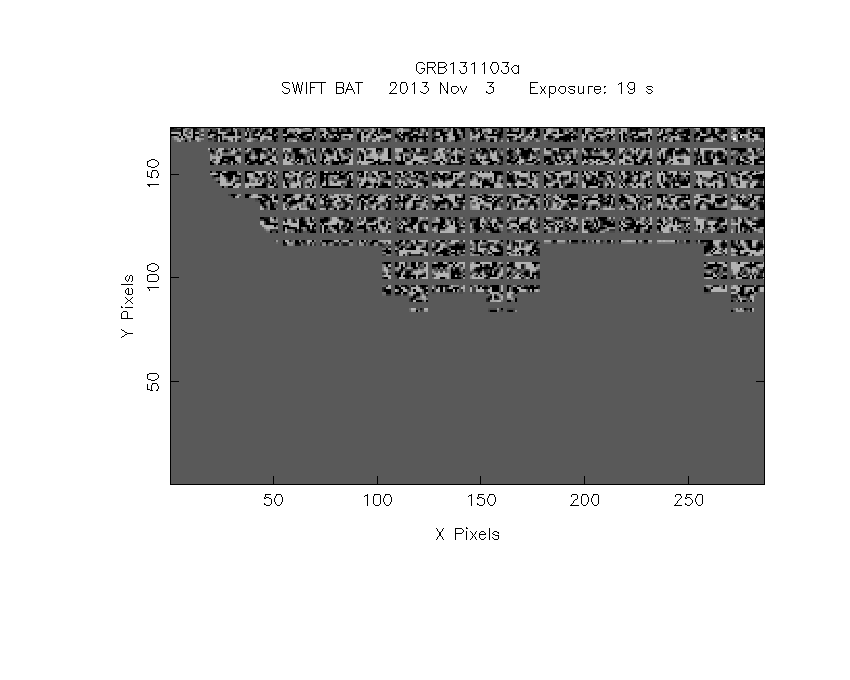
IMX = -3.141206988733403E-01, IMY = -5.683696015884775E-01
TIME vs. PHA plot around the trigger time
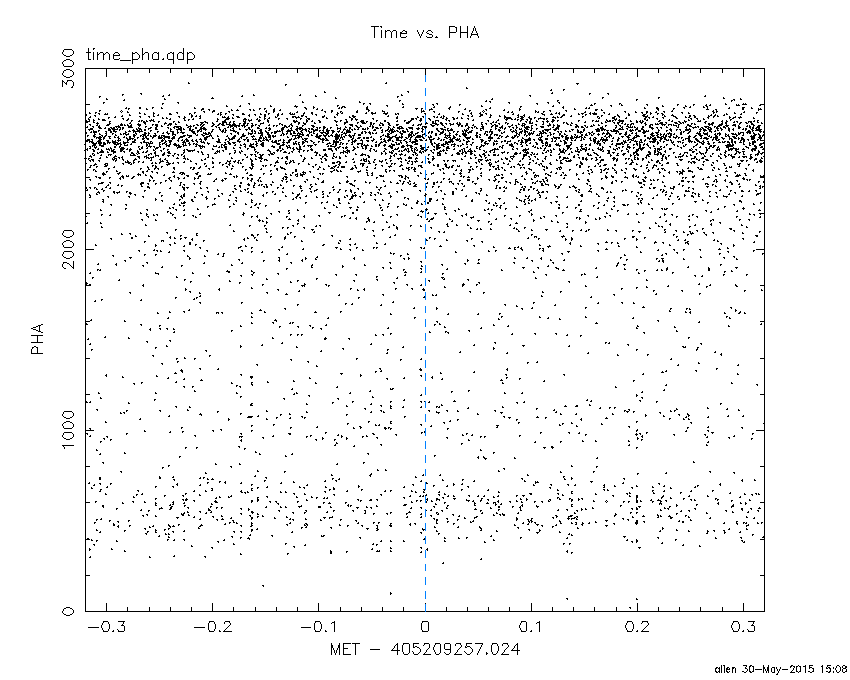
Blue+Cyan dotted lines: Time interval of the scaled map
From 0.000000 to 1.024000
TIME vs. DetID plot around the trigger time

Blue+Cyan dotted lines: Time interval of the scaled map
From 0.000000 to 1.024000
100 us light curve (15-350 keV)
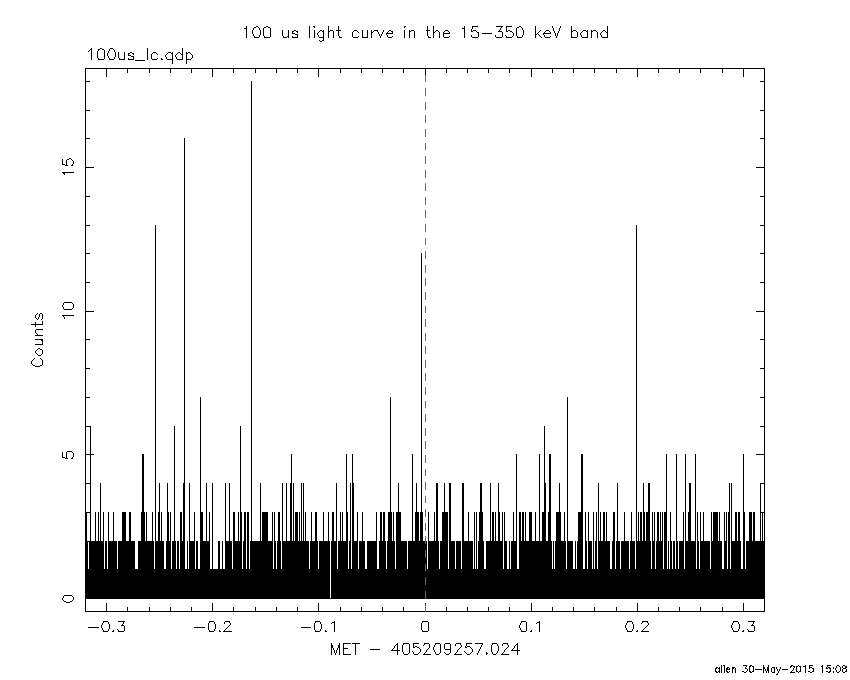
Blue+Cyan dotted lines: Time interval of the scaled map
From 0.000000 to 1.024000
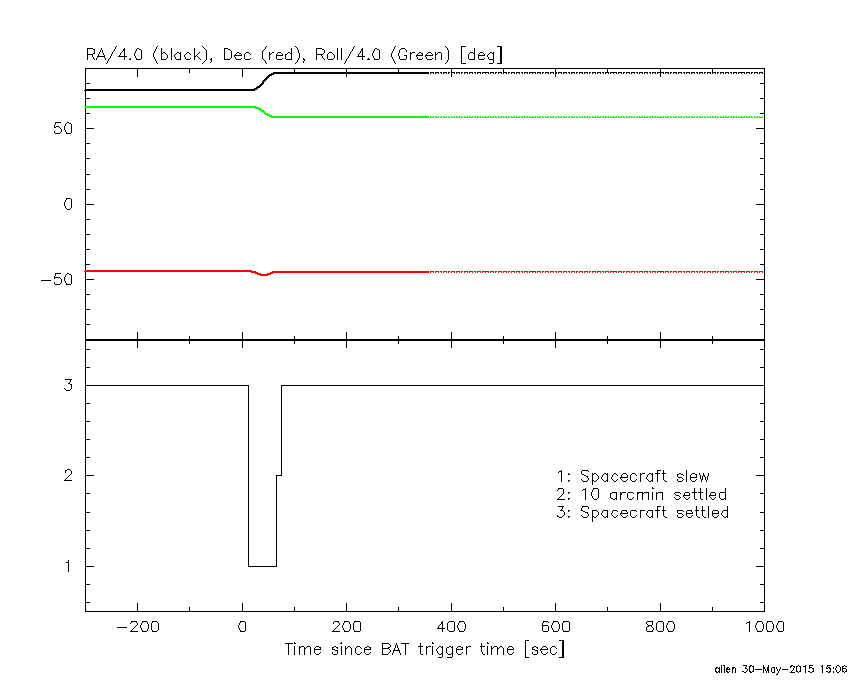
Spacecraft aspect plot
Bright source in the pre-burst/pre-slew/post-slew images
Pre-burst image of 15-350 keV band
Time interval of the image:
-400.923400 -384.995200
-239.024000 -8.284000

# RAcent  DECcent POSerr Theta    Phi  PeakCts   SNR AngSep     Name
#  [deg]    [deg]    ['] [deg]  [deg]                   [']
255.8371 -37.8317    6.8  34.9  -83.5   0.6852   1.7    7.1	4U 1700-377
256.3281 -36.2681    6.3  35.2  -80.8   0.7810   1.9   10.6	GX 349+2
262.9832 -24.7486    5.5  37.2  -59.2   0.8026   2.1    1.4	GX 1+4
264.9453 -44.3490    5.2  26.2  -91.0   0.5857   2.2   10.6	4U 1735-44
268.3785  -1.4069    7.0  52.3  -32.5  -1.1102  -1.6    2.8	SW J1753.5-0127
270.3256 -25.0202    3.5  32.1  -51.4   0.9258   3.4    4.2	GX 5-1
270.3798 -25.7094    4.6  31.6  -52.3   0.6750   2.5    4.6	GRS 1758-258
274.0242 -14.0020    2.2  38.7  -34.8   1.5590   5.1    2.3	GX 17+2
275.9140 -30.4881    6.2  24.8  -52.5   0.4145   1.9    7.3	H1820-303
285.1133 -24.7680    9.1  24.0  -28.4   0.2621   1.3   10.1	HT1900.1-2455
288.8696  10.9543    2.7  56.8   -3.6   4.4481   4.3    4.2	GRS 1915+105
262.9710 -33.8212    2.8  31.7  -72.0   1.2440   4.2    1.2	GX 354-0
277.5613 -21.2556    2.8  30.8  -37.0   1.0061   4.1 ------	UNKNOWN
Pre-slew background subtracted image of 15-350 keV band
Time interval of the image:
-8.284000 10.252000

# RAcent  DECcent POSerr Theta    Phi  PeakCts   SNR AngSep     Name
#  [deg]    [deg]    ['] [deg]  [deg]                   [']
256.1369 -37.9541   29.8  34.6  -83.5  -0.0390  -0.4    9.7	4U 1700-377
256.4259 -36.3274    4.8  35.1  -80.8   0.2507   2.4    5.8	GX 349+2
262.8910 -24.6069    0.0  37.3  -59.1  -0.1376  -1.4   10.5	GX 1+4
264.6854 -44.5074    5.9  26.3  -91.4  -0.1231  -1.9    4.2	4U 1735-44
268.3747  -1.5241   11.3  52.2  -32.6   0.1670   1.0    4.3	SW J1753.5-0127
270.2376 -25.1649    9.9  32.1  -51.7  -0.0777  -1.2    5.7	GX 5-1
270.4334 -25.8695    4.3  31.5  -52.4  -0.1774  -2.7   10.4	GRS 1758-258
273.8696 -14.0453    7.1  38.7  -35.1  -0.1197  -1.6    7.9	GX 17+2
275.8326 -30.2613    5.1  25.0  -52.3  -0.1300  -2.3    7.9	H1820-303
285.0192 -24.7800   44.2  24.1  -28.6  -0.0126  -0.3    8.5	HT1900.1-2455
288.8477  10.9529   10.0  56.8   -3.6   0.2900   1.2    2.9	GRS 1915+105
262.9494 -33.6964   13.8  31.8  -71.9   0.0624   0.8    8.5	GX 354-0
  5.4289 -51.8855    2.3  41.6  135.4   0.6437   5.0 ------	UNKNOWN
348.9437 -44.6526    0.7  33.0  118.9   1.4754  16.2 ------	UNKNOWN
270.4531 -85.0188    1.7  41.3 -164.3   0.4947   6.7 ------	UNKNOWN
Post-slew image of 15-350 keV band
Time interval of the image:
65.676600 398.278700
398.976000 783.028000

# RAcent  DECcent POSerr Theta    Phi  PeakCts   SNR AngSep     Name
#  [deg]    [deg]    ['] [deg]  [deg]                   [']
 53.3126 -54.7472    2.6  41.3  168.1   2.2498   4.5 ------	UNKNOWN
319.1877   5.0619    2.4  56.4    3.8   7.3511   4.7 ------	UNKNOWN
314.6398   1.4730    2.3  55.3   -3.0   5.3051   4.9 ------	UNKNOWN
 19.2017 -73.2867    2.6  31.8 -155.8   1.4599   4.4 ------	UNKNOWN
297.9804  -5.7961    3.4  58.9  -24.3   6.8862   3.4 ------	UNKNOWN
Plot creation:
Sat May 30 15:08:57 EDT 2015