Analysis for Trigger 576738
Analysis Summary
Notes:
- 1) No attempt has been made to eliminate the non-significant decimal places.
- 2) This is a special analysis for ground-detected GRB. The event data duration is likely to be shorter than the burst duration. In such cases, the burst durations are found using the quad-rate data, and spectral analyses are only available for event data range.
- 3) Some mask-weighted light curve plots might be missing because the time range is not completely covered by the event data range.
Special note: This burst was outside the BAT calibrated field of view (the FLUX mask region)
in the whole T100 range (~ T0+6 s to ~ T0+125 s; see figure below),
hence spectral analysis is not available, and the rest of the analyses use the DETECTION mask.
FLUX-mask-weighted light curve (pcodethresh=0.05; aperture=CALDB:FLUX)

======================================================================
                  BAT GRB EVENT DATA PROCESSING REPORT
    Process Script Ver: batgrbproduct v2.46
    Process Start Time: Sun May 10 20:58:58 EDT 2015
             Host Name: bat1
   Current Working Dir: /local/data/bat1/alien/Swift_3rdBATcatalog/event/scripts
======================================================================

  Trigger: 00576738      Segment: 000

  BAT Trigger Time: 405309896   [s; MET]
      Trigger Stop: 405310104   [s; MET]
               UTC: 2013-11-05T02:04:44.765060    [includes UTCF correction]
       Where From?: TDRSS position message

  BAT
    RA: 71.0114112270193   Dec: -62.9813396525796  [deg; J2000]

     Catalogged Source?: NO
     Point Source?:      YES
     GRB Indicated?:     YES    [ by BAT flight software ]
     Image S/N Ratio:    10.83
     Image Trigger?:     YES
     Rate S/N Ratio:     0  [ if not an image trigger ]
     Image S/N Ratio:    10.83

  Analysis Position:   [ source = BAT ]
    RA: 71.0114112270193   Dec: -62.9813396525796  [deg; J2000]

  Refined Position:   [ source = BAT pre-slew burst ]
    RA: 70.9731209722132   Dec: -63.0054706939753  [deg; J2000]
        { 04h 43m 53.5s , -63d 00' 19.7" }
         +/- 1.46374787060581 [arcmin] (estimated 90% radius based on SNR)
         +/- 0.518258927633105 [arcmin] (formal 1-sigma fit error)
    SNR: 17.6497267168363


  Partial Coding Fraction: 0.07714844    [ including projection effects ]

  Duration
     T90: 112.208000063896 +/- 4.102307689173
        Measured from: 11.1919999718666
                   to: 123.400000035763     [s; relative to TRIGTIME]
     T50: 73.6960000395775 +/- 1.87445991275442
        Measured from: 41.8799999952316
                   to: 115.576000034809     [s; relative to TRIGTIME]


  Fluence
     Peak Flux  (peak 1 second)
        Measured from: 116.635999977589
                   to: 117.635999977589     [s; relative to TRIGTIME]
     Total Fluence
        Measured from: 6.79199999570847
                   to: 125.336000025272     [s; relative to TRIGTIME]

             Band 1     Band 2     Band 3     Band 4
              15-25      25-50     50-100    100-350     keV
 Total     2.725174   3.787572   3.276326   1.131819
           0.212441   0.226743   0.200077   0.170509 [error]
 Peak      0.053249   0.216810   0.153324   0.063709
           0.022784   0.026260   0.024891   0.020923 [error]

     [ fluence units of on-axis counts / fully illuminated detector ]

======================================================================
=== Table of the duration information ==

        Value   tstart    tstop
T100  118.544    6.792  125.336
T90   112.208   11.192  123.400
T50    73.696   41.880  115.576
Peak    1.000  116.636  117.636
Click here for the BAT GCN circular template
Special notes of this burst
Image
Pre-slew 15.0-350.0 keV image (Event data with DETECTION mask; bkg subtracted)

#RAcent DECcent POSerr Theta  Phi  Peak_Cts  SNR Name
   70.9731   -63.0055   0.0109    41.7525   -96.7177        11.3123445     17.650 TRIG_00576738

Foreground time interval of the image:
  6.792 125.336 (delta_t = 118.544 [sec])
Background time interval of the image:
-239.000   6.792 (delta_t = 245.792 [sec])
Lightcurves
Notes:
- 1) The mask-weighted lightcurves have units of either count/det or counts/sec/det, where a det is 0.4 x 0.4 = 0.16 sq cm.
- 2) The verticle lines correspond to following: green dotted lines are T50 interval, black dotted lines are T90 interval, blue solid line(s) is a spacecraft slew start time, and orange solid line(s) is a spacecraft slew end time (for the best duration plot, slew times are marked by green arrows).
- 3) For lightcurves in unit of count rate, time of each bin is in the middle of the bin.
1 s binning
From T0-310 s to T0+310 s

From T100_start - 20 s to T100_end + 30 s

Full time interval

64 ms binning
Full time interval

From T100_start to T100_end

From T0-5 sec to T0+5 sec

16 ms binning
From T100_start-5 s to T100_start+5 s

8 ms binning
From T100_start-3 s to T100_start+3 s

2 ms binning
From T100_start-1 s to T100_start+1 s

SN=5 or 10 sec. binning (whichever binning is satisfied first)

SN=5 or 10 sec. binning (T < 200 sec)

Quad-rate summed light curves (from T0-300s to T0+1000s)

Mask shadow pattern (with DETECTION mask)

IMX = 0, IMY = 0
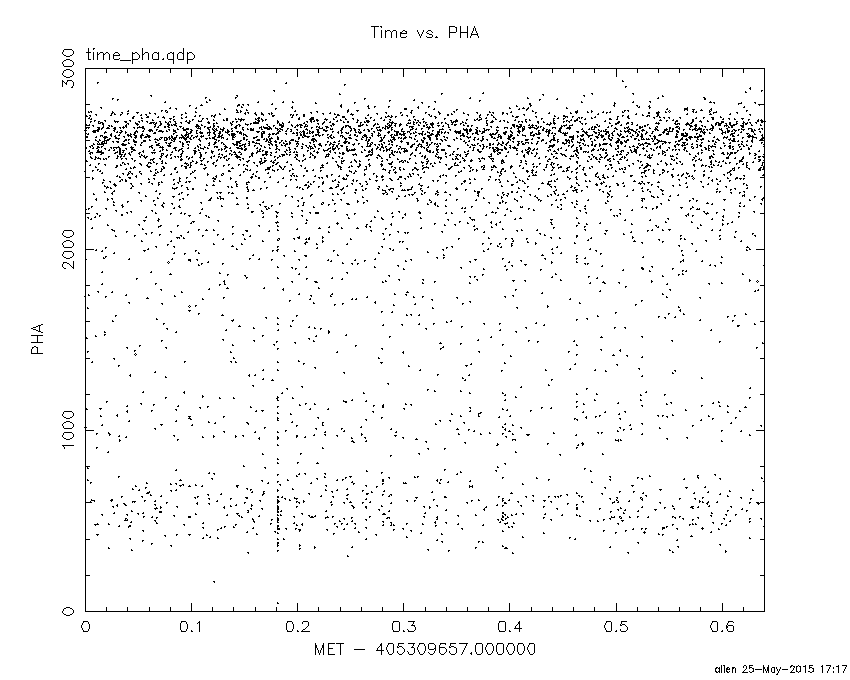
TIME vs. PHA plot around the beginning of event data (event_start to event_start+0.64s) with DETECTION mask
TIME vs. DetID plot around the beginning of event data (event_start to event_start+0.64s) with DETECTION mask

100 us light curve (15-350 keV; (event_start to event_start+0.64s)

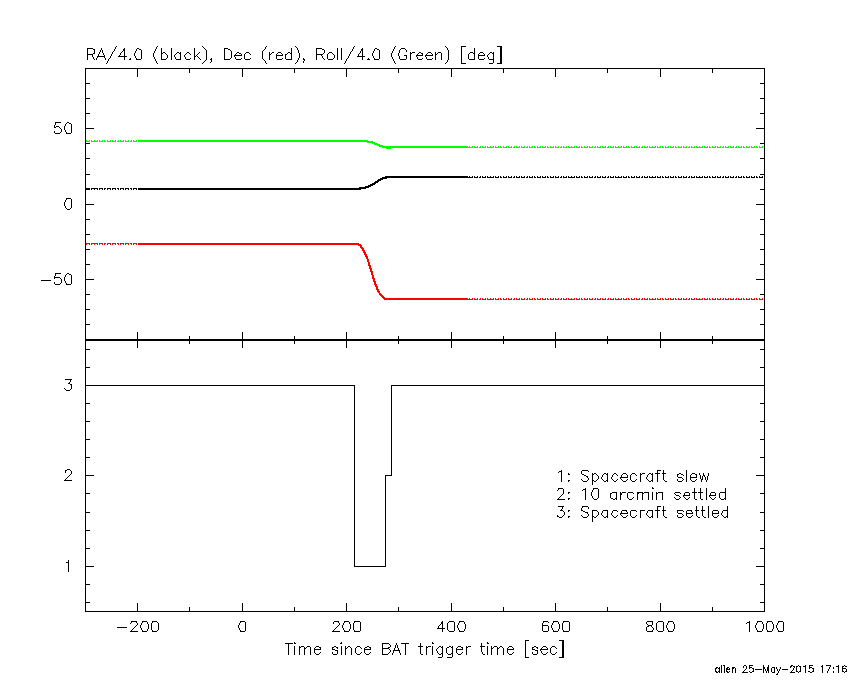
Spacecraft aspect plot
Bright source in the event data image
Event data image of 15-350 keV band
Time interval of the image:
6.792000 125.336000

# RAcent  DECcent POSerr Theta    Phi  PeakCts   SNR AngSep     Name
#  [deg]    [deg]    ['] [deg]  [deg]                   [']
 93.9910  -5.2897    2.8  54.5 -179.8   1.6588   4.2 ------	UNKNOWN
 94.3927 -16.0578    2.0  50.3 -167.3   1.5389   5.6 ------	UNKNOWN
 81.2559 -51.0569    2.5  39.3 -116.7   1.3365   4.6 ------	UNKNOWN
 70.9731 -63.0055    0.7  41.8  -96.7  11.3123  17.3 ------	UNKNOWN
Webpage updated on:
Mon May 25 17:17:23 EDT 2015