Special notes of this burst
Image
Pre-slew 15.0-350.0 keV image (Event data)
#   RAcent    DECcent   POSerr    Theta     Phi              Peak Cts       SNR   Name
  332.3503   -31.7616   0.0137    16.4117    48.8996         0.4802669     14.031 TRIG_00577968

Foreground time interval of the image:
 -0.472  10.701 (delta_t =  11.173 [sec])
Background time interval of the image:
-239.000  -0.472 (delta_t = 238.528 [sec])
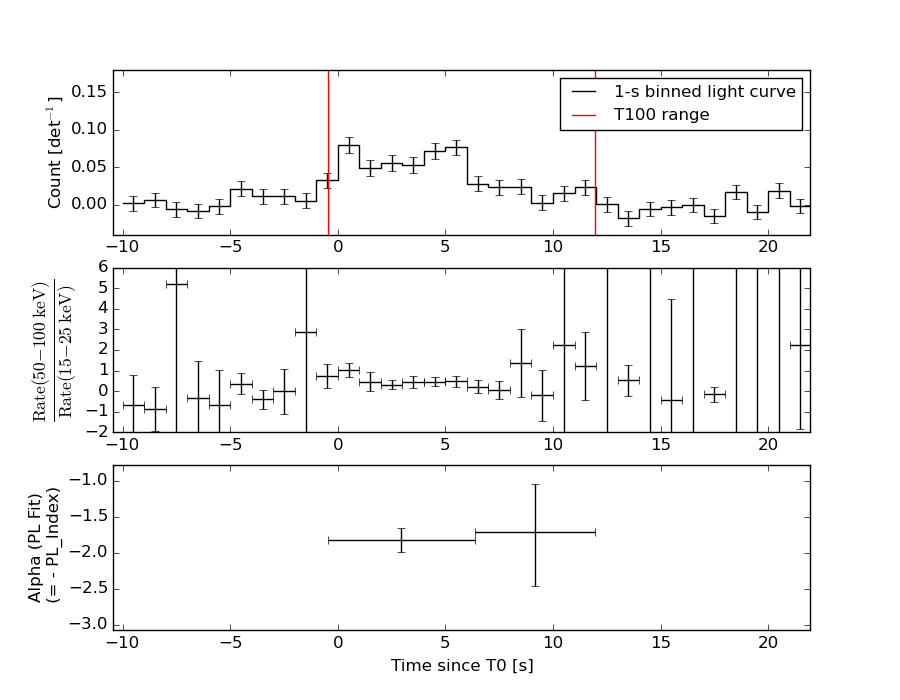
Lightcurves
Notes:
- 1) The mask-weighted light curves are using the flight position.
- 2) Multiple plots of different time binning/intervals are shown to cover all scenarios of short/long GRBs, rate/image triggers, and real/false positives.
- 3) For all the mask-weighted lightcurves, the y-axis units are counts/sec/det where a det is 0.4 x 0.4 = 0.16 sq cm.
- 4) The verticle lines correspond to following: green dotted lines are T50 interval, black dotted lines are T90 interval, blue solid line(s) is a spacecraft slew start time, and orange solid line(s) is a spacecraft slew end time.
- 5) Time of each bin is in the middle of the bin.
1 s binning
From T0-310 s to T0+310 s

From T100_start - 20 s to T100_end + 30 s

Full time interval

64 ms binning
Full time interval
From T100_start to T100_end

From T0-5 sec to T0+5 sec
16 ms binning
From T100_start-5 s to T100_start+5 s
Blue+Cyan dotted lines: Time interval of the scaled map
From 0.000000 to 1.024000
8 ms binning
From T100_start-3 s to T100_start+3 s

Blue+Cyan dotted lines: Time interval of the scaled map
From 0.000000 to 1.024000
2 ms binning
From T100_start-1 s to T100_start+1 s
Blue+Cyan dotted lines: Time interval of the scaled map
From 0.000000 to 1.024000
SN=5 or 10 sec. binning (whichever binning is satisfied first)
SN=5 or 10 sec. binning (T < 200 sec)
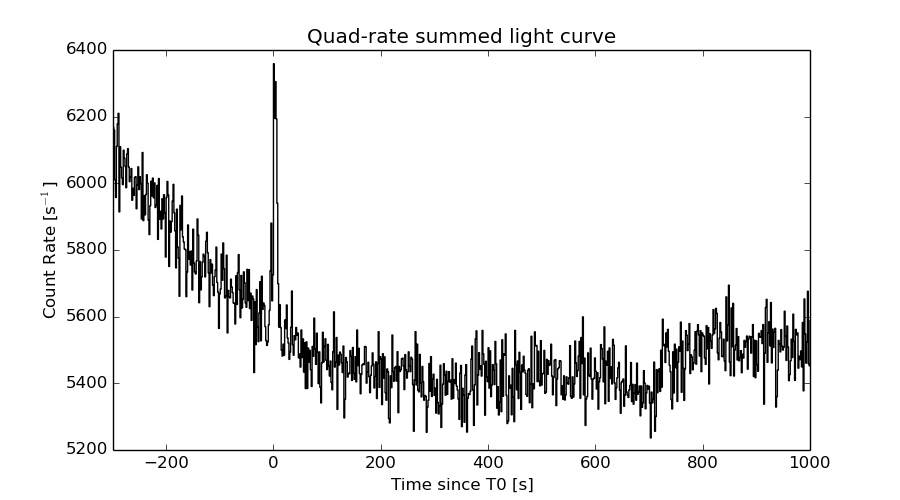
Quad-rate summed light curves (from T0-300s to T0+1000s)
Spectral Evolution
Spectra
Notes:
- 1) The fitting includes the systematic errors.
- 2) When the burst includes telescope slew time periods, the fitting uses an average response file made from multiple 5-s response files through out the slew time plus single time preiod for the non-slew times, and weighted by the total counts in the corresponding time period using addrmf. An average response file is needed becuase a spectral fit using the pre-slew DRM will introduce some errors in both a spectral shape and a normalization if the PHA file contains a lot of the slew/post-slew time interval.
- 3) For fits to more complicated models (e.g. a power-law over a cutoff power-law), the BAT team has decided to require a chi-square improvement of more than 6 for each extra dof.
Time averaged spectrum fit using the average DRM
Power-law model

Time interval is from   -0.472 sec. to   11.944 sec.

Spectral model in power-law:
------------------------------------------------------------
Parameters  : value       lower 90%   higher 90%
Photon index: 1.80568     ( -0.175531   0.182261 )
Norm@50keV  : 2.60469E-03    ( -0.000323883   0.000319202 )
------------------------------------------------------------
#Fit statistic : Chi-Squared =          52.53 using 59 PHA bins.
# Reduced chi-squared =         0.9215 for     57 degrees of freedom
# Null hypothesis probability =   6.434044e-01

Photon flux (15-150 keV)    in 12.42 sec: 0.359715 ( -0.0378566  0.0378615 ) ph/cm2/s
Energy fluence (15-150 keV)             : 2.97766e-07 ( -3.72698e-08  3.8034e-08 ) ergs/cm2
Cutoff power-law model

Time interval is from   -0.472 sec. to   11.944 sec.
Spectral model in the cutoff power-law:
------------------------------------------------------------
Parameters  : value       lower 90%   higher 90%
Photon index: -0.179941     ( -1.59258   1.11293 )
Epeak [keV] : 44.3046      ( -5.88966 10.5033 )
Norm@50keV  : 3.78826E-02    ( -0.0383174   0.301742 )
------------------------------------------------------------
#Fit statistic : Chi-Squared =          40.70 using 59 PHA bins.
# Reduced chi-squared =         0.7268 for     56 degrees of freedom
# Null hypothesis probability =   9.380711e-01

Photon flux (15-150 keV)    in 12.42 sec: 0.338416 ( -0.039327  0.039321 ) ph/cm2/s
Energy fluence (15-150 keV)             : 2.48152e-07 ( -3.71271e-08  4.2341e-08 ) ergs/cm2
Band function

Time interval is from   -0.472 sec. to   11.944 sec.

Spectral model in the Band function:
------------------------------------------------------------
Parameters  : value       lower 90%   higher 90%
alpha       : 0.186874   ( -0.750746   1.45926 )
beta        : -9.99999    ( 9.99999   1.43765e-05 )
Epeak [keV] : 44.2718      ( -5.73435 10.4955 )
Norm@50keV   : 3.82564E-02    ( -0.0039286   0.302623 )
------------------------------------------------------------
#Fit statistic : Chi-Squared =          40.70 using 59 PHA bins.
# Reduced chi-squared =         0.7400 for     55 degrees of freedom
# Null hypothesis probability =   9.248575e-01

Photon flux (15-150 keV)    in 12.42 sec: 0.341404 ( 6.6586  -0.039348 ) ph/cm2/s
Energy fluence (15-150 keV)             : 2.6233e-07 ( -2.62243e-07  -3.90336e-08 ) ergs/cm2
Single BB

Spectral model blackbody:
------------------------------------------------------------
Parameters  : value    Lower 90%  Upper 90%
kT [keV]    : 10.6571  (-1.04686  1.19219)
R^2/D10^2   : 0.142034  (-0.0470657   0.0676846)
(R is the radius in km and D10 is the distance to the source in units of 10 kpc)
------------------------------------------------------------
#Fit statistic : Chi-Squared =          42.87 using 59 PHA bins.
# Reduced chi-squared =         0.7521 for     57 degrees of freedom
# Null hypothesis probability =   9.174840e-01

Energy  Fluence     90% Error
[keV]   [erg/cm2]   [erg/cm2]
15- 25  4.157e-08   7.415e-09
25- 50  1.128e-07   1.602e-08
50-150  7.057e-08   1.915e-08
15-150  2.249e-07   2.962e-08
Thermal bremsstrahlung (OTTB)

Spectral model: thermal bremsstrahlung
------------------------------------------------------------
Parameters  : value         Lower 90%    Upper 90%
kT [keV]    : 84.7651       (-24.2147      43.5184)
Norm        : 1.68667       (-0.236593     0.281234)
------------------------------------------------------------
#Fit statistic : Chi-Squared =          46.00 using 59 PHA bins.
# Reduced chi-squared =         0.8070 for     57 degrees of freedom
# Null hypothesis probability =   8.512075e-01

Energy  Fluence     90% Error
[keV]   [erg/cm2]   [erg/cm2]
15- 25  5.453e-08   7.967e-09
25- 50  9.100e-08   1.080e-08
50-150  1.334e-07   6.145e-08
15-150  2.790e-07   6.253e-08
Double BB

------------------------------------------------------------
Parameters  : value         Lower 90%    Upper 90%
kT1 [keV]   : 9.16397        (      )
R1^2/D10^2  : 0.211382        (-0.186682      0.216805)
kT2 [keV]   : 27.9695        (-29.3335      -31.6562)
R2^2/D10^2  : 1.29958E-03    (-0.00092018   0.0625629)
------------------------------------------------------------
#Fit statistic : Chi-Squared =          41.35 using 59 PHA bins.
#Fit statistic : Chi-Squared =          38.94 using 59 PHA bins.
# Reduced chi-squared =         0.7518 for     55 degrees of freedom
# Reduced chi-squared =         0.7080 for     55 degrees of freedom
# Null hypothesis probability =   9.135702e-01
# Null hypothesis probability =   9.502219e-01

Energy  Fluence     90% Error
[keV]   [erg/cm2]   [erg/cm2]
15- 25  4.591e-08   1.610e-08
25- 50  1.077e-07   3.327e-08
50-150  7.845e-08   2.928e-08
15-150  2.321e-07   6.227e-08
Peak spectrum fit
Power-law model

Time interval is from   -0.236 sec. to    0.764 sec.

Spectral model in power-law:
------------------------------------------------------------
Parameters  : value       lower 90%   higher 90%
Photon index: 1.57859     ( -0.298384   0.312324 )
Norm@50keV  : 5.20681E-03    ( -0.00112725   0.00111371 )
------------------------------------------------------------
#Fit statistic : Chi-Squared =          60.31 using 59 PHA bins.
# Reduced chi-squared =          1.058 for     57 degrees of freedom
# Null hypothesis probability =   3.569044e-01

Photon flux (15-150 keV)    in 1 sec: 0.664717 ( -0.134316  0.134401 ) ph/cm2/s
Energy fluence (15-150 keV)             : 4.88358e-08 ( -1.11345e-08  1.14345e-08 ) ergs/cm2
Cutoff power-law model

Time interval is from   -0.236 sec. to    0.764 sec.
Spectral model in the cutoff power-law:
------------------------------------------------------------
Parameters  : value       lower 90%   higher 90%
Photon index: -0.953679     ( -2.57552   1.63426 )
Epeak [keV] : 53.7239      ( -10.15 20.8399 )
Norm@50keV  : 0.118081    ( -0.11829   2.57792 )
------------------------------------------------------------
#Fit statistic : Chi-Squared =          51.98 using 59 PHA bins.
# Reduced chi-squared =         0.9283 for     56 degrees of freedom
# Null hypothesis probability =   6.276191e-01

Photon flux (15-150 keV)    in 1 sec: 0.631556 ( -0.068173  0.134949 ) ph/cm2/s
Energy fluence (15-150 keV)             : 4.27642e-08 ( -1.0133e-08  1.13238e-08 ) ergs/cm2
Band function

Time interval is from   -0.236 sec. to    0.764 sec.

Spectral model in the Band function:
------------------------------------------------------------
Parameters  : value       lower 90%   higher 90%
alpha       : 0.944385   ( -1.31891   2.93147 )
beta        : -10.0000    ( 10   0 )
Epeak [keV] : 53.7075      ( -10.2131 20.8357 )
Norm@50keV   : 0.117058    ( -0.117002   2.59766 )
------------------------------------------------------------
#Fit statistic : Chi-Squared =          51.98 using 59 PHA bins.
# Reduced chi-squared =         0.9452 for     55 degrees of freedom
# Null hypothesis probability =   5.906017e-01

Photon flux (15-150 keV)    in 1 sec:  (    ) ph/cm2/s
Energy fluence (15-150 keV)             : 0 ( 0  0 ) ergs/cm2
Single BB

Spectral model blackbody:
------------------------------------------------------------
Parameters  : value    Lower 90%  Upper 90%
kT [keV]    : 13.4442  (-2.30987  2.85724)
R^2/D10^2   : 0.123409  (-0.0625144   0.11829)
(R is the radius in km and D10 is the distance to the source in units of 10 kpc)
------------------------------------------------------------
#Fit statistic : Chi-Squared =          52.17 using 59 PHA bins.
# Reduced chi-squared =         0.9153 for     57 degrees of freedom
# Null hypothesis probability =   6.564761e-01

Energy  Fluence     90% Error
[keV]   [erg/cm2]   [erg/cm2]
15- 25  4.726e-09   1.732e-09
25- 50  1.687e-08   4.555e-09
50-150  1.964e-08   8.673e-09
15-150  4.124e-08   1.114e-08
Thermal bremsstrahlung (OTTB)

Spectral model: thermal bremsstrahlung
------------------------------------------------------------
Parameters  : value         Lower 90%    Upper 90%
kT [keV]    : 145.207       (-72.4394      -143.413)
Norm        : 2.82448       (-0.594061     0.735695)
------------------------------------------------------------
#Fit statistic : Chi-Squared =          57.69 using 59 PHA bins.
# Reduced chi-squared =          1.012 for     57 degrees of freedom
# Null hypothesis probability =   4.495299e-01

Energy  Fluence     90% Error
[keV]   [erg/cm2]   [erg/cm2]
15- 25  7.274e-09   4.190e-09
25- 50  1.342e-08   7.610e-09
50-150  2.613e-08   1.623e-08
15-150  4.682e-08   2.789e-08
Double BB

Spectral model: bbodyrad<1> + bbodyrad<2>
------------------------------------------------------------
Parameters  : value         Lower 90%    Upper 90%
kT1 [keV]   : 6.65144        (-6.65145      -6.65145)
R1^2/D10^2  : 0.242578        (-0.242499      -0.242499)
kT2 [keV]   : 14.6665        (-14.6667      -14.6667)
R2^2/D10^2  : 8.14109E-02    (-0.0814048   0.153322)
------------------------------------------------------------
#Fit statistic : Chi-Squared =          51.93 using 59 PHA bins.
# Reduced chi-squared =         0.9442 for     55 degrees of freedom
# Null hypothesis probability =   5.926259e-01

Energy  Fluence     90% Error
[keV]   [erg/cm2]   [erg/cm2]
15- 25  5.309e-09   3.922e-09
25- 50  1.633e-08   1.003e-08
50-150  2.102e-08   1.441e-08
15-150  4.266e-08   2.806e-08
Pre-slew spectrum (Pre-slew PHA with pre-slew DRM)
Power-law model
Spectral model in power-law:
------------------------------------------------------------
Parameters  : value       lower 90%   higher 90%
Photon index: 1.84956     ( -0.174393   0.181616 )
Norm@50keV  : 2.73010E-03    ( -0.000344049   0.000339258 )
------------------------------------------------------------
#Fit statistic : Chi-Squared =          56.90 using 59 PHA bins.
# Reduced chi-squared =         0.9982 for     57 degrees of freedom
# Null hypothesis probability =   4.789755e-01

Photon flux (15-150 keV)    in 11.17 sec: 0.383677 ( -0.040208  0.0402107 ) ph/cm2/s
Energy fluence (15-150 keV)             : 2.8039e-07 ( -3.50386e-08  3.58087e-08 ) ergs/cm2
Cutoff power-law model

Spectral model in the cutoff power-law:
------------------------------------------------------------
Parameters  : value       lower 90%   higher 90%
Photon index: -0.534118     ( -1.71574   1.21033 )
Epeak [keV] : 42.2472      ( -4.87929 7.56866 )
Norm@50keV  : 6.93040E-02    ( -0.0712188   0.672151 )
------------------------------------------------------------
#Fit statistic : Chi-Squared =          41.50 using 59 PHA bins.
# Reduced chi-squared =         0.7411 for     56 degrees of freedom
# Null hypothesis probability =   9.258593e-01

Photon flux (15-150 keV)    in 11.17 sec: 0.358333 ( -0.041543  0.041486 ) ph/cm2/s
Energy fluence (15-150 keV)             : 2.29642e-07 ( -3.24835e-08  3.73893e-08 ) ergs/cm2
Band function

Spectral model in the Band function:
------------------------------------------------------------
Parameters  : value       lower 90%   higher 90%
alpha       : 1.39454   ( -1.94301   1.97869 )
beta        : -3.15400    ( 3.14787   0.747417 )
Epeak [keV] : 39.3630      ( -4.44133 7.87218 )
Norm@50keV   : 0.247362    ( -0.246902   5.3276 )
------------------------------------------------------------
#Fit statistic : Chi-Squared =          40.05 using 59 PHA bins.
# Reduced chi-squared =         0.7282 for     55 degrees of freedom
# Null hypothesis probability =   9.351017e-01

Photon flux (15-150 keV)    in 11.17 sec:  (    ) ph/cm2/s
Energy fluence (15-150 keV)             : 2.43612e-07 ( -2.43534e-07  -3.67571e-08 ) ergs/cm2
S(25-50 keV) vs. S(50-100 keV) plot
S(25-50 keV)  = 8.40e-08
S(50-100 keV) = 9.61e-08
T90 vs. Hardness ratio plot

T90                                   = 10.8799999952316 sec.
Hardness ratio (energy fluence ratio) = 1.14405
Color vs. Color plot
Count Ratio  (25-50 keV) / (15-25 keV) = 1.41909
Count Ratio (50-100 keV) / (15-25 keV) = 0.529389
Mask shadow pattern

IMX = 1.936229680931073E-01, IMY = -2.219509725843758E-01
TIME vs. PHA plot around the trigger time

Blue+Cyan dotted lines: Time interval of the scaled map
From 0.000000 to 1.024000
TIME vs. DetID plot around the trigger time

Blue+Cyan dotted lines: Time interval of the scaled map
From 0.000000 to 1.024000
100 us light curve (15-350 keV)
Blue+Cyan dotted lines: Time interval of the scaled map
From 0.000000 to 1.024000
Spacecraft aspect plot

Bright source in the pre-burst/pre-slew/post-slew images
Pre-burst image of 15-350 keV band
Time interval of the image:
-239.000000 -0.472000

# RAcent  DECcent POSerr Theta    Phi  PeakCts   SNR AngSep     Name
#  [deg]    [deg]    ['] [deg]  [deg]                   [']
265.0006 -44.3917    0.0  40.5  -84.7  -1.8837  -2.1   11.6	4U 1735-44
276.0622 -30.2429   20.8  40.5  -59.0   0.2989   0.6   10.3	H1820-303
285.0116 -24.9561   80.2  38.1  -44.4  -0.0433  -0.1    2.5	HT1900.1-2455
341.5814  -4.2270    2.6  45.3   48.7   3.4616   4.5 ------	UNKNOWN
315.9188  -0.9278    3.0  46.6   12.5   1.5347   3.9 ------	UNKNOWN
 73.2076 -63.7450    2.5  56.1  173.9   5.4577   4.6 ------	UNKNOWN
304.3507  -1.0840    2.9  49.1   -2.7   1.5861   4.1 ------	UNKNOWN
259.1652 -52.1655    3.3  41.1  -98.0   3.5003   3.5 ------	UNKNOWN
Pre-slew background subtracted image of 15-350 keV band
Time interval of the image:
-0.472000 10.700600

# RAcent  DECcent POSerr Theta    Phi  PeakCts   SNR AngSep     Name
#  [deg]    [deg]    ['] [deg]  [deg]                   [']
264.6562 -44.5494   26.0  40.7  -85.1   0.0612   0.4    7.0	4U 1735-44
276.0834 -30.4038    5.0  40.4  -59.2   0.1858   2.3    8.5	H1820-303
285.0179 -24.7862   12.0  38.2  -44.3   0.0533   1.0    8.1	HT1900.1-2455
332.3503 -31.7616    0.8  16.4   48.9   0.4802  14.0 ------	UNKNOWN
 20.5372 -84.8007    2.1  40.3 -162.5   0.2641   5.5 ------	UNKNOWN
Post-slew image of 15-350 keV band
Time interval of the image:
49.900610 685.900600

# RAcent  DECcent POSerr Theta    Phi  PeakCts   SNR AngSep     Name
#  [deg]    [deg]    ['] [deg]  [deg]                   [']
285.1016 -24.8487    4.9  41.8  -71.5  -4.4126  -2.4    5.6	HT1900.1-2455
 38.8105 -78.4109    3.2  54.3 -171.7   4.7951   3.6 ------	UNKNOWN
290.9302 -25.8021    3.3  36.5  -70.0   3.0620   3.6 ------	UNKNOWN
281.8027 -42.2154    4.2  41.1  -98.1   6.3447   2.7 ------	UNKNOWN
Plot creation:
Sat May 30 15:06:53 EDT 2015