Special notes of this burst
Image
Pre-slew 15.0-50.0 keV image (Event data)
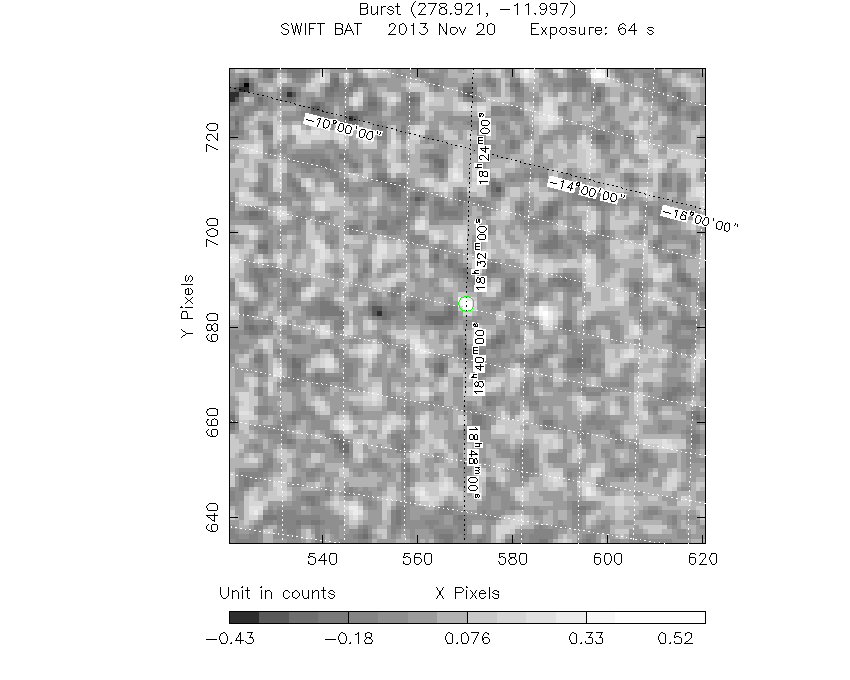
#RAcent DECcent POSerr Theta  Phi  Peak_Cts  SNR Name
278.921 -11.997 0.000 38.085 -33.956 0.693 6.794 TRIG_00578227

Image time interval: 0.000 to 64.000 [sec]
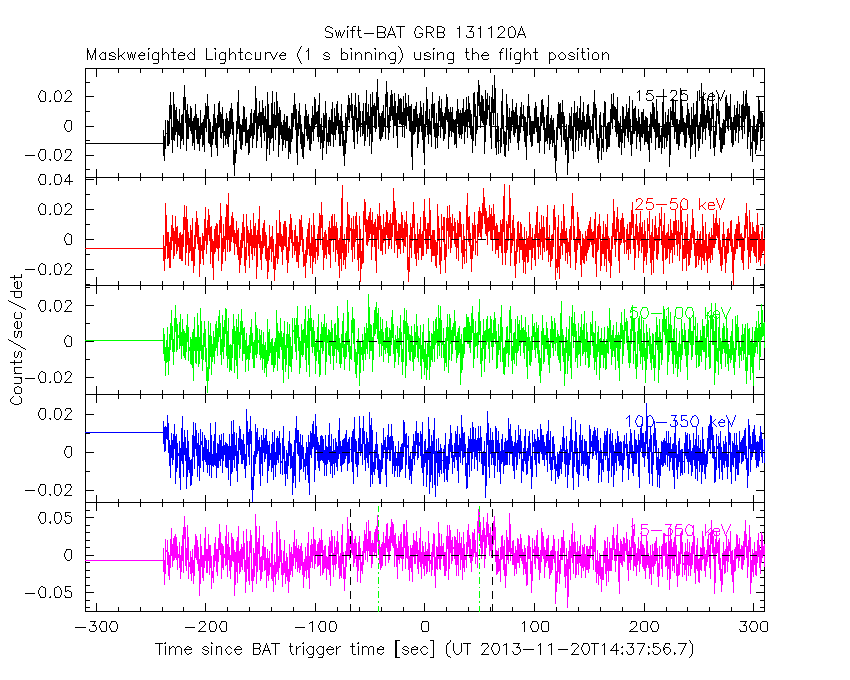
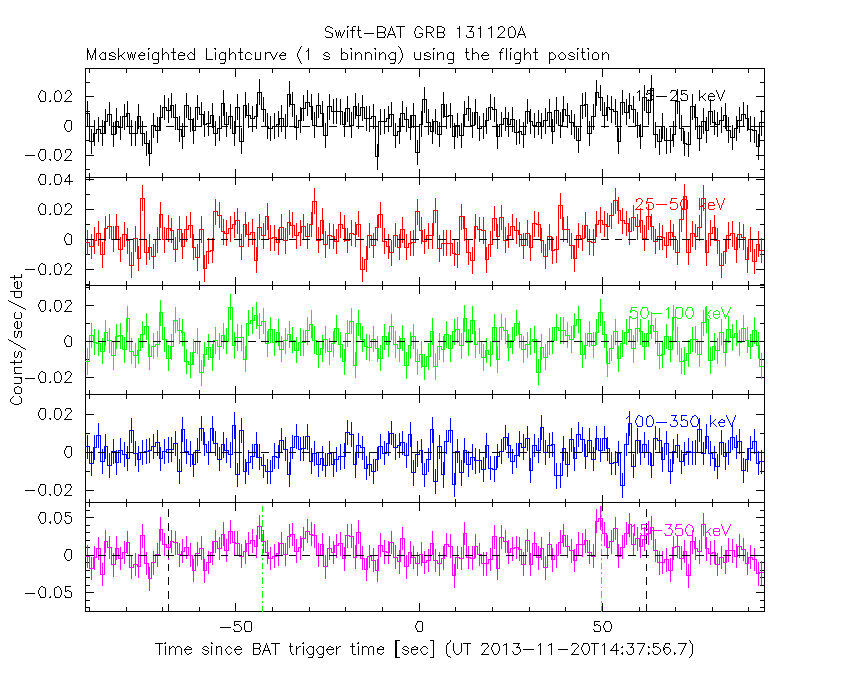
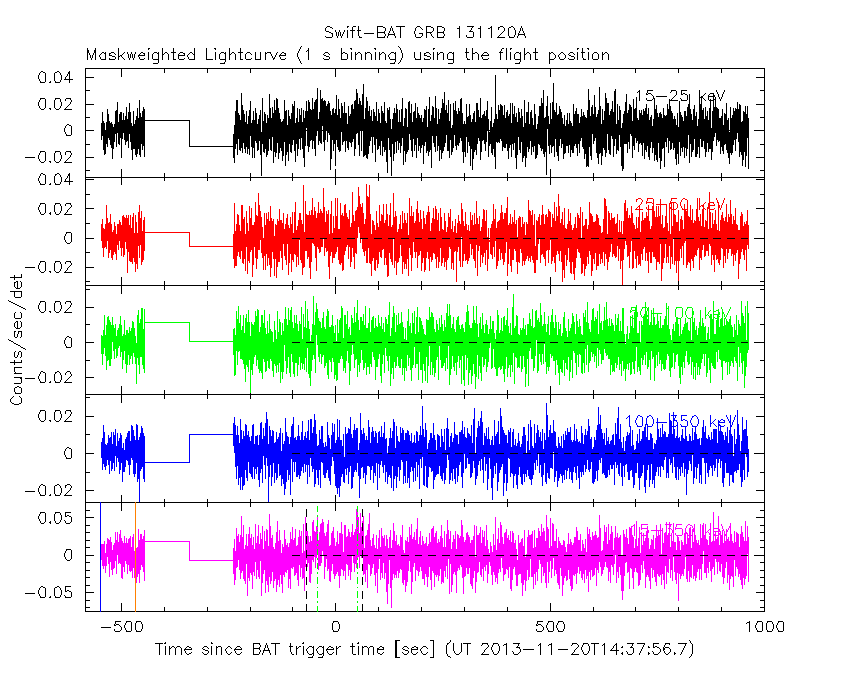
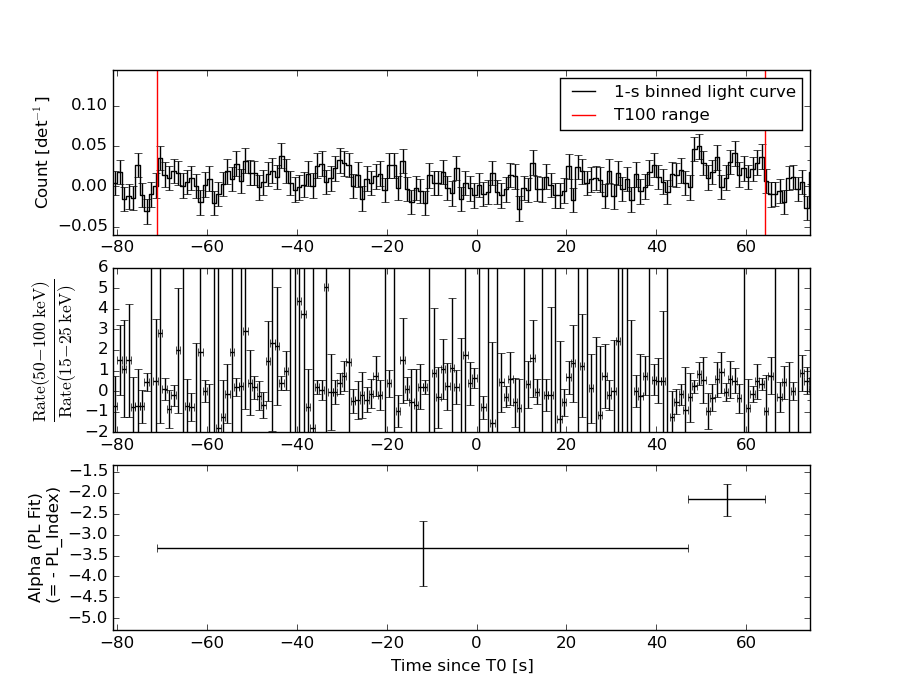
Lightcurves
Notes:
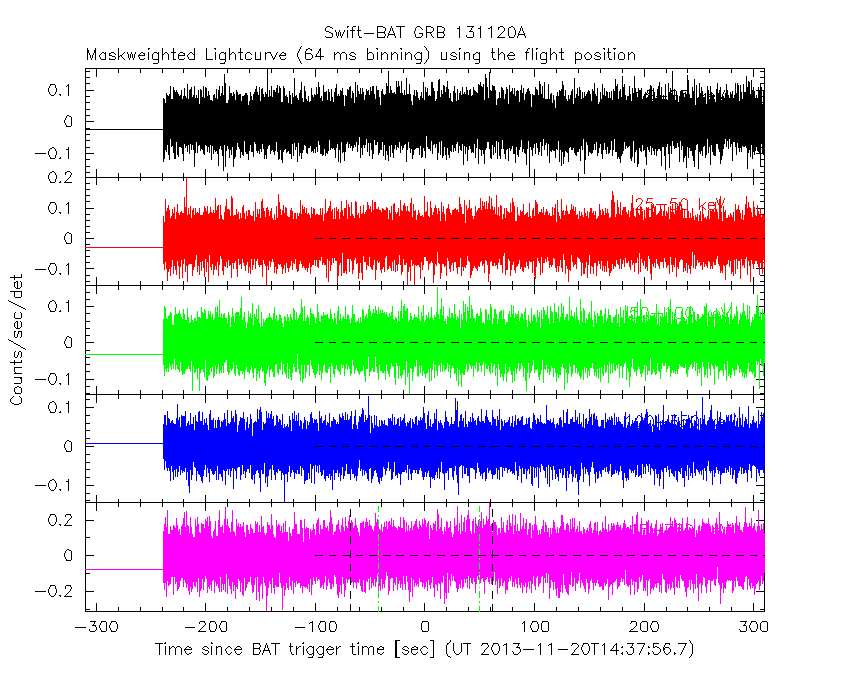
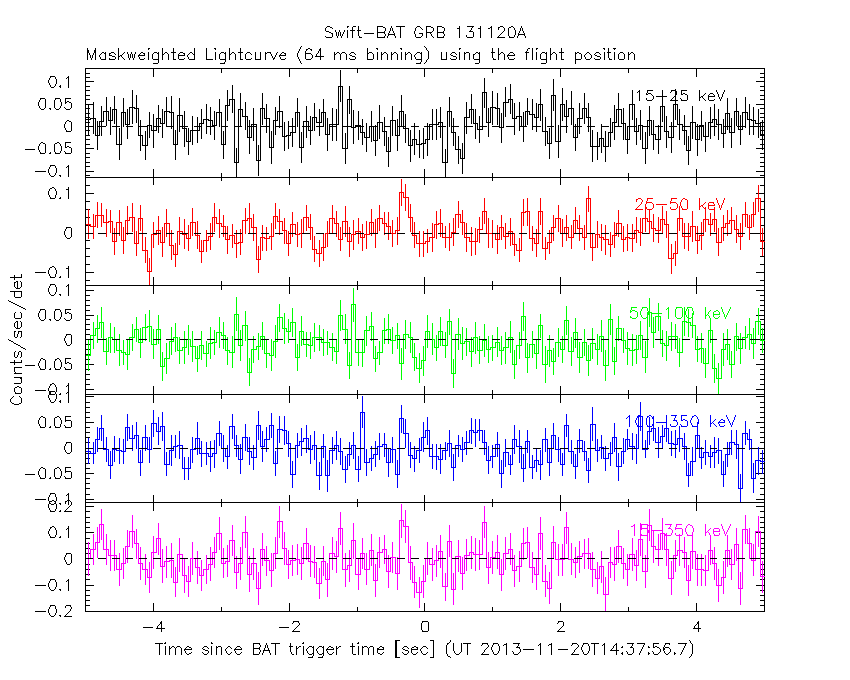
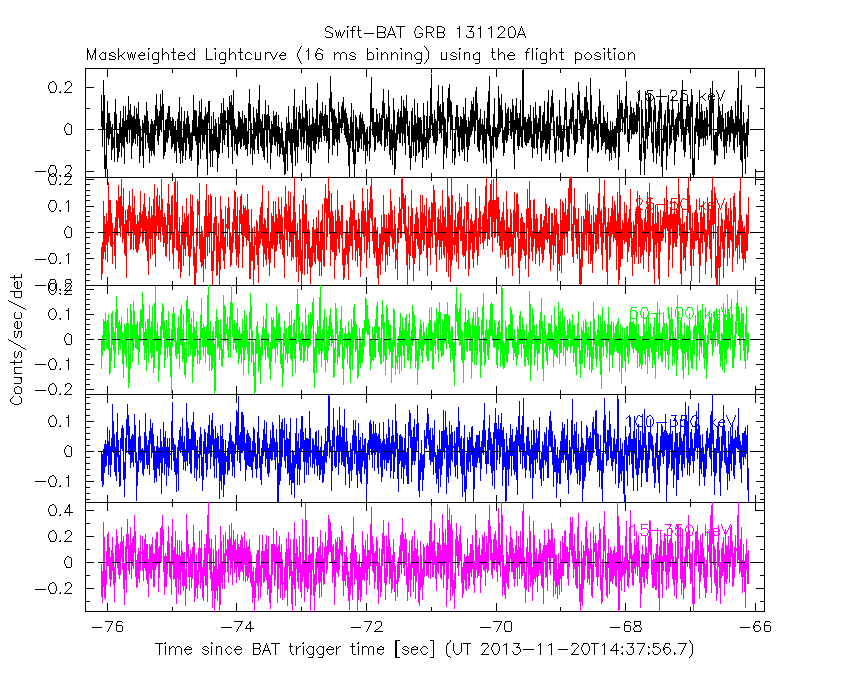
- 1) The mask-weighted light curves are using the flight position.
- 2) Multiple plots of different time binning/intervals are shown to cover all scenarios of short/long GRBs, rate/image triggers, and real/false positives.
- 3) For all the mask-weighted lightcurves, the y-axis units are counts/sec/det where a det is 0.4 x 0.4 = 0.16 sq cm.
- 4) The verticle lines correspond to following: green dotted lines are T50 interval, black dotted lines are T90 interval, blue solid line(s) is a spacecraft slew start time, and orange solid line(s) is a spacecraft slew end time.
- 5) Time of each bin is in the middle of the bin.
1 s binning
From T0-310 s to T0+310 s
From T100_start - 20 s to T100_end + 30 s
Full time interval
64 ms binning
Full time interval
From T100_start to T100_end
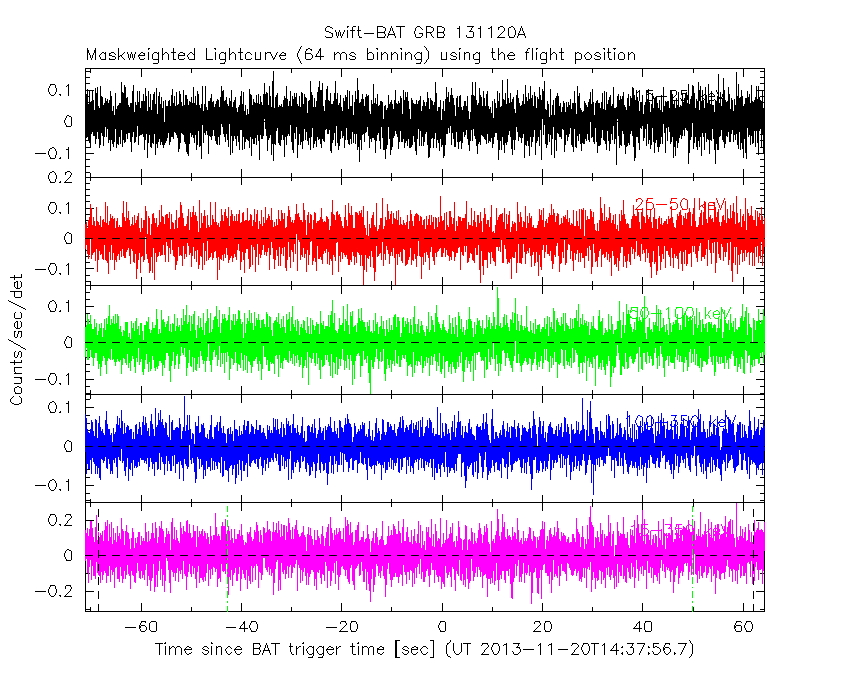
From T0-5 sec to T0+5 sec
16 ms binning
From T100_start-5 s to T100_start+5 s
Blue+Cyan dotted lines: Time interval of the scaled map
From 0.000000 to 64.000000
8 ms binning
From T100_start-3 s to T100_start+3 s
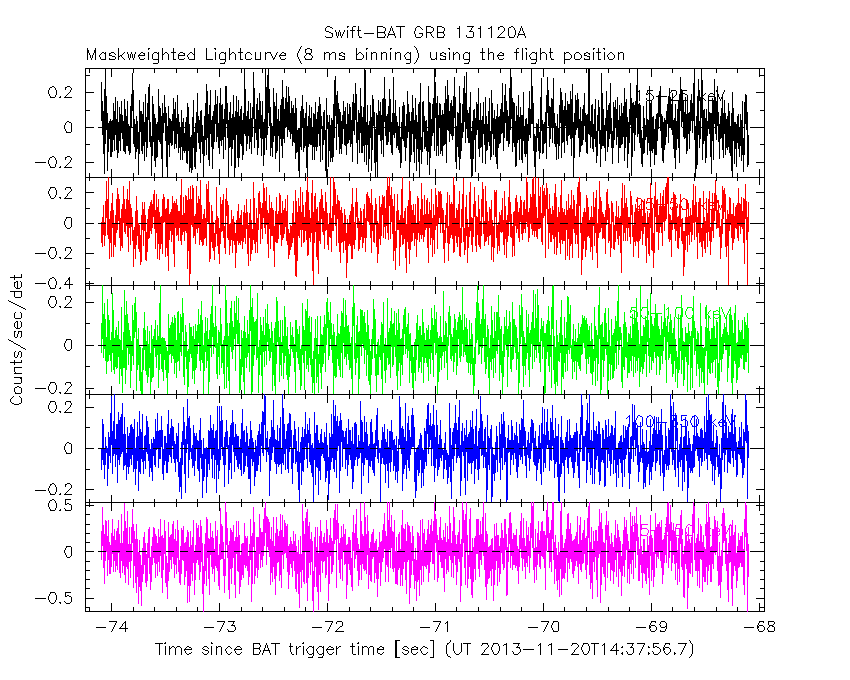
Blue+Cyan dotted lines: Time interval of the scaled map
From 0.000000 to 64.000000
2 ms binning
From T100_start-1 s to T100_start+1 s
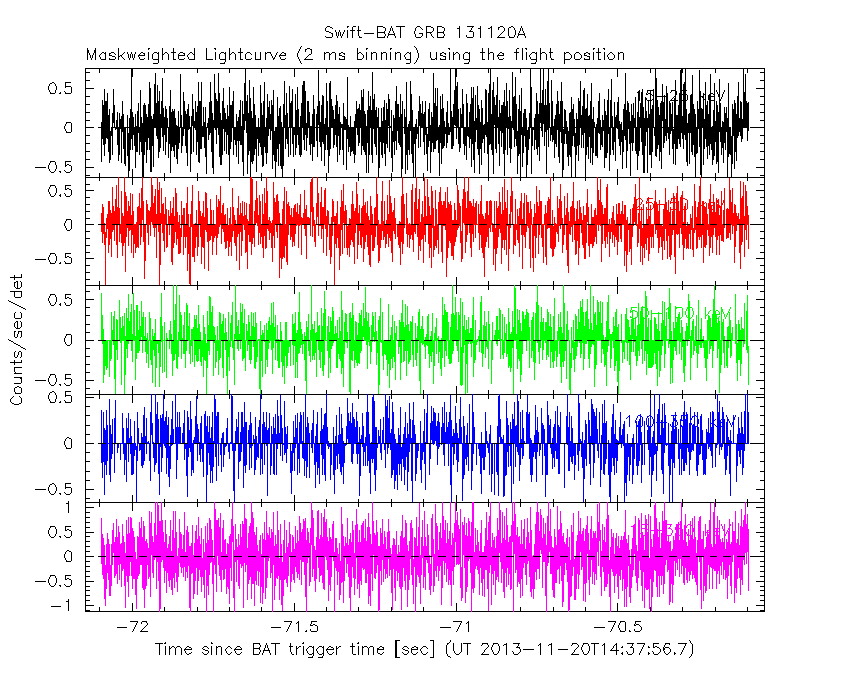
Blue+Cyan dotted lines: Time interval of the scaled map
From 0.000000 to 64.000000
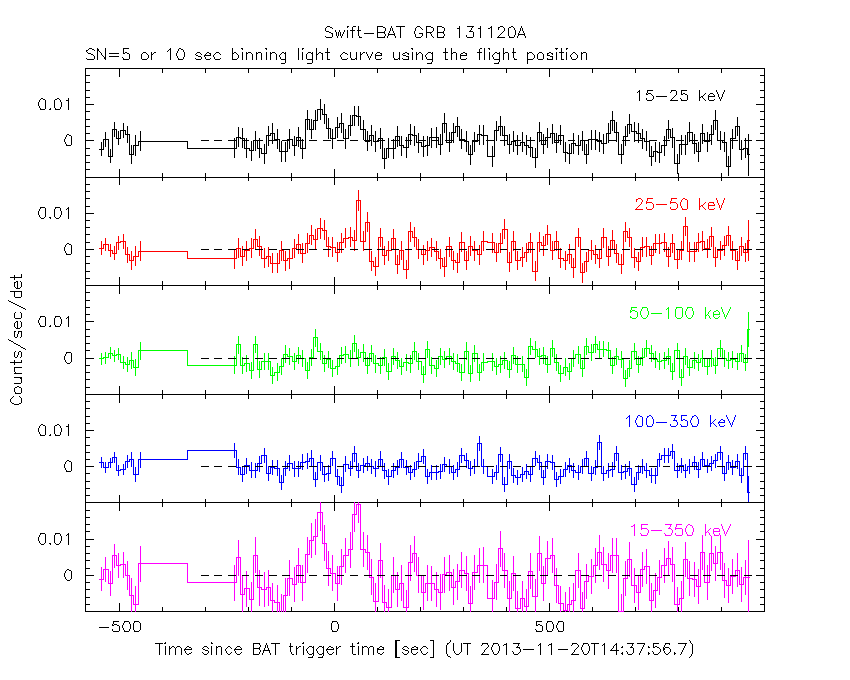
SN=5 or 10 sec. binning (whichever binning is satisfied first)
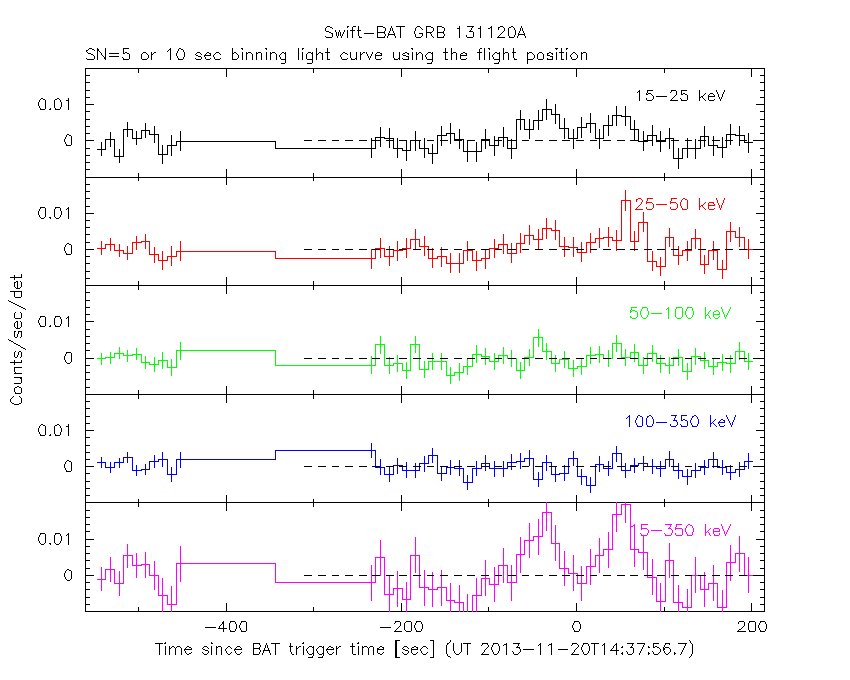
SN=5 or 10 sec. binning (T < 200 sec)
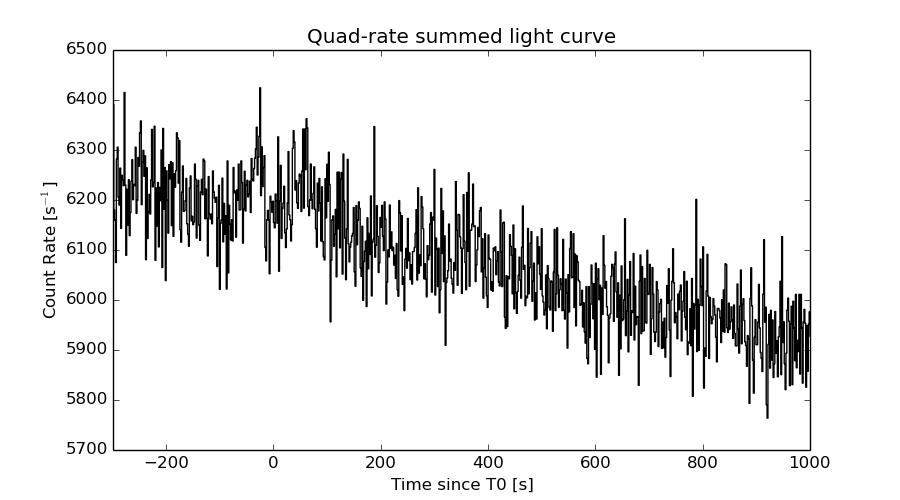
Quad-rate summed light curves (from T0-300s to T0+1000s)
Spectral Evolution
Spectra
Notes:
- 1) The fitting includes the systematic errors.
- 2) When the burst includes telescope slew time periods, the fitting uses an average response file made from multiple 5-s response files through out the slew time plus single time preiod for the non-slew times, and weighted by the total counts in the corresponding time period using addrmf. An average response file is needed becuase a spectral fit using the pre-slew DRM will introduce some errors in both a spectral shape and a normalization if the PHA file contains a lot of the slew/post-slew time interval.
- 3) For fits to more complicated models (e.g. a power-law over a cutoff power-law), the BAT team has decided to require a chi-square improvement of more than 6 for each extra dof.
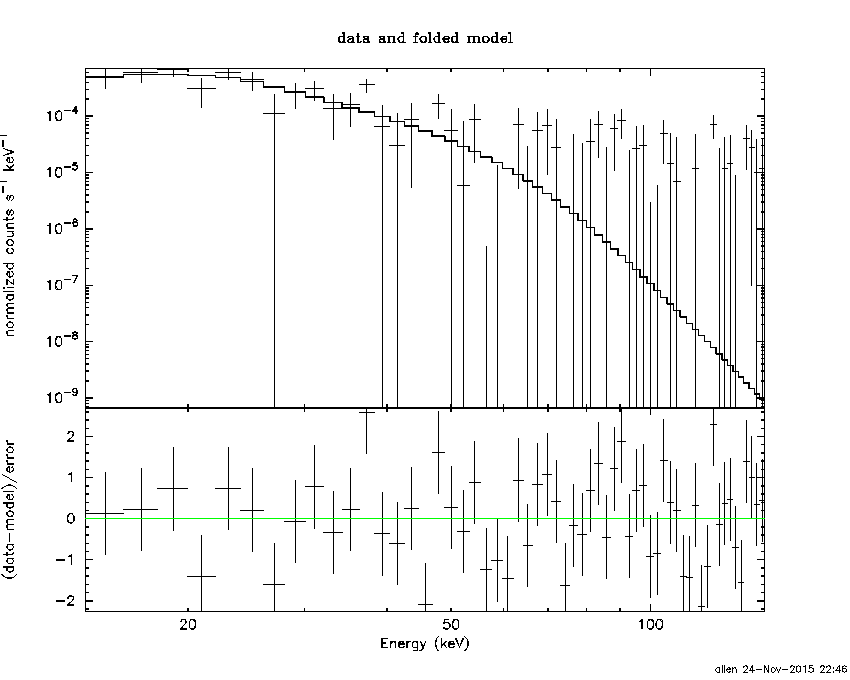
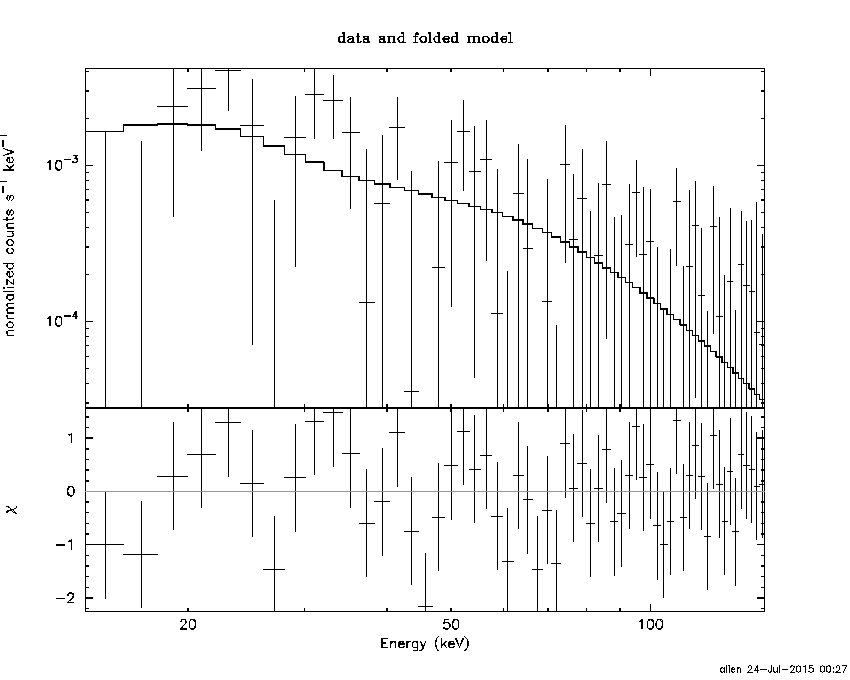
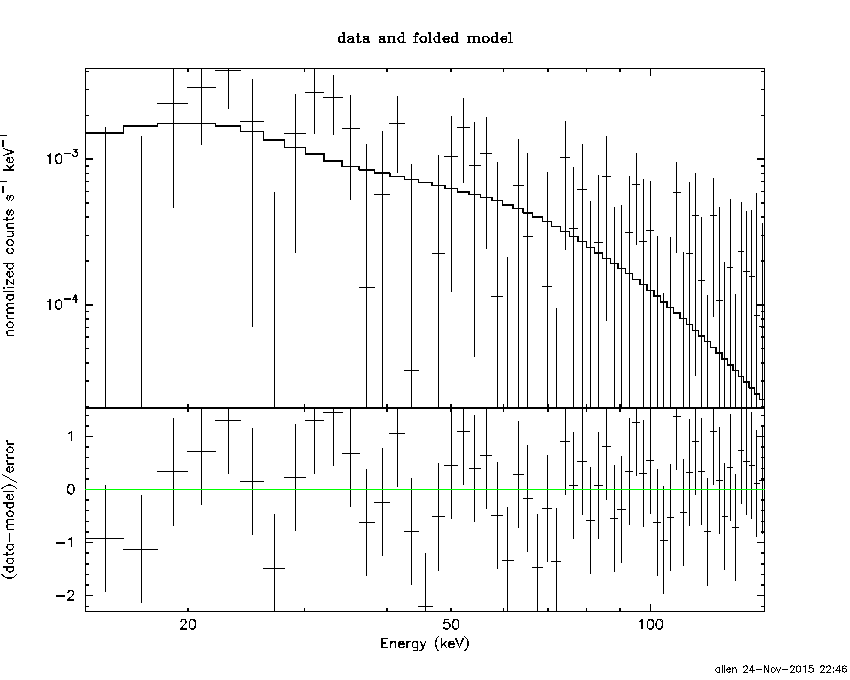
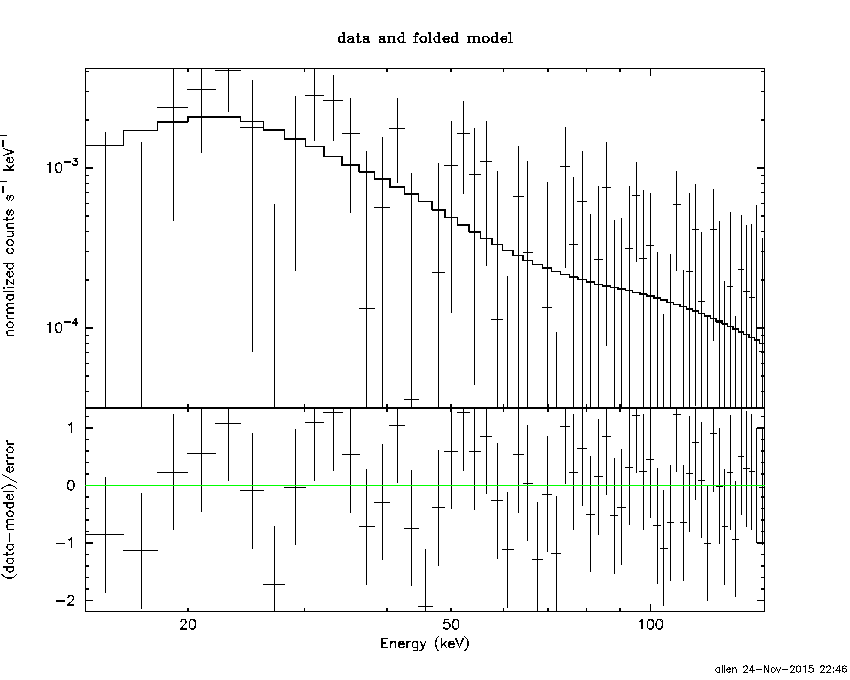
Time averaged spectrum fit using the average DRM
Power-law model
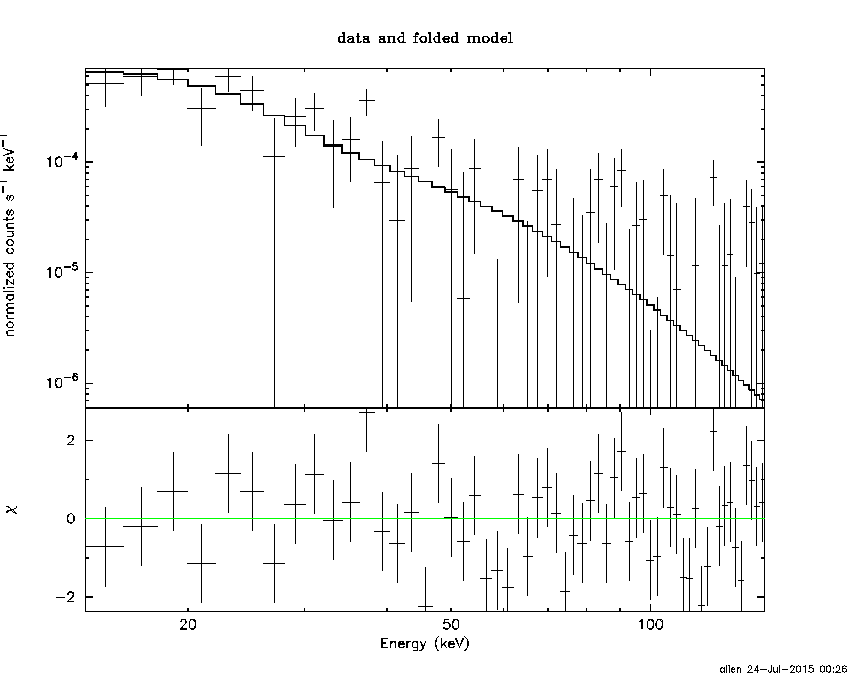
Time interval is from  -71.096 sec. to   64.264 sec.

Spectral model in power-law:
------------------------------------------------------------
Parameters  : value       lower 90%   higher 90%
Photon index: 2.87316     ( -0.429281   0.520459 )
Norm@50keV  : 3.95458E-04    ( -0.000151789   0.00016163 )
------------------------------------------------------------
#Fit statistic : Chi-Squared =          69.29 using 59 PHA bins.
# Reduced chi-squared =          1.216 for     57 degrees of freedom
# Null hypothesis probability =   1.273736e-01

Photon flux (15-150 keV)    in 135.4 sec: 9.93289E-02 ( -0.0190967  0.0191269 ) ph/cm2/s
Energy fluence (15-150 keV)             : 6.08607e-07 ( -1.45551e-07  1.57327e-07 ) ergs/cm2
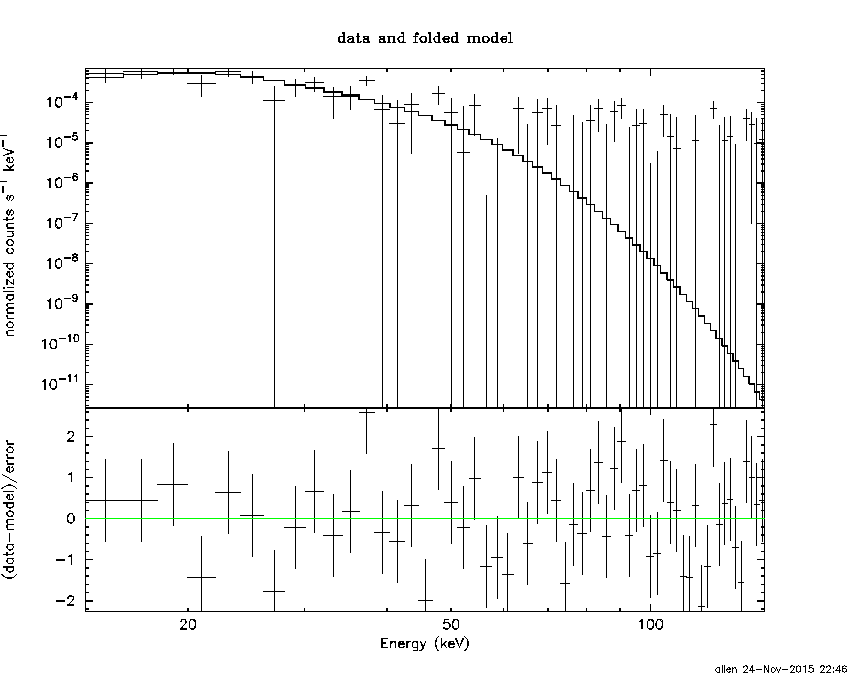
Cutoff power-law model
Time interval is from  -71.096 sec. to   64.264 sec.
Spectral model in the cutoff power-law:
------------------------------------------------------------
Parameters  : value       lower 90%   higher 90%
Photon index: 0.771410     (     )
Epeak [keV] : 17.1559      (   )
Norm@50keV  : 1.19179E-02    (     )
------------------------------------------------------------
#Fit statistic : Chi-Squared =          66.93 using 59 PHA bins.
# Reduced chi-squared =          1.195 for     56 degrees of freedom
# Null hypothesis probability =   1.505403e-01

Photon flux (15-150 keV)    in 135.4 sec: 9.63839E-02 ( -0.0093144  0.0187151 ) ph/cm2/s
Energy fluence (15-150 keV)             : 5.25793e-07 ( -1.14756e-07  1.52688e-07 ) ergs/cm2
Band function
Time interval is from  -71.096 sec. to   64.264 sec.

Spectral model in the Band function:
------------------------------------------------------------
Parameters  : value       lower 90%   higher 90%
alpha       : 0.304770   ( 1.72899   1.72899 )
beta        : -10.0000    ( 9.99981   19.9977 )
Epeak [keV] : 20.9230      ( -4.62946 7.78411 )
Norm@50keV   : 6.97023E-02    ( -0.0130626   38.2902 )
------------------------------------------------------------
#Fit statistic : Chi-Squared =          66.85 using 59 PHA bins.
# Reduced chi-squared =          1.215 for     55 degrees of freedom
# Null hypothesis probability =   1.313101e-01

Photon flux (15-150 keV)    in 135.4 sec:  (    ) ph/cm2/s
Energy fluence (15-150 keV)             : 0 ( 0  0 ) ergs/cm2
Single BB
Spectral model blackbody:
------------------------------------------------------------
Parameters  : value    Lower 90%  Upper 90%
kT [keV]    : 5.92517  (-1.0595  1.21324)
R^2/D10^2   : 0.394683  (-0.220991   0.55829)
(R is the radius in km and D10 is the distance to the source in units of 10 kpc)
------------------------------------------------------------
#Fit statistic : Chi-Squared =          67.42 using 59 PHA bins.
# Reduced chi-squared =          1.183 for     57 degrees of freedom
# Null hypothesis probability =   1.626892e-01

Energy  Fluence     90% Error
[keV]   [erg/cm2]   [erg/cm2]
15- 25  2.448e-07   9.216e-08
25- 50  2.375e-07   9.928e-08
50-150  2.065e-08   1.490e-08
15-150  5.029e-07   2.021e-07
Thermal bremsstrahlung (OTTB)
Spectral model: thermal bremsstrahlung
------------------------------------------------------------
Parameters  : value         Lower 90%    Upper 90%
kT [keV]    : 20.0633       (-6.60324      10.7461)
Norm        : 1.21181       (-0.459544     0.840834)
------------------------------------------------------------
#Fit statistic : Chi-Squared =          67.22 using 59 PHA bins.
# Reduced chi-squared =          1.179 for     57 degrees of freedom
# Null hypothesis probability =   1.668378e-01

Energy  Fluence     90% Error
[keV]   [erg/cm2]   [erg/cm2]
15- 25  2.552e-07   7.298e-08
25- 50  2.240e-07   7.869e-08
50-150  6.745e-08   4.710e-08
15-150  5.466e-07   1.979e-07
Double BB
Spectral model: bbodyrad<1> + bbodyrad<2>
------------------------------------------------------------
Parameters  : value         Lower 90%    Upper 90%
kT1 [keV]   : 2.34493        (-2.32736      24.8024)
R1^2/D10^2  : 12.0812        (-13.0532      -13.0532)
kT2 [keV]   : 6.63696        (-1.55335      -6.62118)
R2^2/D10^2  : 0.212783    (-0.217283   0.573245)
------------------------------------------------------------
#Fit statistic : Chi-Squared =          66.44 using 59 PHA bins.
# Reduced chi-squared =          1.208 for     55 degrees of freedom
# Null hypothesis probability =   1.388182e-01

Energy  Fluence     90% Error
[keV]   [erg/cm2]   [erg/cm2]
15- 25  2.479e-07   1.284e-07
25- 50  2.401e-07   1.431e-07
50-150  3.226e-08   2.239e-08
15-150  5.202e-07   2.816e-07
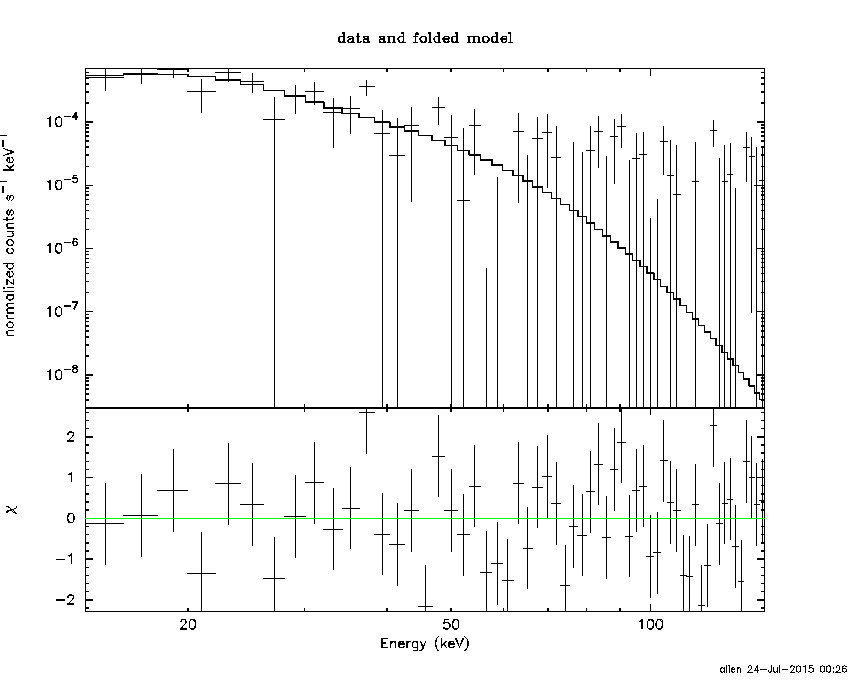
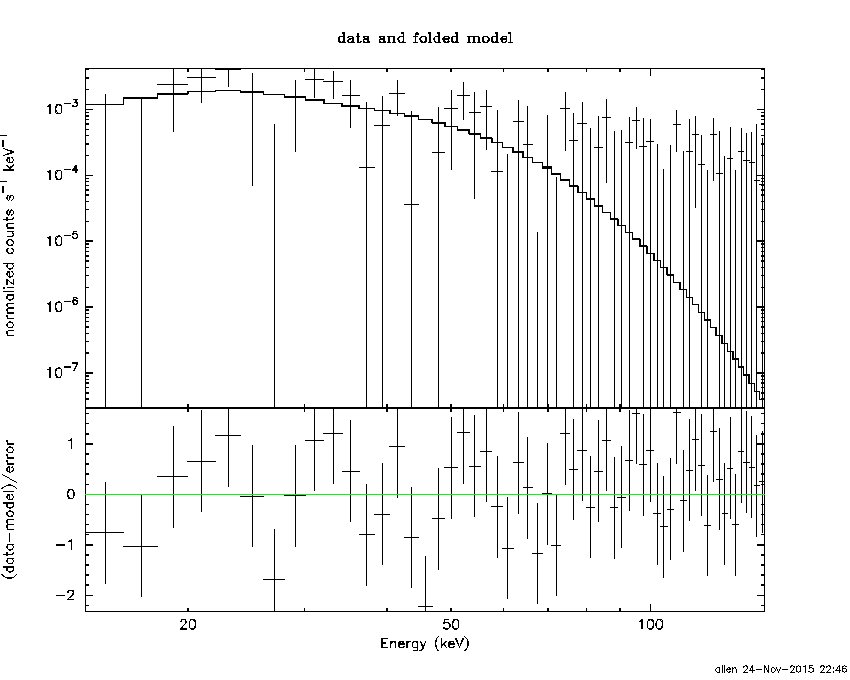
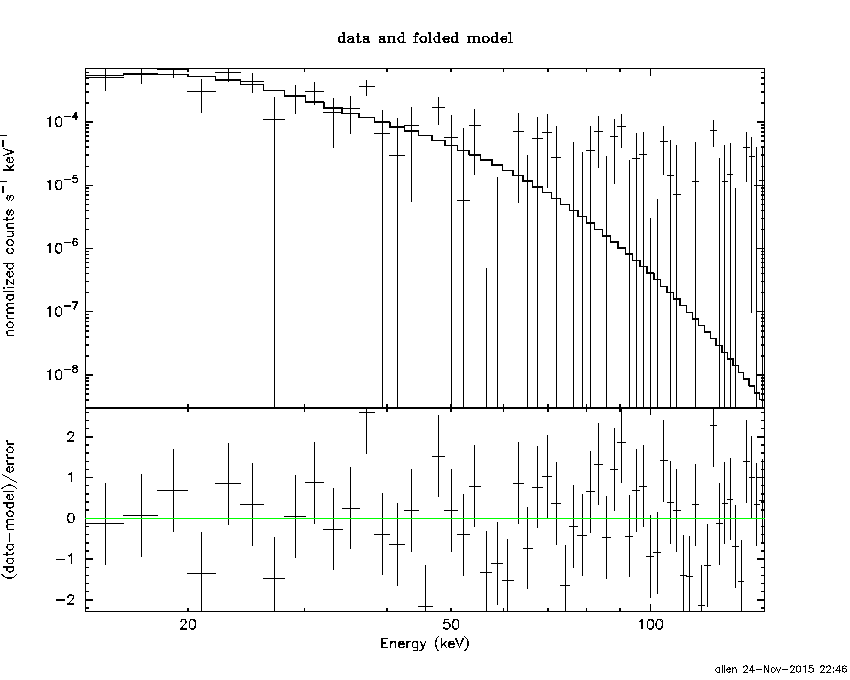
Peak spectrum fit
Power-law model
Time interval is from   49.396 sec. to   50.396 sec.

Spectral model in power-law:
------------------------------------------------------------
Parameters  : value       lower 90%   higher 90%
Photon index: 1.62682     ( -0.705801   0.703711 )
Norm@50keV  : 4.17882E-03    ( -0.00169881   0.00164149 )
------------------------------------------------------------
#Fit statistic : Chi-Squared =          39.65 using 59 PHA bins.
# Reduced chi-squared =         0.6956 for     57 degrees of freedom
# Null hypothesis probability =   9.610825e-01

Photon flux (15-150 keV)    in 1 sec: 0.541554 ( -0.211621  0.213241 ) ph/cm2/s
Energy fluence (15-150 keV)             : 3.89598e-08 ( -1.60744e-08  1.66334e-08 ) ergs/cm2
Cutoff power-law model

Time interval is from   49.396 sec. to   50.396 sec.
Spectral model in the cutoff power-law:
------------------------------------------------------------
Parameters  : value       lower 90%   higher 90%
Photon index: 1.63283     ( -1.40052   0.732258 )
Epeak [keV] : 9999.36      ( -9999.35 -9999.36 )
Norm@50keV  : 4.17384E-03    ( -0.00418143   -0.00418143 )
------------------------------------------------------------
#Fit statistic : Chi-Squared =          39.65 using 59 PHA bins.
# Reduced chi-squared =         0.7080 for     56 degrees of freedom
# Null hypothesis probability =   9.518625e-01

Photon flux (15-150 keV)    in 1 sec: 0.541404 ( -0.210557  0.212753 ) ph/cm2/s
Energy fluence (15-150 keV)             : 3.89733e-08 ( -2.46206e-08  1.64983e-08 ) ergs/cm2
Band function
Time interval is from   49.396 sec. to   50.396 sec.

Spectral model in the Band function:
------------------------------------------------------------
Parameters  : value       lower 90%   higher 90%
alpha       : 4.98772   ( -4.98772   -4.98772 )
beta        : -2.10494    ( -4.16495   0.967178 )
Epeak [keV] : 29.1867      ( -29.1867 55.7433 )
Norm@50keV   : 215.084    ( -78.9167   4.61439e+06 )
------------------------------------------------------------
#Fit statistic : Chi-Squared =          38.28 using 59 PHA bins.
# Reduced chi-squared =         0.6961 for     55 degrees of freedom
# Null hypothesis probability =   9.578689e-01

Photon flux (15-150 keV)    in 1 sec:  (    ) ph/cm2/s
Energy fluence (15-150 keV)             : 0 ( 0  0 ) ergs/cm2
Single BB
Spectral model blackbody:
------------------------------------------------------------
Parameters  : value    Lower 90%  Upper 90%
kT [keV]    : 9.50971  (-3.179  8.04777)
R^2/D10^2   : 0.315283  (-0.315023   1.22273)
(R is the radius in km and D10 is the distance to the source in units of 10 kpc)
------------------------------------------------------------
#Fit statistic : Chi-Squared =          41.07 using 59 PHA bins.
# Reduced chi-squared =         0.7206 for     57 degrees of freedom
# Null hypothesis probability =   9.446212e-01

Energy  Fluence     90% Error
[keV]   [erg/cm2]   [erg/cm2]
15- 25  5.697e-09   3.807e-09
25- 50  1.317e-08   8.675e-09
50-150  5.931e-09   4.404e-09
15-150  2.480e-08   1.627e-08
Thermal bremsstrahlung (OTTB)
Spectral model: thermal bremsstrahlung
------------------------------------------------------------
Parameters  : value         Lower 90%    Upper 90%
kT [keV]    : 156.329       (-120.581      -156.238)
Norm        : 2.23241       (-0.881382     1.80843)
------------------------------------------------------------
#Fit statistic : Chi-Squared =          39.73 using 59 PHA bins.
# Reduced chi-squared =         0.6971 for     57 degrees of freedom
# Null hypothesis probability =   9.602011e-01

Energy  Fluence     90% Error
[keV]   [erg/cm2]   [erg/cm2]
15- 25  5.480e-09   3.506e-09
25- 50  1.046e-08   6.575e-09
50-150  2.247e-08   1.383e-08
15-150  3.842e-08   2.395e-08
Double BB
R1^2/D10^2  : 0.536271        (-0.486568      2.50121)
kT2 [keV]   : 200.000        (-200      -200)
R2^2/D10^2  : 7.09054E-05    (-5.70943e-05   0.000646025)
------------------------------------------------------------
#Fit statistic : Chi-Squared =          37.38 using 59 PHA bins.
#Fit statistic : Chi-Squared =          37.36 using 59 PHA bins.
#Fit statistic : Chi-Squared =          37.32 using 59 PHA bins.
# Reduced chi-squared =         0.6797 for     55 degrees of freedom
# Reduced chi-squared =         0.6793 for     55 degrees of freedom
# Reduced chi-squared =         0.6785 for     55 degrees of freedom
# Null hypothesis probability =   9.668761e-01
# Null hypothesis probability =   9.670734e-01
# Null hypothesis probability =   9.674703e-01

Energy  Fluence     90% Error
[keV]   [erg/cm2]   [erg/cm2]
15- 25  6.543e-09   4.088e-09
25- 50  1.192e-08   7.700e-09
50-150  2.274e-08   1.320e-08
15-150  4.121e-08   2.014e-08
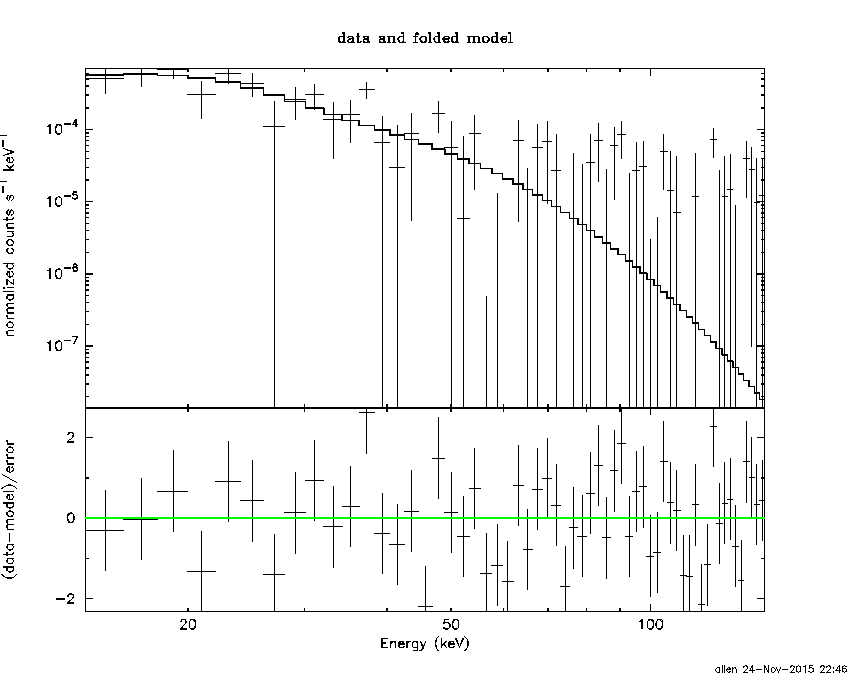
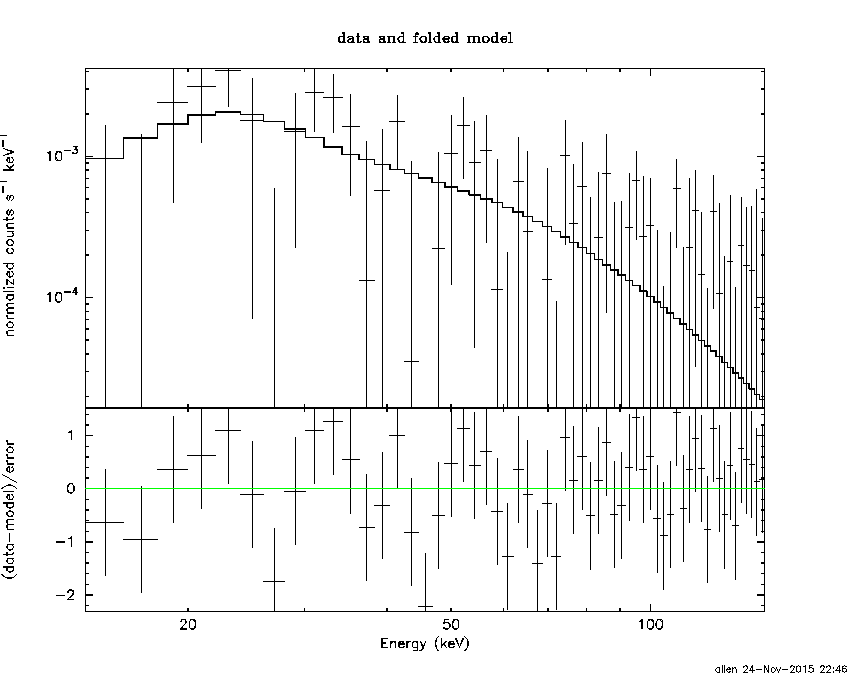
Pre-slew spectrum (Pre-slew PHA with pre-slew DRM)
Power-law model
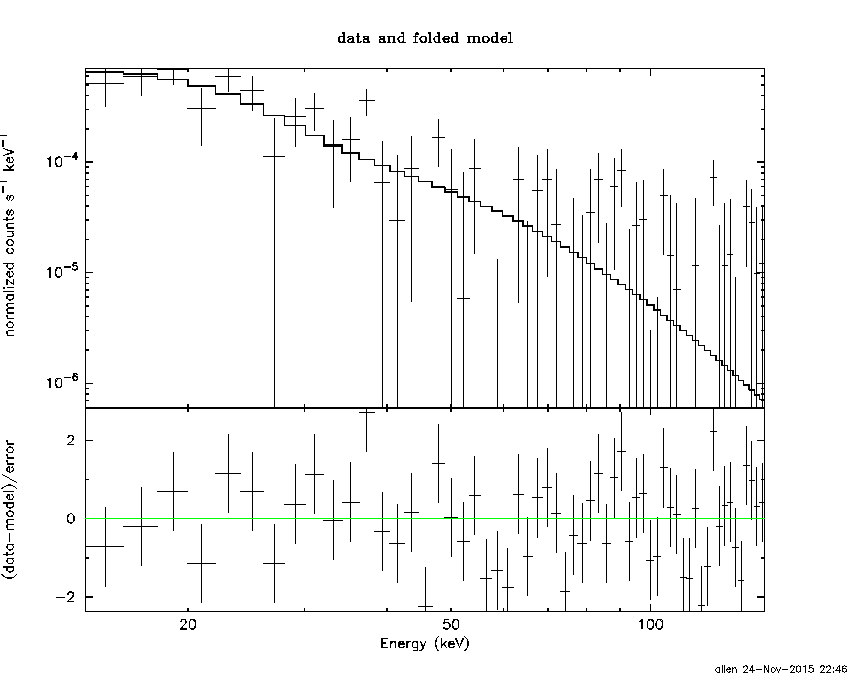
Spectral model in power-law:
------------------------------------------------------------
Parameters  : value       lower 90%   higher 90%
Photon index: 2.87316     ( -0.429281   0.520459 )
Norm@50keV  : 3.95458E-04    ( -0.000151789   0.00016163 )
------------------------------------------------------------
#Fit statistic : Chi-Squared =          69.29 using 59 PHA bins.
# Reduced chi-squared =          1.216 for     57 degrees of freedom
# Null hypothesis probability =   1.273736e-01

Photon flux (15-150 keV)    in 135.4 sec: 9.93289E-02 ( -0.0190967  0.0191269 ) ph/cm2/s
Energy fluence (15-150 keV)             : 6.08607e-07 ( -1.45551e-07  1.57327e-07 ) ergs/cm2
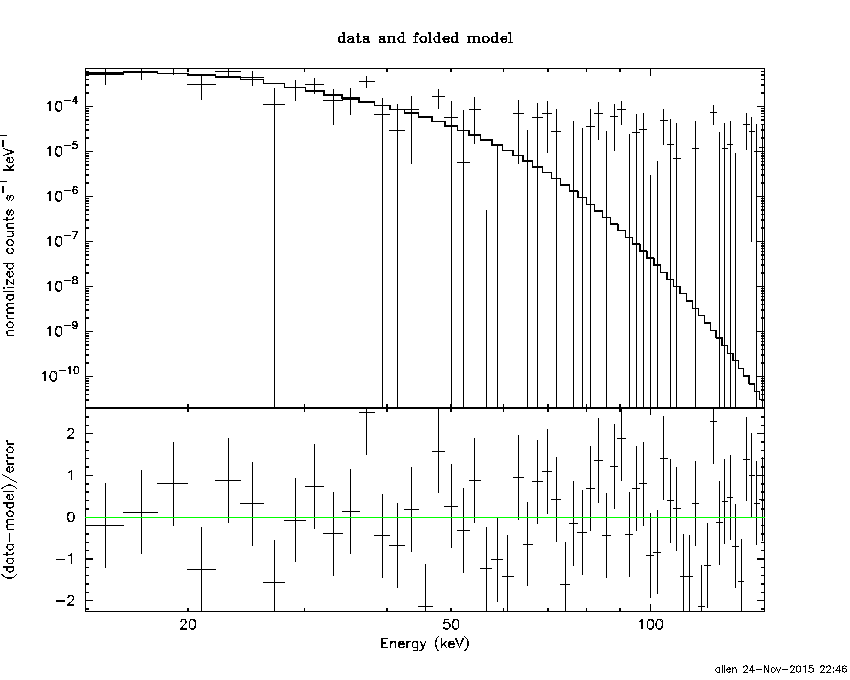
Cutoff power-law model
Spectral model in the cutoff power-law:
------------------------------------------------------------
Parameters  : value       lower 90%   higher 90%
Photon index: 0.771410     (     )
Epeak [keV] : 17.1559      (   )
Norm@50keV  : 1.19179E-02    (     )
------------------------------------------------------------
#Fit statistic : Chi-Squared =          66.93 using 59 PHA bins.
# Reduced chi-squared =          1.195 for     56 degrees of freedom
# Null hypothesis probability =   1.505403e-01

Photon flux (15-150 keV)    in 135.4 sec: 9.63839E-02 ( -0.0093144  0.0187151 ) ph/cm2/s
Energy fluence (15-150 keV)             : 5.25793e-07 ( -1.14756e-07  1.52688e-07 ) ergs/cm2
Band function

Spectral model in the Band function:
------------------------------------------------------------
Parameters  : value       lower 90%   higher 90%
alpha       : 0.304770   ( 1.72899   1.72899 )
beta        : -10.0000    ( 9.99981   19.9977 )
Epeak [keV] : 20.9230      ( -4.62946 7.78411 )
Norm@50keV   : 6.97023E-02    ( -0.0130626   38.2902 )
------------------------------------------------------------
#Fit statistic : Chi-Squared =          66.85 using 59 PHA bins.
# Reduced chi-squared =          1.215 for     55 degrees of freedom
# Null hypothesis probability =   1.313101e-01

Photon flux (15-150 keV)    in 135.4 sec:  (    ) ph/cm2/s
Energy fluence (15-150 keV)             : 0 ( 0  0 ) ergs/cm2
S(25-50 keV) vs. S(50-100 keV) plot
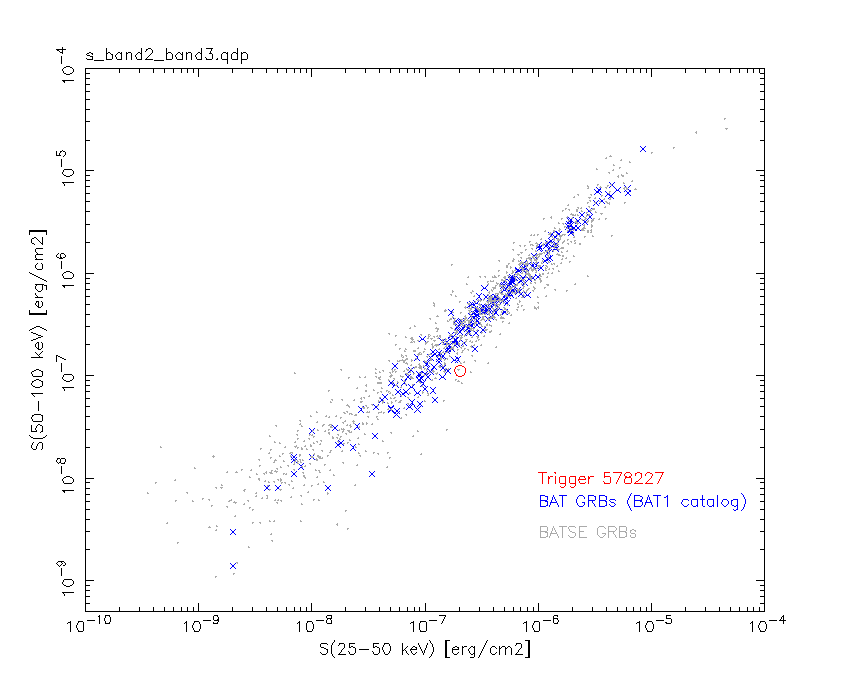
S(25-50 keV)  = 2.04e-07
S(50-100 keV) = 1.12e-07
T90 vs. Hardness ratio plot
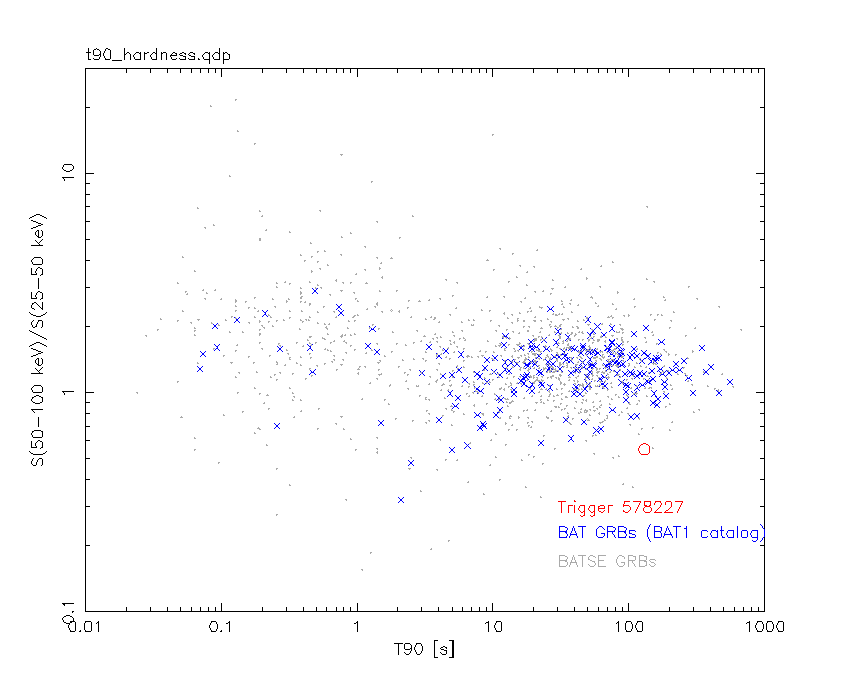
T90                                   = 130.431999981403 sec.
Hardness ratio (energy fluence ratio) = 0.54902
Color vs. Color plot
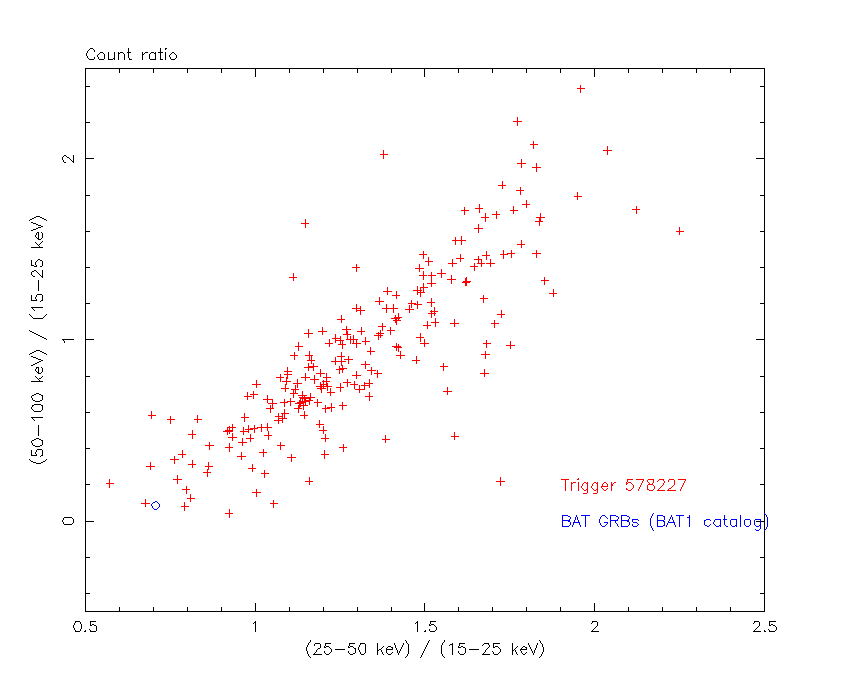
Count Ratio  (25-50 keV) / (15-25 keV) = 0.706564
Count Ratio (50-100 keV) / (15-25 keV) = 0.0861737
Mask shadow pattern
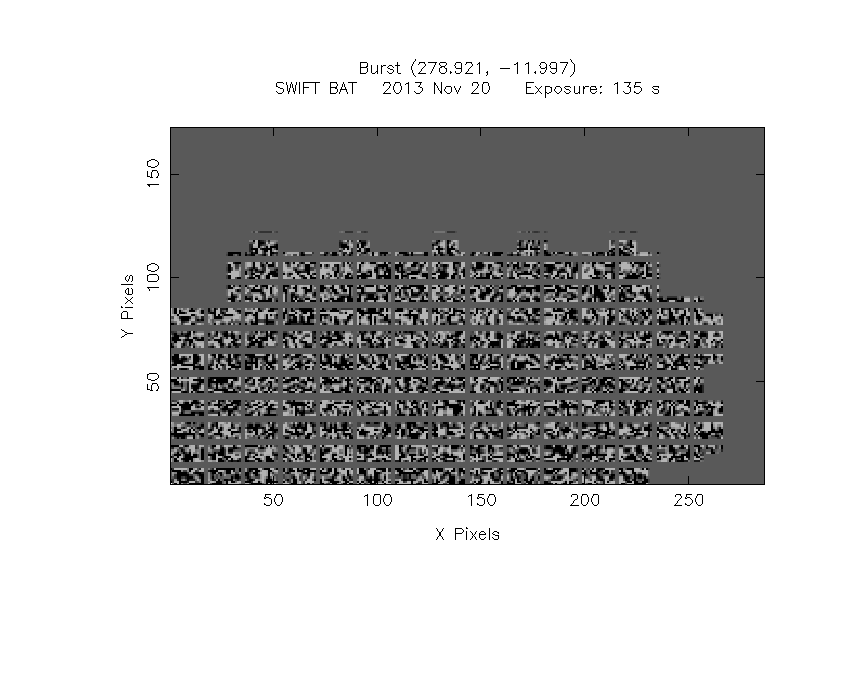
IMX = 0.650030747167, IMY = 0.437727146852
TIME vs. PHA plot around the trigger time
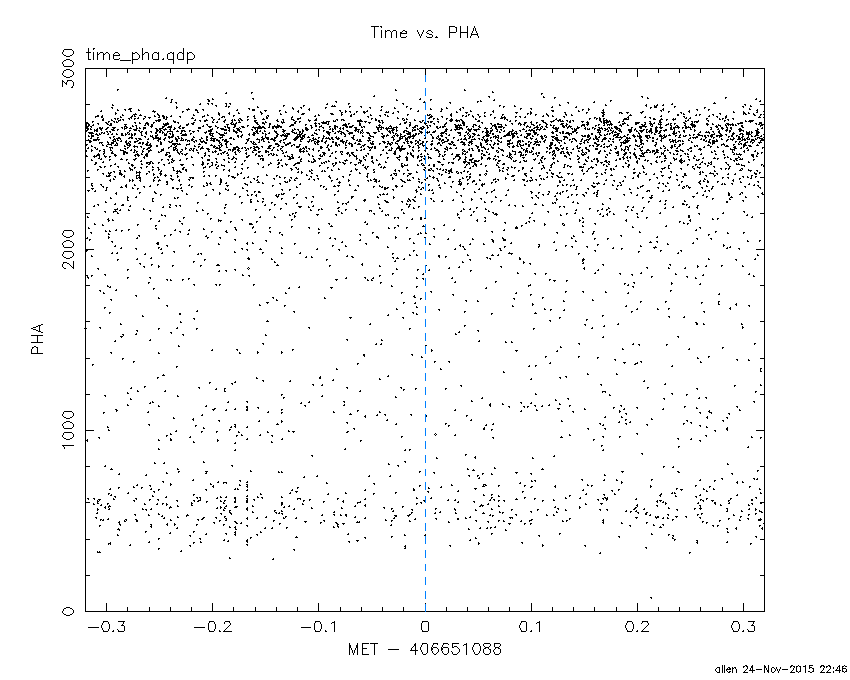
Blue+Cyan dotted lines: Time interval of the scaled map
From 0.000000 to 64.000000
TIME vs. DetID plot around the trigger time
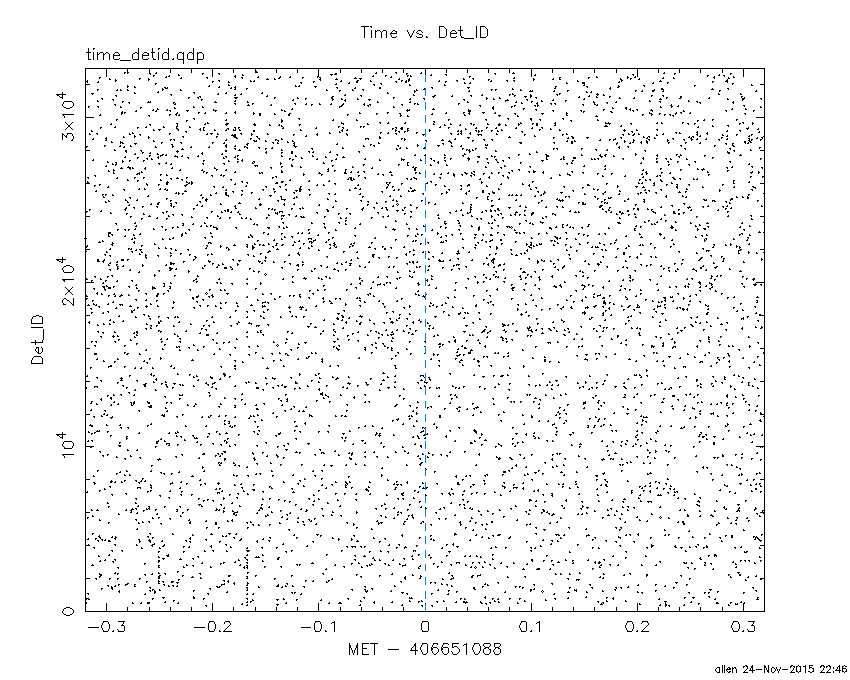
Blue+Cyan dotted lines: Time interval of the scaled map
From 0.000000 to 64.000000
100 us light curve (15-350 keV)
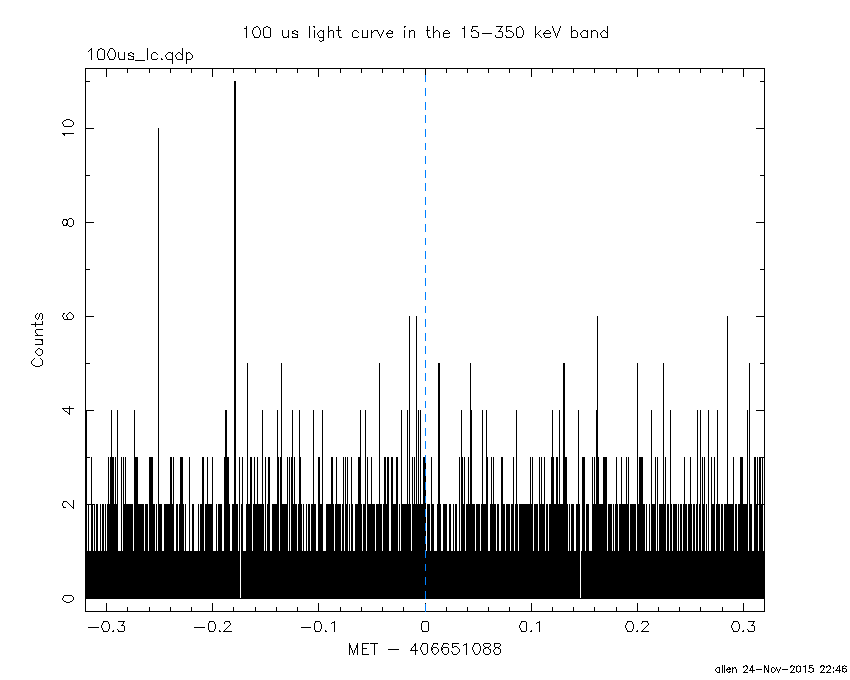
Blue+Cyan dotted lines: Time interval of the scaled map
From 0.000000 to 64.000000
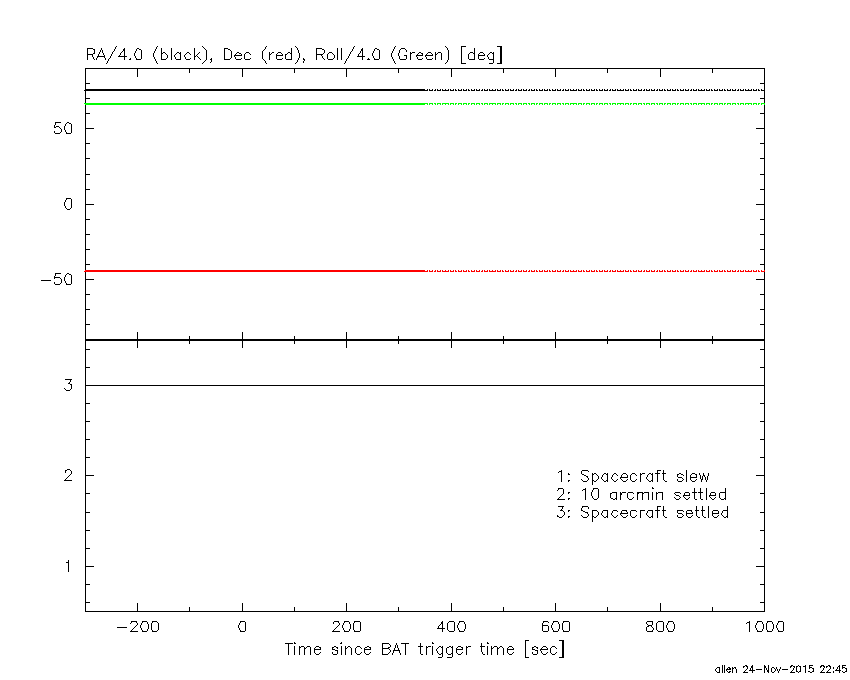
Spacecraft aspect plot
Bright source in the pre-burst/pre-slew/post-slew images
Pre-burst image of 15-350 keV band
Time interval of the image:
-466.799400 -444.850000
-239.000000 -71.096000

# RAcent  DECcent POSerr Theta    Phi  PeakCts   SNR AngSep     Name
#  [deg]    [deg]    ['] [deg]  [deg]                   [']
255.9963 -37.7498   57.9  34.8  -90.6   0.0705   0.2    5.7	4U 1700-377
256.3772 -36.5025    5.8  35.1  -88.5   0.7271   2.0    5.5	GX 349+2
263.0181 -24.6199    5.0  37.3  -66.3   0.7654   2.3    7.6	GX 1+4
264.8677 -44.6346    0.0  26.2  -99.0   0.3323   1.5   12.3	4U 1735-44
268.3373  -1.5834    4.3  52.2  -40.0  -2.1072  -2.7    8.1	SW J1753.5-0127
270.4893 -24.9757    0.0  32.1  -58.5  -0.3048  -1.3   12.8	GX 5-1
270.2967 -25.7671    5.7  31.7  -59.8   0.4692   2.0    1.5	GRS 1758-258
274.0758 -14.0652    3.2  38.6  -42.2   0.9483   3.6    4.4	GX 17+2
275.9392 -30.5105    8.2  24.8  -59.9   0.2776   1.4    8.6	H1820-303
285.0403 -25.0665  174.9  23.8  -36.3  -0.0113  -0.1    8.8	HT1900.1-2455
288.8419  10.9101    4.6  56.7  -11.0   1.7445   2.5    3.3	GRS 1915+105
262.7898 -33.9130    6.1  31.8  -79.7   0.5181   1.9   11.0	GX 354-0
355.0044 -37.1182    2.7  40.1  102.8   3.4425   4.2 ------	UNKNOWN
302.2495   0.6924    2.3  45.2    4.8   1.5590   5.0 ------	UNKNOWN
296.3931   0.9420    2.5  45.8   -3.4   1.4905   4.5 ------	UNKNOWN
122.4424 -82.0720    2.7  53.4 -175.5   2.0882   4.3 ------	UNKNOWN
Pre-slew background subtracted image of 15-350 keV band
Time interval of the image:
-71.096000 64.264000

# RAcent  DECcent POSerr Theta    Phi  PeakCts   SNR AngSep     Name
#  [deg]    [deg]    ['] [deg]  [deg]                   [']
255.9969 -37.8435  975.4  34.8  -90.8  -0.0038  -0.0    0.5	4U 1700-377
256.3351 -36.5203  391.8  35.1  -88.5   0.0098   0.0    7.6	GX 349+2
262.9056 -24.5947    0.0  37.4  -66.4  -0.6858  -2.1   10.7	GX 1+4
264.8677 -44.3889    3.5  26.3  -98.4   0.6821   3.3    6.5	4U 1735-44
268.3004  -1.5371    3.6  52.3  -40.0   2.4759   3.2    6.5	SW J1753.5-0127
270.3805 -24.9720   12.6  32.2  -58.7   0.2187   0.9    8.3	GX 5-1
270.2614 -25.8721    8.7  31.6  -60.0   0.3027   1.3    8.1	GRS 1758-258
273.8945 -14.0714    5.8  38.7  -42.5   0.5300   2.0    6.8	GX 17+2
275.8462 -30.3856    4.4  24.9  -59.8   0.5148   2.6    4.2	H1820-303
285.0096 -24.7735   13.3  24.1  -36.0   0.1423   0.9    8.9	HT1900.1-2455
288.8432  10.9855   39.3  56.8  -11.0  -0.2037  -0.3    3.6	GRS 1915+105
262.8993 -33.8403    5.4  31.8  -79.5  -0.5558  -2.2    4.5	GX 354-0
 35.2890 -71.4105    2.0  49.3  159.6   2.9453   5.8 ------	UNKNOWN
 95.0289 -82.8657    2.2  51.9 -179.6   2.2327   5.3 ------	UNKNOWN
278.9352 -12.0203    1.9  38.1  -34.0   1.4459   6.1 ------	UNKNOWN
Post-slew image of 15-350 keV band
Time interval of the image:
-547.000000 -444.850000
-239.000000 357.760400
361.000000 963.085300

# RAcent  DECcent POSerr Theta    Phi  PeakCts   SNR AngSep     Name
#  [deg]    [deg]    ['] [deg]  [deg]                   [']
255.9252 -37.8221    4.9  34.8  -90.8   3.5493   2.4    3.2	4U 1700-377
256.4009 -36.4932    4.5  35.1  -88.4   4.1494   2.6    4.5	GX 349+2
262.9976 -24.6147    5.8  37.3  -66.4   3.1613   2.0    7.9	GX 1+4
264.8404 -44.5898    4.3  26.2  -98.9   2.4142   2.7    9.4	4U 1735-44
268.2564  -1.5023    6.2  52.4  -40.1   5.5210   1.9    7.3	SW J1753.5-0127
270.2672 -25.0943  123.8  32.2  -59.0   0.0842   0.1    1.3	GX 5-1
270.3025 -25.7434    4.9  31.7  -59.8   2.0560   2.4    0.0	GRS 1758-258
274.0018 -14.0248    2.0  38.7  -42.3   6.3553   5.7    0.7	GX 17+2
275.9366 -30.2857   11.8  25.0  -59.5   0.7785   1.0    4.9	H1820-303
285.2019 -24.8664   41.1  23.9  -35.8  -0.2073  -0.3    9.6	HT1900.1-2455
288.8093  10.9236    3.5  56.8  -11.1  10.0637   3.3    1.5	GRS 1915+105
262.7597 -33.9043    0.0  31.8  -79.7   1.9674   1.7   12.2	GX 354-0
355.0178 -37.0981    4.0  40.1  102.8  11.6530   2.9 ------	UNKNOWN
300.7360  12.1937    4.9  56.8    3.0  10.0266   2.4 ------	UNKNOWN
277.3852 -23.8389    1.8  28.8  -47.7   5.2505   6.5 ------	UNKNOWN
Plot creation:
Tue Nov 24 22:46:59 EST 2015