Special notes of this burst
Image
Pre-slew 15.0-350.0 keV image (Event data)

#   RAcent    DECcent   POSerr    Theta     Phi              Peak Cts       SNR   Name
  355.3053    31.2928   0.0121    33.8017  -117.8780         0.5356779     15.858 TRIG_00579683

Foreground time interval of the image:
 -0.904   2.096 (delta_t =   3.000 [sec])
Background time interval of the image:
-239.904  -0.904 (delta_t = 239.000 [sec])
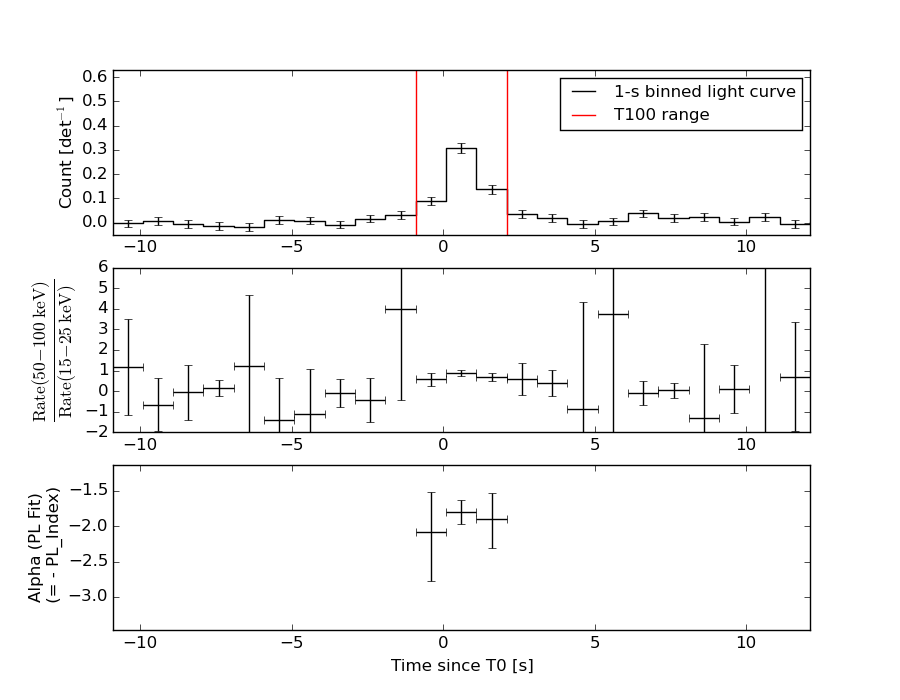
Lightcurves
Notes:
- 1) The mask-weighted light curves are using the flight position.
- 2) Multiple plots of different time binning/intervals are shown to cover all scenarios of short/long GRBs, rate/image triggers, and real/false positives.
- 3) For all the mask-weighted lightcurves, the y-axis units are counts/sec/det where a det is 0.4 x 0.4 = 0.16 sq cm.
- 4) The verticle lines correspond to following: green dotted lines are T50 interval, black dotted lines are T90 interval, blue solid line(s) is a spacecraft slew start time, and orange solid line(s) is a spacecraft slew end time.
- 5) Time of each bin is in the middle of the bin.
1 s binning
From T0-310 s to T0+310 s

From T100_start - 20 s to T100_end + 30 s

Full time interval

64 ms binning
Full time interval
From T100_start to T100_end

From T0-5 sec to T0+5 sec
16 ms binning
From T100_start-5 s to T100_start+5 s

Blue+Cyan dotted lines: Time interval of the scaled map
From 0.000000 to 0.512000
8 ms binning
From T100_start-3 s to T100_start+3 s

Blue+Cyan dotted lines: Time interval of the scaled map
From 0.000000 to 0.512000
2 ms binning
From T100_start-1 s to T100_start+1 s

Blue+Cyan dotted lines: Time interval of the scaled map
From 0.000000 to 0.512000
SN=5 or 10 sec. binning (whichever binning is satisfied first)
SN=5 or 10 sec. binning (T < 200 sec)
Quad-rate summed light curves (from T0-300s to T0+1000s)
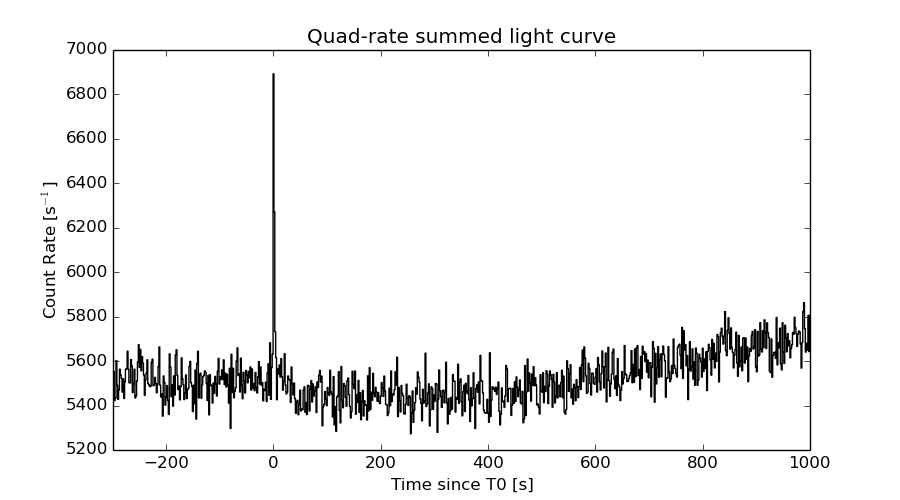
The mask-weighted light curves based on cleaned DPHs

Spectral Evolution
Spectra
Notes:
- 1) The fitting includes the systematic errors.
- 2) When the burst includes telescope slew time periods, the fitting uses an average response file made from multiple 5-s response files through out the slew time plus single time preiod for the non-slew times, and weighted by the total counts in the corresponding time period using addrmf. An average response file is needed becuase a spectral fit using the pre-slew DRM will introduce some errors in both a spectral shape and a normalization if the PHA file contains a lot of the slew/post-slew time interval.
- 3) For fits to more complicated models (e.g. a power-law over a cutoff power-law), the BAT team has decided to require a chi-square improvement of more than 6 for each extra dof.
Time averaged spectrum fit using the average DRM
Power-law model

Time interval is from   -0.904 sec. to    2.096 sec.

Spectral model in power-law:
------------------------------------------------------------
Parameters  : value       lower 90%   higher 90%
Photon index: 1.81095     ( -0.166826   0.173656 )
Norm@50keV  : 1.14938E-02    ( -0.00125974   0.00123933 )
------------------------------------------------------------
#Fit statistic : Chi-Squared =          64.34 using 59 PHA bins.
# Reduced chi-squared =          1.129 for     57 degrees of freedom
# Null hypothesis probability =   2.351738e-01

Photon flux (15-150 keV)    in 3 sec: 1.59060 ( -0.154986  0.155111 ) ph/cm2/s
Energy fluence (15-150 keV)             : 3.17325e-07 ( -3.50472e-08  3.54402e-08 ) ergs/cm2
Cutoff power-law model

Time interval is from   -0.904 sec. to    2.096 sec.
Spectral model in the cutoff power-law:
------------------------------------------------------------
Parameters  : value       lower 90%   higher 90%
Photon index: 1.11179     ( -0.768158   0.657441 )
Epeak [keV] : 60.9053      ( -14.3354 135.934 )
Norm@50keV  : 2.67340E-02    ( -0.0143889   0.0389246 )
------------------------------------------------------------
#Fit statistic : Chi-Squared =          60.99 using 59 PHA bins.
# Reduced chi-squared =          1.089 for     56 degrees of freedom
# Null hypothesis probability =   3.011038e-01

Photon flux (15-150 keV)    in 3 sec: 1.54786 ( -0.16089  0.16021 ) ph/cm2/s
Energy fluence (15-150 keV)             : 3.04317e-07 ( -3.65082e-08  3.7353e-08 ) ergs/cm2
Band function

Time interval is from   -0.904 sec. to    2.096 sec.

Spectral model in the Band function:
------------------------------------------------------------
Parameters  : value       lower 90%   higher 90%
alpha       : -1.11324   ( -0.731219   0.696961 )
beta        : -10.0000    ( 10   3.55271e-15 )
Epeak [keV] : 61.0095      ( -14.4458 107.678 )
Norm@50keV   : 2.66612E-02    ( -0.0143185   0.0391211 )
------------------------------------------------------------
#Fit statistic : Chi-Squared =          61.00 using 59 PHA bins.
# Reduced chi-squared =          1.109 for     55 degrees of freedom
# Null hypothesis probability =   2.692255e-01

Photon flux (15-150 keV)    in 3 sec: 1.56805 ( 5.43195  -0.17934 ) ph/cm2/s
Energy fluence (15-150 keV)             : 3.03777e-07 ( -3.03756e-07  -3.5739e-08 ) ergs/cm2
Single BB

Spectral model blackbody:
------------------------------------------------------------
Parameters  : value    Lower 90%  Upper 90%
kT [keV]    : 13.2399  (-1.43398  1.58436)
R^2/D10^2   : 0.270328  (-0.0918985   0.140661)
(R is the radius in km and D10 is the distance to the source in units of 10 kpc)
------------------------------------------------------------
#Fit statistic : Chi-Squared =          81.60 using 59 PHA bins.
# Reduced chi-squared =          1.431 for     57 degrees of freedom
# Null hypothesis probability =   1.798756e-02

Energy  Fluence     90% Error
[keV]   [erg/cm2]   [erg/cm2]
15- 25  3.014e-08   5.394e-09
25- 50  1.058e-07   1.266e-08
50-150  1.185e-07   2.556e-08
15-150  2.545e-07   3.171e-08
Thermal bremsstrahlung (OTTB)

Spectral model: thermal bremsstrahlung
------------------------------------------------------------
Parameters  : value         Lower 90%    Upper 90%
kT [keV]    : 108.028       (-32.7642      49.636)
Norm        : 6.80904       (-0.827803     1.1076)
------------------------------------------------------------
#Fit statistic : Chi-Squared =          61.45 using 59 PHA bins.
# Reduced chi-squared =          1.078 for     57 degrees of freedom
# Null hypothesis probability =   3.198434e-01

Energy  Fluence     90% Error
[keV]   [erg/cm2]   [erg/cm2]
15- 25  5.336e-08   7.635e-09
25- 50  9.367e-08   1.102e-08
50-150  1.584e-07   6.631e-08
15-150  3.054e-07   6.802e-08
Double BB

Spectral model: bbodyrad<1> + bbodyrad<2>
------------------------------------------------------------
Parameters  : value         Lower 90%    Upper 90%
kT1 [keV]   : 3.83013        (-0.937084      1.20405)
R1^2/D10^2  : 18.7231        (-13.3759      61.3006)
kT2 [keV]   : 16.8004        (-2.20567      2.81302)
R2^2/D10^2  : 9.89405E-02    (-0.0448667   0.0712766)
------------------------------------------------------------
#Fit statistic : Chi-Squared =          54.02 using 59 PHA bins.
# Reduced chi-squared =         0.9822 for     55 degrees of freedom
# Null hypothesis probability =   5.119877e-01

Energy  Fluence     90% Error
[keV]   [erg/cm2]   [erg/cm2]
15- 25  5.835e-08   2.669e-08
25- 50  8.815e-08   2.356e-08
50-150  1.507e-07   4.623e-08
15-150  2.972e-07   7.610e-08
Peak spectrum fit
Power-law model

Time interval is from    0.096 sec. to    1.096 sec.

Spectral model in power-law:
------------------------------------------------------------
Parameters  : value       lower 90%   higher 90%
Photon index: 1.80053     ( -0.166993   0.174542 )
Norm@50keV  : 1.95373E-02    ( -0.00231169   0.00228194 )
------------------------------------------------------------
#Fit statistic : Chi-Squared =          63.45 using 59 PHA bins.
# Reduced chi-squared =          1.113 for     57 degrees of freedom
# Null hypothesis probability =   2.597171e-01

Photon flux (15-150 keV)    in 1 sec: 2.69275 ( -0.289136  0.289345 ) ph/cm2/s
Energy fluence (15-150 keV)             : 1.79858e-07 ( -2.15e-08  2.16928e-08 ) ergs/cm2
Cutoff power-law model

Time interval is from    0.096 sec. to    1.096 sec.
Spectral model in the cutoff power-law:
------------------------------------------------------------
Parameters  : value       lower 90%   higher 90%
Photon index: 0.146469     ( -1.06384   0.86431 )
Epeak [keV] : 54.3873      ( -7.38308 11.6237 )
Norm@50keV  : 0.140946    ( -0.0894009   0.335658 )
------------------------------------------------------------
#Fit statistic : Chi-Squared =          51.08 using 59 PHA bins.
# Reduced chi-squared =         0.9122 for     56 degrees of freedom
# Null hypothesis probability =   6.610477e-01

Photon flux (15-150 keV)    in 1 sec: 2.57709 ( -0.29364  0.29759 ) ph/cm2/s
Energy fluence (15-150 keV)             : 1.69483e-07 ( -2.1117e-08  2.1845e-08 ) ergs/cm2
Band function

Time interval is from    0.096 sec. to    1.096 sec.

Spectral model in the Band function:
------------------------------------------------------------
Parameters  : value       lower 90%   higher 90%
alpha       : -0.147376   ( -0.645361   1.38365 )
beta        : -10.0000    ( 10   3.55271e-15 )
Epeak [keV] : 54.3703      ( -7.37547 11.6223 )
Norm@50keV   : 0.140855    ( -0.0893211   0.336176 )
------------------------------------------------------------
#Fit statistic : Chi-Squared =          51.09 using 59 PHA bins.
# Reduced chi-squared =         0.9288 for     55 degrees of freedom
# Null hypothesis probability =   6.249542e-01

Photon flux (15-150 keV)    in 1 sec: 2.58035 ( 4.41965  -0.29619 ) ph/cm2/s
Energy fluence (15-150 keV)             : 0 ( 0  0 ) ergs/cm2
Single BB

Spectral model blackbody:
------------------------------------------------------------
Parameters  : value    Lower 90%  Upper 90%
kT [keV]    : 13.3640  (-1.29454  1.41279)
R^2/D10^2   : 0.478237  (-0.149627   0.216236)
(R is the radius in km and D10 is the distance to the source in units of 10 kpc)
------------------------------------------------------------
#Fit statistic : Chi-Squared =          56.26 using 59 PHA bins.
# Reduced chi-squared =         0.9870 for     57 degrees of freedom
# Null hypothesis probability =   5.028786e-01

Energy  Fluence     90% Error
[keV]   [erg/cm2]   [erg/cm2]
15- 25  1.810e-08   3.210e-09
25- 50  6.420e-08   8.400e-09
50-150  7.364e-08   1.551e-08
15-150  1.559e-07   1.860e-08
Thermal bremsstrahlung (OTTB)

Spectral model: thermal bremsstrahlung
------------------------------------------------------------
Parameters  : value         Lower 90%    Upper 90%
kT [keV]    : 98.7685       (-27.127      47.0079)
Norm        : 12.2016       (-1.62748     1.86469)
------------------------------------------------------------
#Fit statistic : Chi-Squared =          56.24 using 59 PHA bins.
# Reduced chi-squared =         0.9868 for     57 degrees of freedom
# Null hypothesis probability =   5.033792e-01

Energy  Fluence     90% Error
[keV]   [erg/cm2]   [erg/cm2]
15- 25  3.189e-08   5.100e-09
25- 50  5.501e-08   6.990e-09
50-150  8.851e-08   3.375e-08
15-150  1.754e-07   3.815e-08
Double BB

Spectral model: bbodyrad<1> + bbodyrad<2>
------------------------------------------------------------
Parameters  : value         Lower 90%    Upper 90%
kT1 [keV]   : 3.19341        (-1.1291      1.55621)
R1^2/D10^2  : 56.2707        (-49.3565      852.721)
kT2 [keV]   : 14.9413        (-1.6601      2.02149)
R2^2/D10^2  : 0.291748    (-0.117284   0.161056)
------------------------------------------------------------
#Fit statistic : Chi-Squared =          44.19 using 59 PHA bins.
# Reduced chi-squared =         0.8034 for     55 degrees of freedom
# Null hypothesis probability =   8.514409e-01

Energy  Fluence     90% Error
[keV]   [erg/cm2]   [erg/cm2]
15- 25  2.899e-08   1.120e-08
25- 50  5.679e-08   1.294e-08
50-150  8.194e-08   2.108e-08
15-150  1.677e-07   3.300e-08
Pre-slew spectrum (Pre-slew PHA with pre-slew DRM)
Power-law model

Spectral model in power-law:
------------------------------------------------------------
Parameters  : value       lower 90%   higher 90%
Photon index: 1.81095     ( -0.166826   0.173656 )
Norm@50keV  : 1.14938E-02    ( -0.00125974   0.00123933 )
------------------------------------------------------------
#Fit statistic : Chi-Squared =          64.34 using 59 PHA bins.
# Reduced chi-squared =          1.129 for     57 degrees of freedom
# Null hypothesis probability =   2.351738e-01

Photon flux (15-150 keV)    in 3 sec: 1.59060 ( -0.154986  0.155111 ) ph/cm2/s
Energy fluence (15-150 keV)             : 3.17325e-07 ( -3.50472e-08  3.54402e-08 ) ergs/cm2
Cutoff power-law model

Spectral model in the cutoff power-law:
------------------------------------------------------------
Parameters  : value       lower 90%   higher 90%
Photon index: 1.11179     ( -0.768158   0.657441 )
Epeak [keV] : 60.9053      ( -14.3354 135.934 )
Norm@50keV  : 2.67340E-02    ( -0.0143889   0.0389246 )
------------------------------------------------------------
#Fit statistic : Chi-Squared =          60.99 using 59 PHA bins.
# Reduced chi-squared =          1.089 for     56 degrees of freedom
# Null hypothesis probability =   3.011038e-01

Photon flux (15-150 keV)    in 3 sec: 1.54786 ( -0.16089  0.16021 ) ph/cm2/s
Energy fluence (15-150 keV)             : 3.04317e-07 ( -3.65082e-08  3.7353e-08 ) ergs/cm2
Band function

Spectral model in the Band function:
------------------------------------------------------------
Parameters  : value       lower 90%   higher 90%
alpha       : -1.11324   ( -0.731229   0.696961 )
beta        : -10.0000    ( 10   1.77636e-15 )
Epeak [keV] : 61.0095      ( -14.4458 107.678 )
Norm@50keV   : 2.66612E-02    ( -0.0143185   0.0391211 )
------------------------------------------------------------
#Fit statistic : Chi-Squared =          61.00 using 59 PHA bins.
# Reduced chi-squared =          1.109 for     55 degrees of freedom
# Null hypothesis probability =   2.692255e-01

Photon flux (15-150 keV)    in 3 sec: 1.56805 ( 5.43195  -0.17934 ) ph/cm2/s
Energy fluence (15-150 keV)             : 3.03777e-07 ( -3.03756e-07  -3.5739e-08 ) ergs/cm2
S(25-50 keV) vs. S(50-100 keV) plot
S(25-50 keV)  = 8.97e-08
S(50-100 keV) = 1.02e-07
T90 vs. Hardness ratio plot

T90                                   = 3 sec.
Hardness ratio (energy fluence ratio) = 1.13712
Color vs. Color plot
Count Ratio  (25-50 keV) / (15-25 keV) = 1.0357
Count Ratio (50-100 keV) / (15-25 keV) = 0.77326
Mask shadow pattern

IMX = -3.130452807927193E-01, IMY = 5.917884229788045E-01
TIME vs. PHA plot around the trigger time

Blue+Cyan dotted lines: Time interval of the scaled map
From 0.000000 to 0.512000
TIME vs. DetID plot around the trigger time

Blue+Cyan dotted lines: Time interval of the scaled map
From 0.000000 to 0.512000
100 us light curve (15-350 keV)

Blue+Cyan dotted lines: Time interval of the scaled map
From 0.000000 to 0.512000
Spacecraft aspect plot

Bright source in the pre-burst/pre-slew/post-slew images
Pre-burst image of 15-350 keV band
Time interval of the image:
-239.904000 -0.904000

# RAcent  DECcent POSerr Theta    Phi  PeakCts   SNR AngSep     Name
#  [deg]    [deg]    ['] [deg]  [deg]                   [']
 20.5598  -2.4743    2.8  38.4  168.7   1.1820   4.0 ------	UNKNOWN
Pre-slew background subtracted image of 15-350 keV band
Time interval of the image:
-0.904000 2.096000

# RAcent  DECcent POSerr Theta    Phi  PeakCts   SNR AngSep     Name
#  [deg]    [deg]    ['] [deg]  [deg]                   [']
 51.5257  14.8077    2.1  23.5  102.1   0.1342   5.4 ------	UNKNOWN
 50.0379  20.4834    2.4  18.2   95.2   0.1017   4.8 ------	UNKNOWN
355.3053  31.2928    0.7  33.8 -117.9   0.5357  15.9 ------	UNKNOWN
Post-slew image of 15-350 keV band
Time interval of the image:
70.596590 962.130200

# RAcent  DECcent POSerr Theta    Phi  PeakCts   SNR AngSep     Name
#  [deg]    [deg]    ['] [deg]  [deg]                   [']
308.1376  40.9552    1.1  38.8  -52.7  10.2615  10.8    1.3	Cyg X-3
326.1448  38.4101   12.1  24.9  -55.9   0.5748   1.0    5.5	Cyg X-2
 33.3947  64.8508    3.3  40.9   33.0   3.2974   3.5 ------	UNKNOWN
317.8438  82.2054    2.7  52.7    3.4   5.7863   4.3 ------	UNKNOWN
345.0193  52.8183    3.0  22.8   -6.8   1.8147   3.8 ------	UNKNOWN
336.4192  64.2598    3.5  35.0   -4.8   2.1399   3.3 ------	UNKNOWN
351.0033 -27.6010    3.0  59.0 -166.1  12.8080   3.8 ------	UNKNOWN
315.2156  12.9315    4.0  41.1  -97.9   8.2562   2.9 ------	UNKNOWN
321.2466   1.0530    3.6  44.2 -117.1   6.9745   3.2 ------	UNKNOWN
Plot creation:
Sat May 30 15:01:34 EDT 2015