Click here for the BAT GCN circular template
Image
Pre-slew 15.0-350.0 keV image (Event data)
#   RAcent    DECcent   POSerr    Theta     Phi              Peak Cts       SNR   Name
  301.3101   -64.9429   0.0029    25.6622   -92.3264         6.2985194     65.779 TRIG_00582123

Foreground time interval of the image:
 -0.256   8.704 (delta_t =   8.960 [sec])
Background time interval of the image:
-239.104  -0.256 (delta_t = 238.848 [sec])
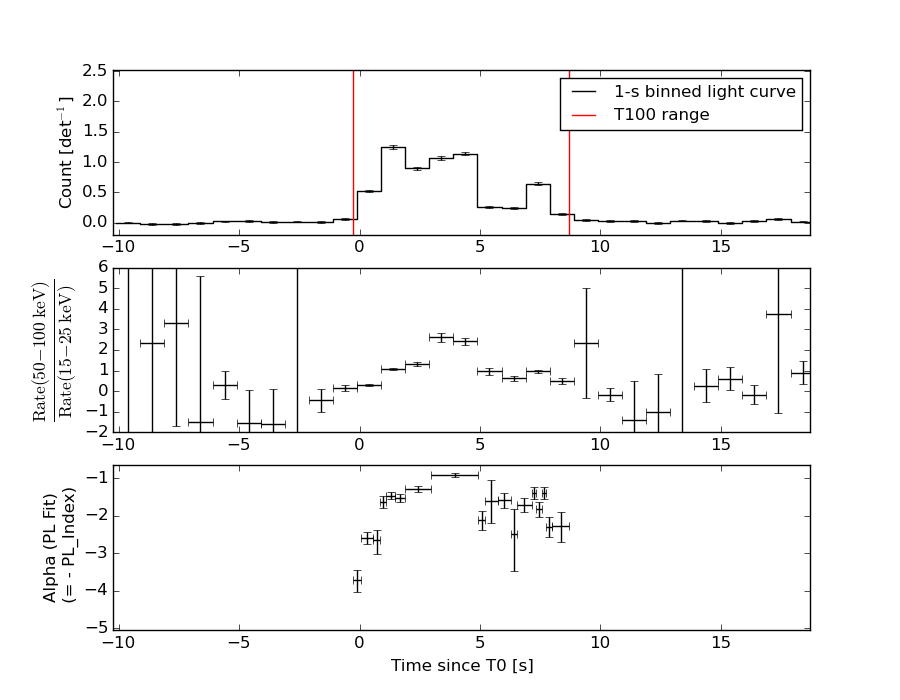
Lightcurves
Notes:
- 1) The mask-weighted light curves are using the flight position.
- 2) Multiple plots of different time binning/intervals are shown to cover all scenarios of short/long GRBs, rate/image triggers, and real/false positives.
- 3) For all the mask-weighted lightcurves, the y-axis units are counts/sec/det where a det is 0.4 x 0.4 = 0.16 sq cm.
- 4) The verticle lines correspond to following: green dotted lines are T50 interval, black dotted lines are T90 interval, blue solid line(s) is a spacecraft slew start time, and orange solid line(s) is a spacecraft slew end time.
- 5) Time of each bin is in the middle of the bin.
1 s binning
From T0-310 s to T0+310 s
From T100_start - 20 s to T100_end + 30 s
Full time interval

64 ms binning
Full time interval
From T100_start to T100_end
From T0-5 sec to T0+5 sec
16 ms binning
From T100_start-5 s to T100_start+5 s
Blue+Cyan dotted lines: Time interval of the scaled map
From 0.000000 to 0.256000
8 ms binning
From T100_start-3 s to T100_start+3 s
Blue+Cyan dotted lines: Time interval of the scaled map
From 0.000000 to 0.256000
2 ms binning
From T100_start-1 s to T100_start+1 s
Blue+Cyan dotted lines: Time interval of the scaled map
From 0.000000 to 0.256000
SN=5 or 10 sec. binning (whichever binning is satisfied first)
SN=5 or 10 sec. binning (T < 200 sec)
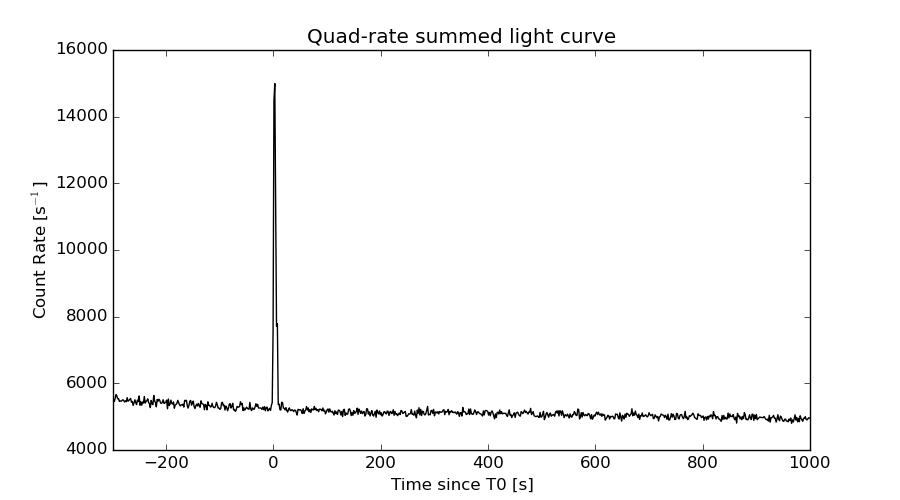
Quad-rate summed light curves (from T0-300s to T0+1000s)
Spectral Evolution
Spectra
Notes:
- 1) The fitting includes the systematic errors.
- 2) When the burst includes telescope slew time periods, the fitting uses an average response file made from multiple 5-s response files through out the slew time plus single time preiod for the non-slew times, and weighted by the total counts in the corresponding time period using addrmf. An average response file is needed becuase a spectral fit using the pre-slew DRM will introduce some errors in both a spectral shape and a normalization if the PHA file contains a lot of the slew/post-slew time interval.
- 3) For fits to more complicated models (e.g. a power-law over a cutoff power-law), the BAT team has decided to require a chi-square improvement of more than 6 for each extra dof.
Time averaged spectrum fit using the average DRM
Power-law model
Time interval is from   -0.256 sec. to    8.704 sec.

Spectral model in power-law:
------------------------------------------------------------
Parameters  : value       lower 90%   higher 90%
Photon index: 1.38047     ( -0.0415988   0.041581 )
Norm@50keV  : 4.61936E-02    ( -0.00100214   0.00100182 )
------------------------------------------------------------
#Fit statistic : Chi-Squared =          55.08 using 59 PHA bins.
# Reduced chi-squared =         0.9664 for     57 degrees of freedom
# Null hypothesis probability =   5.473267e-01

Photon flux (15-150 keV)    in 8.96 sec: 5.60110 ( -0.13581  0.136389 ) ph/cm2/s
Energy fluence (15-150 keV)             : 4.01562e-06 ( -9.08947e-08  9.10139e-08 ) ergs/cm2
Cutoff power-law model
Time interval is from   -0.256 sec. to    8.704 sec.
Spectral model in the cutoff power-law:
------------------------------------------------------------
Parameters  : value       lower 90%   higher 90%
Photon index: 1.33359     ( -0.163868   0.0637818 )
Epeak [keV] : 796.831      ( -845.214 -845.214 )
Norm@50keV  : 4.84060E-02    ( -0.00448483   0.00831185 )
------------------------------------------------------------
#Fit statistic : Chi-Squared =          54.87 using 59 PHA bins.
# Reduced chi-squared =         0.9799 for     56 degrees of freedom
# Null hypothesis probability =   5.176101e-01

Photon flux (15-150 keV)    in 8.96 sec: 5.58378 ( -0.12688  0.14567 ) ph/cm2/s
Energy fluence (15-150 keV)             : 4.00486e-06 ( -9.50298e-08  9.96531e-08 ) ergs/cm2
Band function

Time interval is from   -0.256 sec. to    8.704 sec.

Spectral model in the Band function:
------------------------------------------------------------
Parameters  : value       lower 90%   higher 90%
alpha       : -0.652590   ( 0.916265   5.91204 )
beta        : -1.38821    ( 1.38731   0.0451039 )
Epeak [keV] : 48.7359      ( -48.8106 324.431 )
Norm@50keV   : 0.153703    ( -0.15482   2.81975e+06 )
------------------------------------------------------------
#Fit statistic : Chi-Squared =          54.59 using 59 PHA bins.
# Reduced chi-squared =         0.9925 for     55 degrees of freedom
# Null hypothesis probability =   4.904107e-01

Photon flux (15-150 keV)    in 8.96 sec:  (    ) ph/cm2/s
Energy fluence (15-150 keV)             : 0 ( 0  0 ) ergs/cm2
Single BB
Spectral model blackbody:
------------------------------------------------------------
Parameters  : value    Lower 90%  Upper 90%
kT [keV]    : 18.8439  (  )
R^2/D10^2   : 0.288737  (   )
(R is the radius in km and D10 is the distance to the source in units of 10 kpc)
------------------------------------------------------------
#Fit statistic : Chi-Squared =         509.01 using 59 PHA bins.
# Reduced chi-squared =         8.9300 for     57 degrees of freedom
# Null hypothesis probability =   8.270924e-74

Energy  Fluence     90% Error
[keV]   [erg/cm2]   [erg/cm2]
15- 25  1.811e-07   7.974e-09
25- 50  8.660e-07   2.522e-08
50-150  2.256e-06   8.557e-08
15-150  3.303e-06   7.974e-08
Thermal bremsstrahlung (OTTB)
Spectral model: thermal bremsstrahlung
------------------------------------------------------------
Parameters  : value         Lower 90%    Upper 90%
kT [keV]    : 199.363       (      )
Norm        : 23.5352       (     )
------------------------------------------------------------
#Fit statistic : Chi-Squared =         133.53 using 59 PHA bins.
# Reduced chi-squared =         2.3427 for     57 degrees of freedom
# Null hypothesis probability =   4.404433e-08

Energy  Fluence     90% Error
[keV]   [erg/cm2]   [erg/cm2]
15- 25  5.251e-07   1.308e-08
25- 50  1.010e-06   2.464e-08
50-150  2.215e-06   5.242e-08
15-150  3.751e-06   9.318e-08
Double BB
Spectral model: bbodyrad<1> + bbodyrad<2>
------------------------------------------------------------
Parameters  : value         Lower 90%    Upper 90%
kT1 [keV]   : 7.66239        (-0.662825      0.713265)
R1^2/D10^2  : 3.87862        (-1.00839      1.46787)
kT2 [keV]   : 31.0216        (-2.34544      2.94943)
R2^2/D10^2  : 4.50491E-02    (-0.0119343   0.014162)
------------------------------------------------------------
#Fit statistic : Chi-Squared =          64.28 using 59 PHA bins.
# Reduced chi-squared =          1.169 for     55 degrees of freedom
# Null hypothesis probability =   1.834918e-01

Energy  Fluence     90% Error
[keV]   [erg/cm2]   [erg/cm2]
15- 25  4.162e-07   3.750e-08
25- 50  9.505e-07   4.269e-08
50-150  2.626e-06   1.304e-07
15-150  3.993e-06   1.416e-07
Peak spectrum fit
Power-law model
Time interval is from    1.108 sec. to    2.108 sec.

Spectral model in power-law:
------------------------------------------------------------
Parameters  : value       lower 90%   higher 90%
Photon index: 1.48732     ( -0.0704796   0.0709083 )
Norm@50keV  : 8.33346E-02    ( -0.0032392   0.00323221 )
------------------------------------------------------------
#Fit statistic : Chi-Squared =          46.98 using 59 PHA bins.
# Reduced chi-squared =         0.8242 for     57 degrees of freedom
# Null hypothesis probability =   8.254309e-01

Photon flux (15-150 keV)    in 1 sec: 10.3684 ( -0.41326  0.413884 ) ph/cm2/s
Energy fluence (15-150 keV)             : 7.92218e-07 ( -3.36995e-08  3.38141e-08 ) ergs/cm2
Cutoff power-law model
Time interval is from    1.108 sec. to    2.108 sec.
Spectral model in the cutoff power-law:
------------------------------------------------------------
Parameters  : value       lower 90%   higher 90%
Photon index: 1.37114     ( -0.274832   0.152544 )
Epeak [keV] : 286.686      ( -286.686 -286.686 )
Norm@50keV  : 9.47418E-02    ( -0.0140299   0.0325623 )
------------------------------------------------------------
#Fit statistic : Chi-Squared =          46.41 using 59 PHA bins.
# Reduced chi-squared =         0.8288 for     56 degrees of freedom
# Null hypothesis probability =   8.158578e-01

Photon flux (15-150 keV)    in 1 sec: 10.2972 ( -0.44044  0.4174 ) ph/cm2/s
Energy fluence (15-150 keV)             : 7.86416e-07 ( -3.6679e-08  3.2522e-08 ) ergs/cm2
Band function

Time interval is from    1.108 sec. to    2.108 sec.

Spectral model in the Band function:
------------------------------------------------------------
Parameters  : value       lower 90%   higher 90%
alpha       : -1.17349   ( 1.12798   1.12798 )
beta        : -1.55071    ( 1.55132   0.12327 )
Epeak [keV] : 108.635      ( -100.467 -100.467 )
Norm@50keV   : 0.124676    ( -0.040989   0 )
------------------------------------------------------------
#Fit statistic : Chi-Squared =          46.16 using 59 PHA bins.
# Reduced chi-squared =         0.8393 for     55 degrees of freedom
# Null hypothesis probability =   7.961845e-01

Photon flux (15-150 keV)    in 1 sec:  (    ) ph/cm2/s
Energy fluence (15-150 keV)             : 0 ( 0  0 ) ergs/cm2
Single BB

Spectral model blackbody:
------------------------------------------------------------
Parameters  : value    Lower 90%  Upper 90%
kT [keV]    : 15.6913  (  )
R^2/D10^2   : 0.985042  (   )
(R is the radius in km and D10 is the distance to the source in units of 10 kpc)
------------------------------------------------------------
#Fit statistic : Chi-Squared =         208.05 using 59 PHA bins.
# Reduced chi-squared =         3.6500 for     57 degrees of freedom
# Null hypothesis probability =   4.644421e-19

Energy  Fluence     90% Error
[keV]   [erg/cm2]   [erg/cm2]
15- 25  5.036e-08   3.665e-09
25- 50  2.084e-07   1.140e-08
50-150  3.559e-07   2.950e-08
15-150  6.146e-07   2.890e-08
Thermal bremsstrahlung (OTTB)

Spectral model: thermal bremsstrahlung
------------------------------------------------------------
Parameters  : value         Lower 90%    Upper 90%
kT [keV]    : 200.000       (      )
Norm        : 42.4326       (-1.6216     1.62159)
------------------------------------------------------------
#Fit statistic : Chi-Squared =          51.66 using 59 PHA bins.
# Reduced chi-squared =         0.9063 for     57 degrees of freedom
# Null hypothesis probability =   6.750094e-01

Energy  Fluence     90% Error
[keV]   [erg/cm2]   [erg/cm2]
15- 25  1.057e-07   4.150e-09
25- 50  2.033e-07   8.350e-09
50-150  4.458e-07   1.875e-08
15-150  7.548e-07   3.405e-08
Double BB
Spectral model: bbodyrad<1> + bbodyrad<2>
------------------------------------------------------------
Parameters  : value         Lower 90%    Upper 90%
kT1 [keV]   : 7.59155        (-1.02906      1.0886)
R1^2/D10^2  : 8.05662        (-2.82113      5.17222)
kT2 [keV]   : 29.8021        (-4.11361      6.04839)
R2^2/D10^2  : 8.56747E-02    (-0.0396801   0.0598037)
------------------------------------------------------------
#Fit statistic : Chi-Squared =          51.45 using 59 PHA bins.
# Reduced chi-squared =         0.9355 for     55 degrees of freedom
# Null hypothesis probability =   6.109130e-01

Energy  Fluence     90% Error
[keV]   [erg/cm2]   [erg/cm2]
15- 25  9.248e-08   1.313e-08
25- 50  2.020e-07   1.945e-08
50-150  4.908e-07   7.135e-08
15-150  7.852e-07   9.615e-08
Pre-slew spectrum (Pre-slew PHA with pre-slew DRM)
Power-law model

Spectral model in power-law:
------------------------------------------------------------
Parameters  : value       lower 90%   higher 90%
Photon index: 1.38047     ( -0.0415988   0.041581 )
Norm@50keV  : 4.61936E-02    ( -0.00100214   0.00100182 )
------------------------------------------------------------
#Fit statistic : Chi-Squared =          55.08 using 59 PHA bins.
# Reduced chi-squared =         0.9664 for     57 degrees of freedom
# Null hypothesis probability =   5.473267e-01

Photon flux (15-150 keV)    in 8.96 sec: 5.60110 ( -0.13581  0.136389 ) ph/cm2/s
Energy fluence (15-150 keV)             : 4.01562e-06 ( -9.08947e-08  9.10139e-08 ) ergs/cm2
Cutoff power-law model

Spectral model in the cutoff power-law:
------------------------------------------------------------
Parameters  : value       lower 90%   higher 90%
Photon index: 1.33359     ( -0.163868   0.0637818 )
Epeak [keV] : 796.831      ( -845.214 -845.214 )
Norm@50keV  : 4.84060E-02    ( -0.00448483   0.00831185 )
------------------------------------------------------------
#Fit statistic : Chi-Squared =          54.87 using 59 PHA bins.
# Reduced chi-squared =         0.9799 for     56 degrees of freedom
# Null hypothesis probability =   5.176101e-01

Photon flux (15-150 keV)    in 8.96 sec: 5.58378 ( -0.12688  0.14567 ) ph/cm2/s
Energy fluence (15-150 keV)             : 4.00486e-06 ( -9.50298e-08  9.96531e-08 ) ergs/cm2
Band function
Spectral model in the Band function:
------------------------------------------------------------
Parameters  : value       lower 90%   higher 90%
alpha       : -0.652590   ( 0.916265   5.91213 )
beta        : -1.38821    ( 1.38731   0.0451039 )
Epeak [keV] : 48.7359      ( -48.8106 319.097 )
Norm@50keV   : 0.153703    ( -0.15482   2.81975e+06 )
------------------------------------------------------------
#Fit statistic : Chi-Squared =          54.59 using 59 PHA bins.
# Reduced chi-squared =         0.9925 for     55 degrees of freedom
# Null hypothesis probability =   4.904107e-01

Photon flux (15-150 keV)    in 8.96 sec:  (    ) ph/cm2/s
Energy fluence (15-150 keV)             : 0 ( 0  0 ) ergs/cm2
S(25-50 keV) vs. S(50-100 keV) plot
S(25-50 keV)  = 9.34e-07
S(50-100 keV) = 1.44e-06
T90 vs. Hardness ratio plot
T90                                   = 7.2279999256134 sec.
Hardness ratio (energy fluence ratio) = 1.54176
Color vs. Color plot
Count Ratio  (25-50 keV) / (15-25 keV) = 1.41796
Count Ratio (50-100 keV) / (15-25 keV) = 1.22064
Mask shadow pattern
IMX = -1.950279525749544E-02, IMY = 4.800583447882256E-01
TIME vs. PHA plot around the trigger time

Blue+Cyan dotted lines: Time interval of the scaled map
From 0.000000 to 0.256000
TIME vs. DetID plot around the trigger time
Blue+Cyan dotted lines: Time interval of the scaled map
From 0.000000 to 0.256000
100 us light curve (15-350 keV)
Blue+Cyan dotted lines: Time interval of the scaled map
From 0.000000 to 0.256000
Spacecraft aspect plot
Bright source in the pre-burst/pre-slew/post-slew images
Pre-burst image of 15-350 keV band
Time interval of the image:
-239.104000 -0.256000

# RAcent  DECcent POSerr Theta    Phi  PeakCts   SNR AngSep     Name
#  [deg]    [deg]    ['] [deg]  [deg]                   [']
170.0940 -60.6563    3.8  45.9 -177.6   1.1604   3.0    6.8	Cen X-3
186.4030 -62.7616   12.2  44.7 -166.5   0.3377   0.9    7.0	GX 301-2
172.4551 -74.5950    2.3  32.4 -172.0   1.1859   5.1 ------	UNKNOWN
Pre-slew background subtracted image of 15-350 keV band
Time interval of the image:
-0.256000 8.704000

# RAcent  DECcent POSerr Theta    Phi  PeakCts   SNR AngSep     Name
#  [deg]    [deg]    ['] [deg]  [deg]                   [']
170.0815 -60.7109    9.7  45.9 -177.6  -0.1620  -1.2    8.7	Cen X-3
186.3347 -62.6476    5.5  44.8 -166.5   0.2521   2.1   11.5	GX 301-2
133.7007 -53.0282    2.8  47.8  153.6   0.9056   4.2 ------	UNKNOWN
350.7633 -47.8336    2.5  26.8  -17.7   0.3270   4.7 ------	UNKNOWN
301.3101 -64.9429    0.2  25.7  -92.3   6.2979  65.8 ------	UNKNOWN
Post-slew image of 15-350 keV band
Time interval of the image:
292.196630 963.003800

# RAcent  DECcent POSerr Theta    Phi  PeakCts   SNR AngSep     Name
#  [deg]    [deg]    ['] [deg]  [deg]                   [']
170.5710 -60.4861    9.2  53.9  164.5   3.0167   1.3   11.1	Cen X-3
186.4294 -62.7532    5.0  49.5  172.7   2.1640   2.3    6.3	GX 301-2
264.5613 -44.3346    0.0  38.5 -119.7   0.3553   0.5   10.4	4U 1735-44
 36.3420 -69.8609    2.6  26.8  102.9   2.5164   4.4 ------	UNKNOWN
195.8921 -58.1919    3.1  51.8 -179.4   4.3463   3.8 ------	UNKNOWN
303.0709 -21.6962    2.4  44.9  -60.3   8.6147   4.8 ------	UNKNOWN
Plot creation:
Sat May 30 14:56:32 EDT 2015