Special notes of this burst
Image
Pre-slew 15.0-350.0 keV image (Event data)

#   RAcent    DECcent   POSerr    Theta     Phi              Peak Cts       SNR   Name
   85.2364    -4.4021   0.0029    18.1276   178.4870         3.2945669     67.137 TRIG_00582374

Foreground time interval of the image:
  0.384   9.485 (delta_t =   9.101 [sec])
Background time interval of the image:
-103.315   0.384 (delta_t = 103.699 [sec])
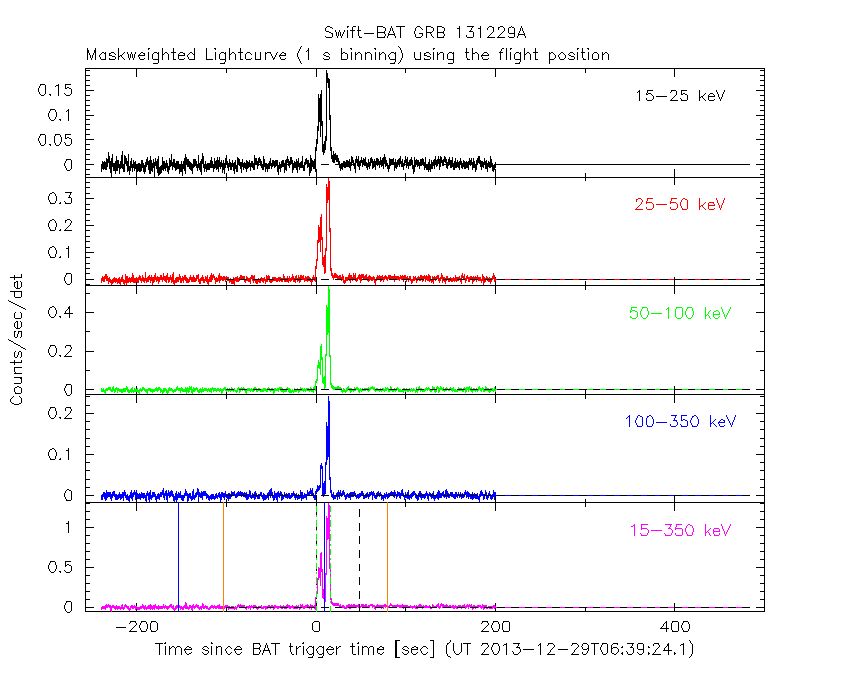
Lightcurves
Notes:
- 1) The mask-weighted light curves are using the flight position.
- 2) Multiple plots of different time binning/intervals are shown to cover all scenarios of short/long GRBs, rate/image triggers, and real/false positives.
- 3) For all the mask-weighted lightcurves, the y-axis units are counts/sec/det where a det is 0.4 x 0.4 = 0.16 sq cm.
- 4) The verticle lines correspond to following: green dotted lines are T50 interval, black dotted lines are T90 interval, blue solid line(s) is a spacecraft slew start time, and orange solid line(s) is a spacecraft slew end time.
- 5) Time of each bin is in the middle of the bin.
1 s binning
From T0-310 s to T0+310 s

From T100_start - 20 s to T100_end + 30 s

Full time interval
64 ms binning
Full time interval

From T100_start to T100_end

From T0-5 sec to T0+5 sec

16 ms binning
From T100_start-5 s to T100_start+5 s

8 ms binning
From T100_start-3 s to T100_start+3 s

2 ms binning
From T100_start-1 s to T100_start+1 s

SN=5 or 10 sec. binning (whichever binning is satisfied first)

SN=5 or 10 sec. binning (T < 200 sec)

Quad-rate summed light curves (from T0-300s to T0+1000s)

The mask-weighted light curves based on cleaned DPHs

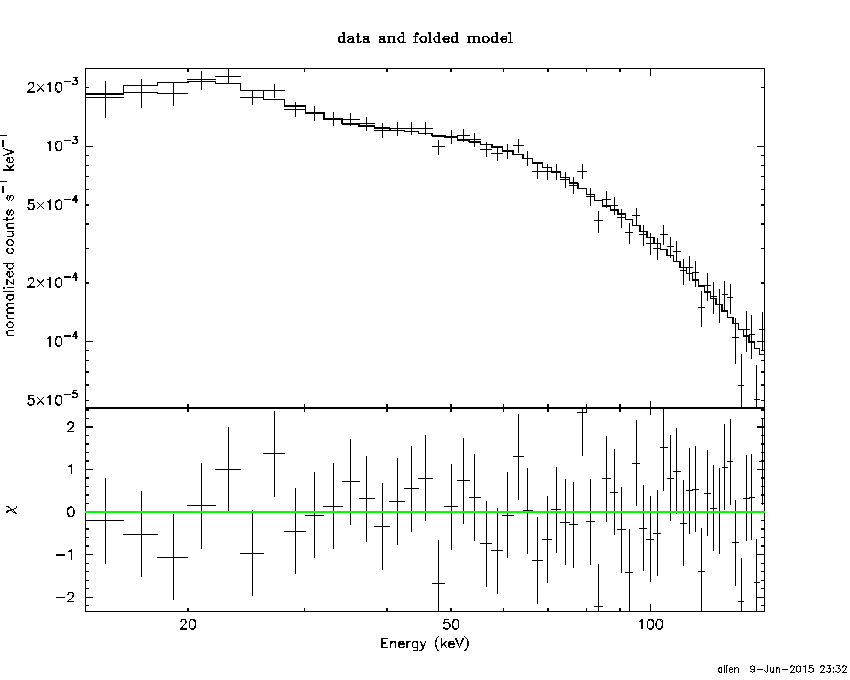
Spectral Evolution

Spectra
Notes:
- 1) The fitting includes the systematic errors.
- 2) When the burst includes telescope slew time periods, the fitting uses an average response file made from multiple 5-s response files through out the slew time plus single time preiod for the non-slew times, and weighted by the total counts in the corresponding time period using addrmf. An average response file is needed becuase a spectral fit using the pre-slew DRM will introduce some errors in both a spectral shape and a normalization if the PHA file contains a lot of the slew/post-slew time interval.
- 3) For fits to more complicated models (e.g. a power-law over a cutoff power-law), the BAT team has decided to require a chi-square improvement of more than 6 for each extra dof.
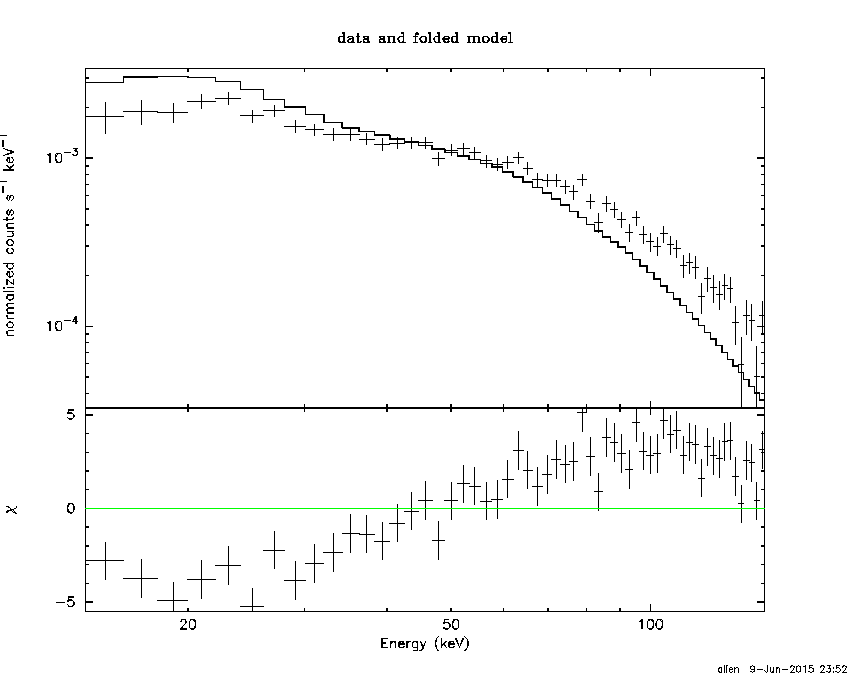
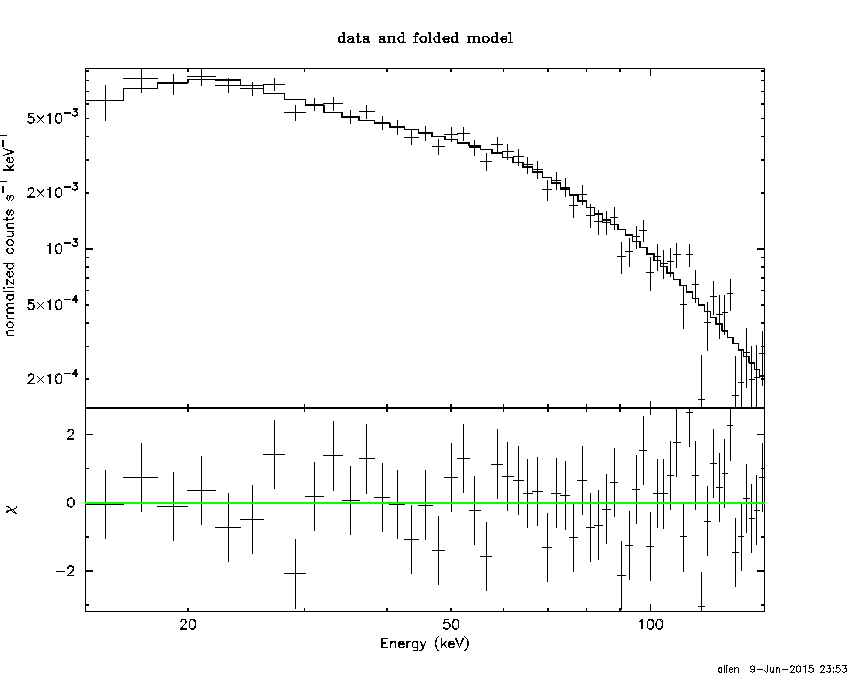
Time averaged spectrum fit using the average DRM
Power-law model

Time interval is from    0.384 sec. to   96.384 sec.

Spectral model in power-law:
------------------------------------------------------------
Parameters  : value       lower 90%   higher 90%
Photon index: 1.07302     ( -0.0416669   0.0413998 )
Norm@50keV  : 6.80265E-03    ( -0.000153809   0.000153249 )
------------------------------------------------------------
#Fit statistic : Chi-Squared =          49.51 using 59 PHA bins.
# Reduced chi-squared =         0.8685 for     57 degrees of freedom
# Null hypothesis probability =   7.492452e-01

Photon flux (15-150 keV)    in 96 sec: 0.787131 ( -0.0188001  0.0188676 ) ph/cm2/s
Energy fluence (15-150 keV)             : 6.88777e-06 ( -1.53683e-07  1.53843e-07 ) ergs/cm2
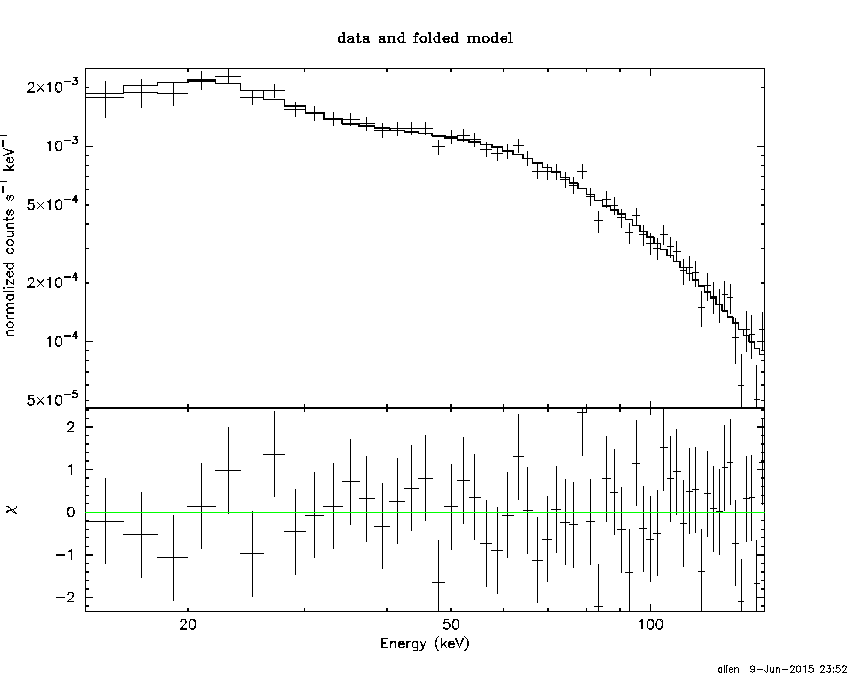
Cutoff power-law model
Time interval is from    0.384 sec. to   96.384 sec.
Spectral model in the cutoff power-law:
------------------------------------------------------------
Parameters  : value       lower 90%   higher 90%
Photon index: 1.06726     ( -0.0419691   0.0417332 )
Epeak [keV] : 9988.07      ( -9987.54 -9987.54 )
Norm@50keV  : 6.83998E-03    ( -0.000146557   0.00109987 )
------------------------------------------------------------
#Fit statistic : Chi-Squared =          49.50 using 59 PHA bins.
# Reduced chi-squared =         0.8839 for     56 degrees of freedom
# Null hypothesis probability =   7.176646e-01

Photon flux (15-150 keV)    in 96 sec: 0.786754 ( -0.018453  0.018723 ) ph/cm2/s
Energy fluence (15-150 keV)             : 6.88975e-06 ( -1.4735e-07  1.53389e-07 ) ergs/cm2
Band function
Time interval is from    0.384 sec. to   96.384 sec.

Spectral model in the Band function:
------------------------------------------------------------
Parameters  : value       lower 90%   higher 90%
alpha       : -0.891081   ( 0.891081   0.891081 )
beta        : -1.07302    ( -0.041377   0.0416979 )
Epeak [keV] : 40.9337      ( -40.9337 -40.9337 )
Norm@50keV   : 1.17577E-02    ( -0.00413424   313711 )
------------------------------------------------------------
#Fit statistic : Chi-Squared =          49.51 using 59 PHA bins.
# Reduced chi-squared =         0.9001 for     55 degrees of freedom
# Null hypothesis probability =   6.837769e-01

Photon flux (15-150 keV)    in 96 sec:  (    ) ph/cm2/s
Energy fluence (15-150 keV)             : 0 ( 0  0 ) ergs/cm2
Single BB
Spectral model blackbody:
------------------------------------------------------------
Parameters  : value    Lower 90%  Upper 90%
kT [keV]    : 23.2364  (  )
R^2/D10^2   : 2.26572E-02  (   )
(R is the radius in km and D10 is the distance to the source in units of 10 kpc)
------------------------------------------------------------
#Fit statistic : Chi-Squared =         422.91 using 59 PHA bins.
# Reduced chi-squared =         7.4195 for     57 degrees of freedom
# Null hypothesis probability =   2.576337e-57

Energy  Fluence     90% Error
[keV]   [erg/cm2]   [erg/cm2]
15- 25  2.118e-07   9.984e-09
25- 50  1.156e-06   3.840e-08
50-150  4.659e-06   1.469e-07
15-150  6.026e-06   1.550e-07
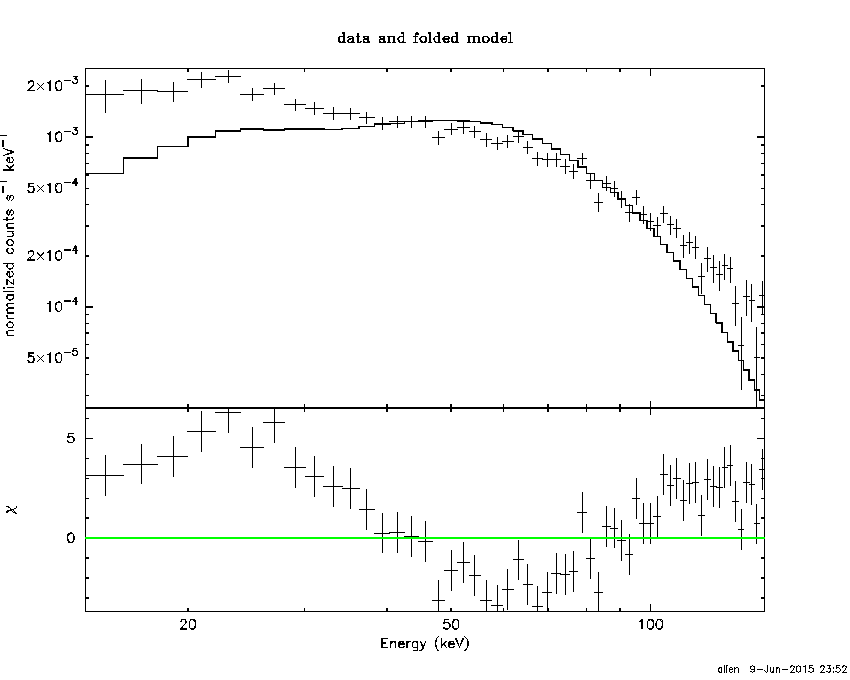
Thermal bremsstrahlung (OTTB)
Spectral model: thermal bremsstrahlung
------------------------------------------------------------
Parameters  : value         Lower 90%    Upper 90%
kT [keV]    : 199.363       (      )
Norm        : 3.41950       (     )
------------------------------------------------------------
#Fit statistic : Chi-Squared =         473.64 using 59 PHA bins.
# Reduced chi-squared =         8.3095 for     57 degrees of freedom
# Null hypothesis probability =   5.509208e-67

Energy  Fluence     90% Error
[keV]   [erg/cm2]   [erg/cm2]
15- 25  8.174e-07   1.992e-08
25- 50  1.572e-06   3.696e-08
50-150  3.449e-06   8.736e-08
15-150  5.839e-06   1.517e-07
Double BB
Spectral model: bbodyrad<1> + bbodyrad<2>
------------------------------------------------------------
Parameters  : value         Lower 90%    Upper 90%
kT1 [keV]   : 8.88356        (-0.84889      0.92639)
R1^2/D10^2  : 0.283702        (-0.0742064      0.107777)
kT2 [keV]   : 38.4631        (-3.49882      4.74872)
R2^2/D10^2  : 4.08944E-03    (-0.001206   0.00142002)
------------------------------------------------------------
#Fit statistic : Chi-Squared =          54.20 using 59 PHA bins.
# Reduced chi-squared =         0.9855 for     55 degrees of freedom
# Null hypothesis probability =   5.051235e-01

Energy  Fluence     90% Error
[keV]   [erg/cm2]   [erg/cm2]
15- 25  4.927e-07   4.061e-08
25- 50  1.385e-06   7.104e-08
50-150  5.044e-06   2.674e-07
15-150  6.922e-06   3.120e-07
Peak spectrum fit
Power-law model
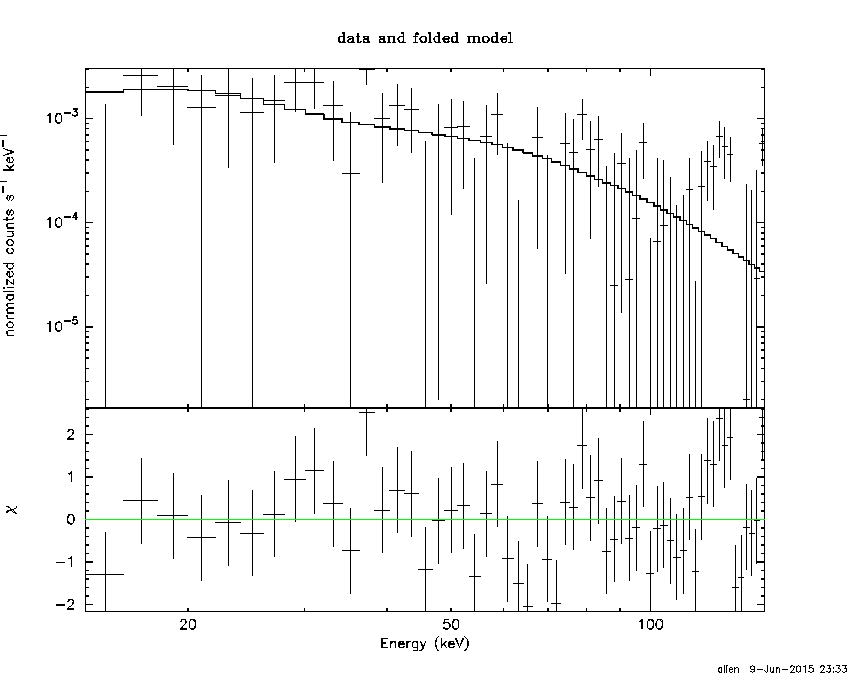
Time interval is from    7.884 sec. to    8.884 sec.

Spectral model in power-law:
------------------------------------------------------------
Parameters  : value       lower 90%   higher 90%
Photon index: 1.47519     ( -0.484478   0.477425 )
Norm@50keV  : 4.27814E-03    ( -0.00120308   0.0011806 )
------------------------------------------------------------
#Fit statistic : Chi-Squared =          67.67 using 59 PHA bins.
# Reduced chi-squared =          1.187 for     57 degrees of freedom
# Null hypothesis probability =   1.576194e-01

Photon flux (15-150 keV)    in 1 sec: 0.530597 ( -0.14437  0.144683 ) ph/cm2/s
Energy fluence (15-150 keV)             : 4.07543e-08 ( -1.2332e-08  1.271e-08 ) ergs/cm2
Cutoff power-law model
Time interval is from    7.884 sec. to    8.884 sec.
Spectral model in the cutoff power-law:
------------------------------------------------------------
Parameters  : value       lower 90%   higher 90%
Photon index: 1.48422     ( -0.898549   0.471783 )
Epeak [keV] : 9999.36      ( -9999.36 -9999.36 )
Norm@50keV  : 4.26806E-03    ( -0.00120795   0.0162364 )
------------------------------------------------------------
#Fit statistic : Chi-Squared =          67.67 using 59 PHA bins.
# Reduced chi-squared =          1.208 for     56 degrees of freedom
# Null hypothesis probability =   1.364705e-01

Photon flux (15-150 keV)    in 1 sec: 0.531297 ( -0.145242  0.143471 ) ph/cm2/s
Energy fluence (15-150 keV)             : 4.04982e-08 ( -1.359e-08  1.28051e-08 ) ergs/cm2
Band function

Time interval is from    7.884 sec. to    8.884 sec.

Spectral model in the Band function:
------------------------------------------------------------
Parameters  : value       lower 90%   higher 90%
alpha       : 4.90967   ( -4.90967   -4.90967 )
beta        : -2.09582    ( -2.94786   0.80872 )
Epeak [keV] : 33.8877      ( -33.8877 9.93743 )
Norm@50keV   : 71.7039    ( -18.7914   2.55947e+06 )
------------------------------------------------------------
#Fit statistic : Chi-Squared =          65.90 using 59 PHA bins.
# Reduced chi-squared =          1.198 for     55 degrees of freedom
# Null hypothesis probability =   1.491817e-01

Photon flux (15-150 keV)    in 1 sec:  (    ) ph/cm2/s
Energy fluence (15-150 keV)             : 0 ( 0  0 ) ergs/cm2
Single BB

Spectral model blackbody:
------------------------------------------------------------
Parameters  : value    Lower 90%  Upper 90%
kT [keV]    : 10.6717  (-2.50387  4.12154)
R^2/D10^2   : 0.205365  (-0.144913   0.348254)
(R is the radius in km and D10 is the distance to the source in units of 10 kpc)
------------------------------------------------------------
#Fit statistic : Chi-Squared =          69.53 using 59 PHA bins.
# Reduced chi-squared =          1.220 for     57 degrees of freedom
# Null hypothesis probability =   1.233799e-01

Energy  Fluence     90% Error
[keV]   [erg/cm2]   [erg/cm2]
15- 25  4.854e-09   2.809e-09
25- 50  1.319e-08   7.220e-09
50-150  8.287e-09   5.421e-09
15-150  2.633e-08   1.271e-08
Thermal bremsstrahlung (OTTB)
Spectral model: thermal bremsstrahlung
------------------------------------------------------------
Parameters  : value         Lower 90%    Upper 90%
kT [keV]    : 199.363       (-199.363      -199.363)
Norm        : 2.17382       (-0.58465     0.585052)
------------------------------------------------------------
#Fit statistic : Chi-Squared =          67.88 using 59 PHA bins.
# Reduced chi-squared =          1.191 for     57 degrees of freedom
# Null hypothesis probability =   1.533705e-01

Energy  Fluence     90% Error
[keV]   [erg/cm2]   [erg/cm2]
15- 25  5.413e-09   3.304e-09
25- 50  1.041e-08   6.305e-09
50-150  2.284e-08   1.386e-08
15-150  3.866e-08   2.352e-08
Double BB
Spectral model: bbodyrad<1> + bbodyrad<2>
------------------------------------------------------------
Parameters  : value         Lower 90%    Upper 90%
kT1 [keV]   : 199.363        (-199.363      -199.363)
R1^2/D10^2  : 8.11927E-05        (-4.56645e-05      0.00191148)
kT2 [keV]   : 8.95545        (-2.07472      2.37511)
R2^2/D10^2  : 0.344401    (-0.224854   0.55101)
------------------------------------------------------------
#Fit statistic : Chi-Squared =          62.18 using 59 PHA bins.
# Reduced chi-squared =          1.131 for     55 degrees of freedom
# Null hypothesis probability =   2.357554e-01

Energy  Fluence     90% Error
[keV]   [erg/cm2]   [erg/cm2]
15- 25  5.468e-09   3.268e-09
25- 50  1.219e-08   7.400e-09
50-150  2.575e-08   5.745e-09
15-150  4.341e-08   1.759e-08
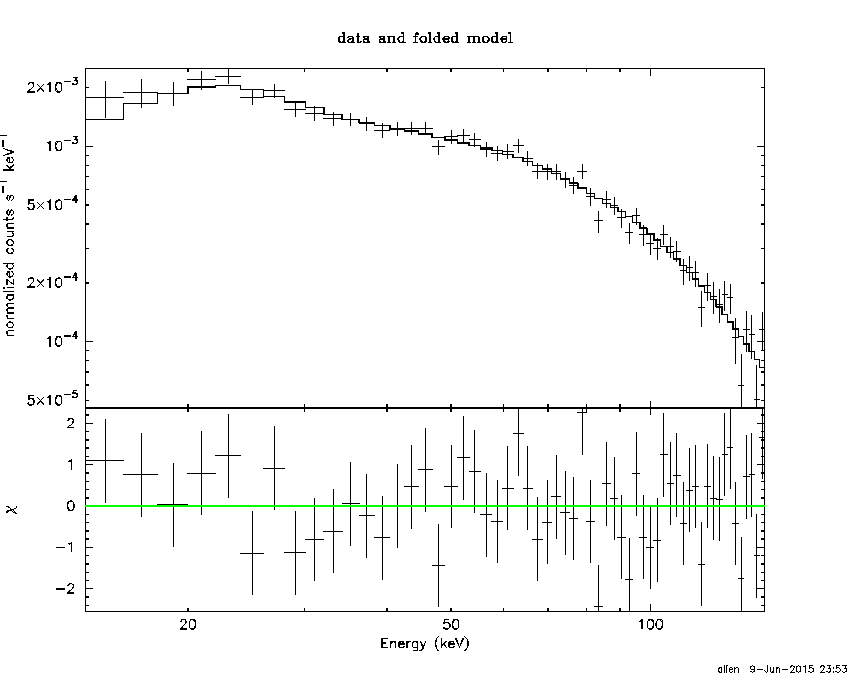
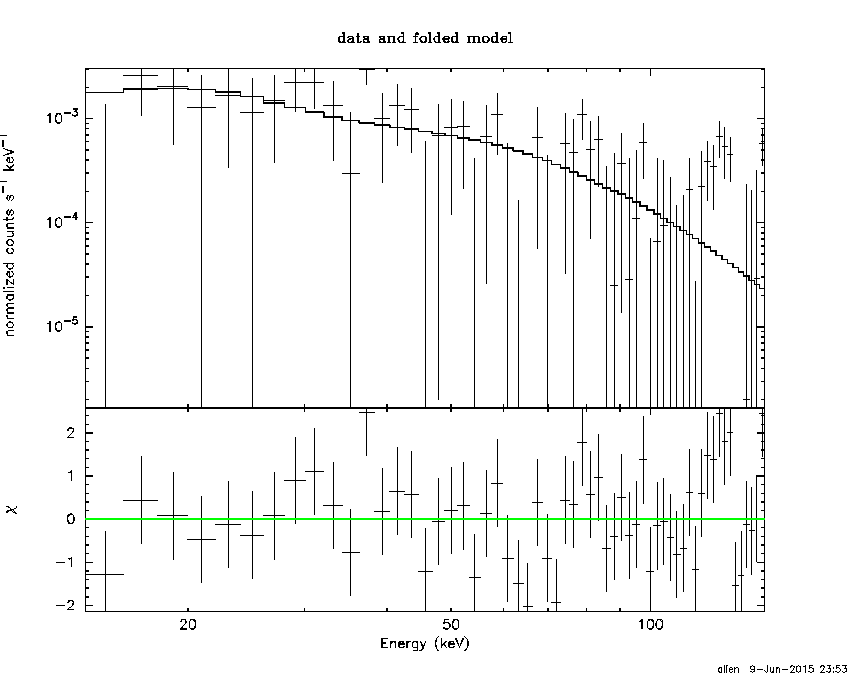
Pre-slew spectrum (Pre-slew PHA with pre-slew DRM)
Power-law model

Spectral model in power-law:
------------------------------------------------------------
Parameters  : value       lower 90%   higher 90%
Photon index: 1.30451     ( -0.0460613   0.0459512 )
Norm@50keV  : 2.34778E-02    ( -0.000592542   0.000592443 )
------------------------------------------------------------
#Fit statistic : Chi-Squared =          81.96 using 59 PHA bins.
# Reduced chi-squared =          1.438 for     57 degrees of freedom
# Null hypothesis probability =   1.682273e-02

Photon flux (15-150 keV)    in 9.101 sec: 2.80330 ( -0.0764402  0.0765849 ) ph/cm2/s
Energy fluence (15-150 keV)             : 2.10916e-06 ( -5.63995e-08  5.64408e-08 ) ergs/cm2
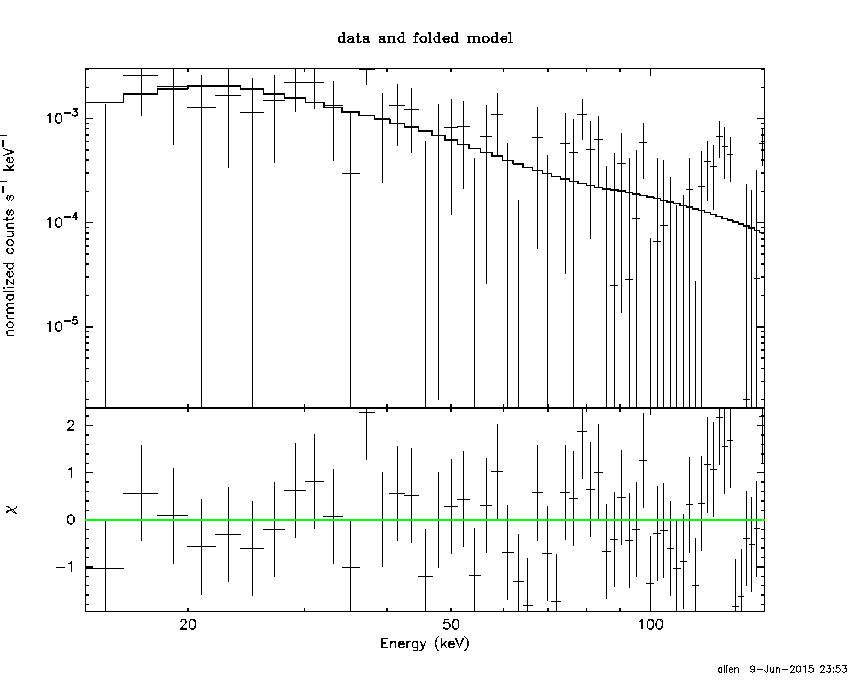
Cutoff power-law model

Spectral model in the cutoff power-law:
------------------------------------------------------------
Parameters  : value       lower 90%   higher 90%
Photon index: 1.03804     ( -0.191699   0.183788 )
Epeak [keV] : 203.500      ( -61.7322 297.375 )
Norm@50keV  : 3.09451E-02    ( -0.00524398   0.00660183 )
------------------------------------------------------------
#Fit statistic : Chi-Squared =          75.74 using 59 PHA bins.
# Reduced chi-squared =          1.353 for     56 degrees of freedom
# Null hypothesis probability =   4.057154e-02

Photon flux (15-150 keV)    in 9.101 sec: 2.75807 ( -0.08181  0.08201 ) ph/cm2/s
Energy fluence (15-150 keV)             : 2.07893e-06 ( -6.08857e-08  6.06491e-08 ) ergs/cm2
Band function
Spectral model in the Band function:
------------------------------------------------------------
Parameters  : value       lower 90%   higher 90%
alpha       : -0.119972   ( -0.801711   1.45382 )
beta        : -1.41374    ( -0.112949   0.0757557 )
Epeak [keV] : 60.1980      ( -20.5431 77.081 )
Norm@50keV   : 0.114015    ( -0.118176   1.08393 )
------------------------------------------------------------
#Fit statistic : Chi-Squared =          69.89 using 59 PHA bins.
# Reduced chi-squared =          1.271 for     55 degrees of freedom
# Null hypothesis probability =   8.521078e-02

Photon flux (15-150 keV)    in 9.101 sec:  (    ) ph/cm2/s
Energy fluence (15-150 keV)             : 0 ( 0  0 ) ergs/cm2
S(25-50 keV) vs. S(50-100 keV) plot

S(25-50 keV)  = 1.34e-06
S(50-100 keV) = 2.54e-06
T90 vs. Hardness ratio plot
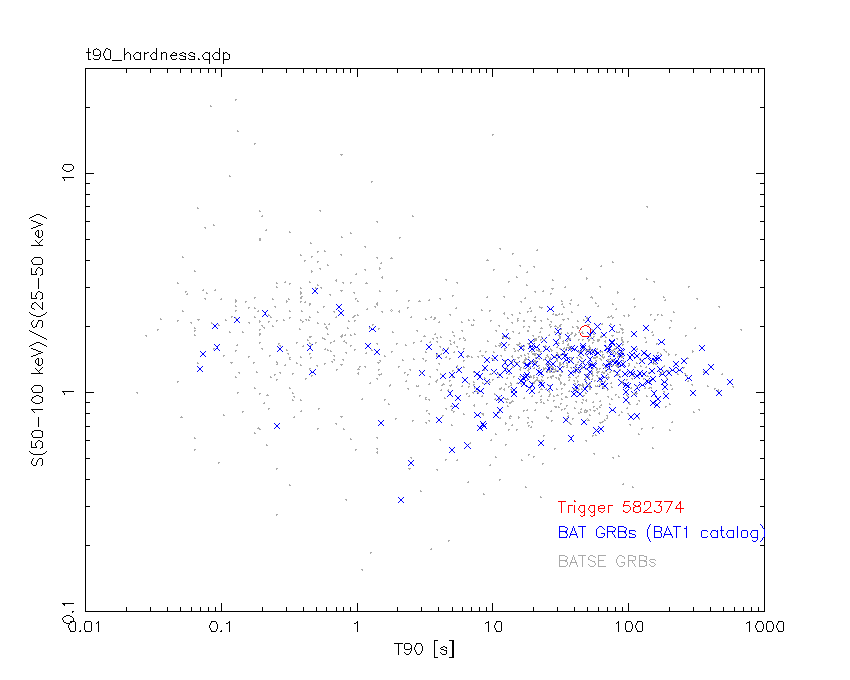
T90                                   = 48 sec.
Hardness ratio (energy fluence ratio) = 1.89552
Color vs. Color plot

Count Ratio  (25-50 keV) / (15-25 keV) = 1.73071
Count Ratio (50-100 keV) / (15-25 keV) = 1.75457
Mask shadow pattern

IMX = -3.272700866210436E-01, IMY = -8.643914241720100E-03
TIME vs. PHA plot around the trigger time

TIME vs. DetID plot around the trigger time

100 us light curve (15-350 keV)

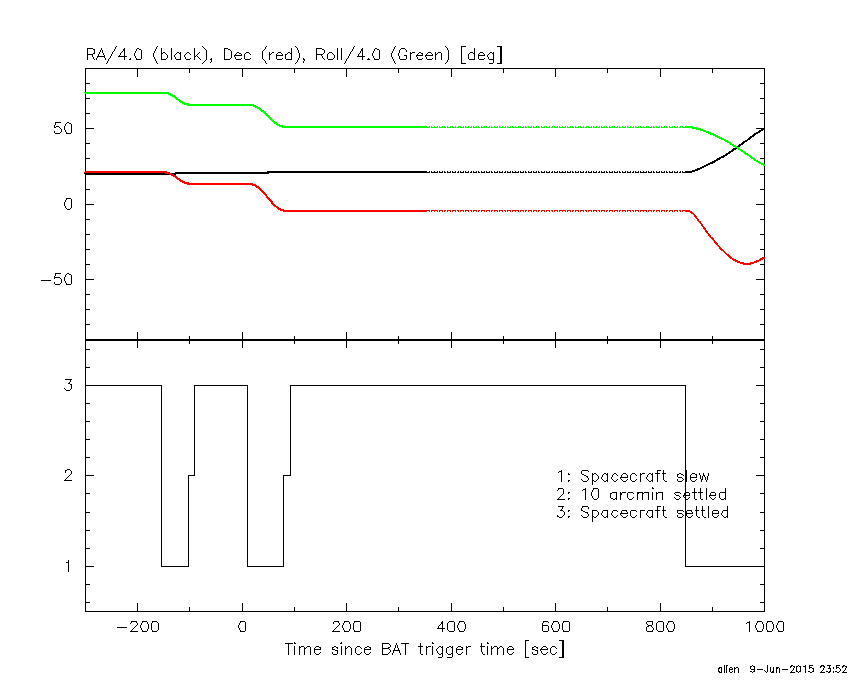
Spacecraft aspect plot
Bright source in the pre-burst/pre-slew/post-slew images
Pre-burst image of 15-350 keV band
Time interval of the image:
-103.315400 0.384000

# RAcent  DECcent POSerr Theta    Phi  PeakCts   SNR AngSep     Name
#  [deg]    [deg]    ['] [deg]  [deg]                   [']
 83.6304  22.0158    0.3   8.5   12.6   4.3327  38.0    0.2	Crab
 68.6547 -44.6062    3.3  59.5 -161.8   3.2238   3.5 ------	UNKNOWN
 51.3359 -21.9913    3.3  47.0 -132.0   1.5475   3.5 ------	UNKNOWN
 45.1920  -7.1970    2.8  42.6 -110.2   2.3842   4.1 ------	UNKNOWN
Pre-slew background subtracted image of 15-350 keV band
Time interval of the image:
0.384000 9.484590

# RAcent  DECcent POSerr Theta    Phi  PeakCts   SNR AngSep     Name
#  [deg]    [deg]    ['] [deg]  [deg]                   [']
 83.7768  22.1579   10.9   8.7   13.4   0.0526   1.1   11.7	Crab
122.9643  49.2071    2.3  48.6   41.0   1.2334   5.0 ------	UNKNOWN
 85.2364  -4.4021    0.2  18.1  178.5   3.2946  67.2 ------	UNKNOWN
 44.7185  -4.6296    3.9  41.8 -106.5   0.6448   3.0 ------	UNKNOWN
Post-slew image of 15-350 keV band
Time interval of the image:
80.084610 482.514000

# RAcent  DECcent POSerr Theta    Phi  PeakCts   SNR AngSep     Name
#  [deg]    [deg]    ['] [deg]  [deg]                   [']
 83.6331  22.0206    0.4  26.5   62.6   4.9960  26.4    0.4	Crab
135.5324 -40.4585   14.8  57.7 -158.0   0.6627   0.8    5.8	Vela X-1
 59.0670  26.1047    2.6  39.7   27.5   1.0956   4.5 ------	UNKNOWN
 85.2232  -4.4356    2.2   0.0  152.3   0.7006   5.2 ------	UNKNOWN
 86.1908 -33.9631    2.7  29.5 -115.8   0.7861   4.3 ------	UNKNOWN
136.5798 -42.4884    3.3  59.3 -156.3   3.6787   3.5 ------	UNKNOWN
 47.5324 -30.0658    3.3  43.8  -64.3   2.5834   3.5 ------	UNKNOWN
Plot creation:
Tue Jun  9 23:53:54 EDT 2015