Special notes of this burst
Image
Pre-slew 15.0-350.0 keV image (Event data)
#   RAcent    DECcent   POSerr    Theta     Phi              Peak Cts       SNR   Name
  211.9146     1.3321   0.0018    15.4023    -4.5242        11.1562718    105.463 TRIG_00582760

Foreground time interval of the image:
 -0.148   9.189 (delta_t =   9.337 [sec])
Background time interval of the image:
-50.011  -0.148 (delta_t =  49.863 [sec])
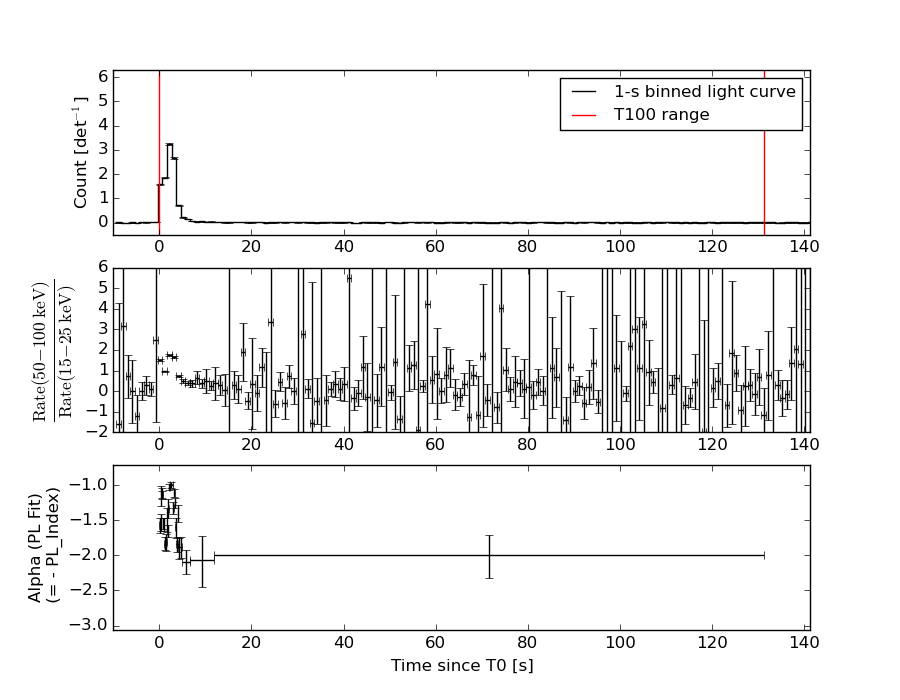
Lightcurves
Notes:
- 1) The mask-weighted light curves are using the flight position.
- 2) Multiple plots of different time binning/intervals are shown to cover all scenarios of short/long GRBs, rate/image triggers, and real/false positives.
- 3) For all the mask-weighted lightcurves, the y-axis units are counts/sec/det where a det is 0.4 x 0.4 = 0.16 sq cm.
- 4) The verticle lines correspond to following: green dotted lines are T50 interval, black dotted lines are T90 interval, blue solid line(s) is a spacecraft slew start time, and orange solid line(s) is a spacecraft slew end time.
- 5) Time of each bin is in the middle of the bin.
1 s binning
From T0-310 s to T0+310 s
From T100_start - 20 s to T100_end + 30 s
Full time interval
64 ms binning
Full time interval
From T100_start to T100_end
From T0-5 sec to T0+5 sec
16 ms binning
From T100_start-5 s to T100_start+5 s
Blue+Cyan dotted lines: Time interval of the scaled map
From 0.000000 to 0.064000
8 ms binning
From T100_start-3 s to T100_start+3 s
Blue+Cyan dotted lines: Time interval of the scaled map
From 0.000000 to 0.064000
2 ms binning
From T100_start-1 s to T100_start+1 s
Blue+Cyan dotted lines: Time interval of the scaled map
From 0.000000 to 0.064000
SN=5 or 10 sec. binning (whichever binning is satisfied first)
SN=5 or 10 sec. binning (T < 200 sec)
Quad-rate summed light curves (from T0-300s to T0+1000s)
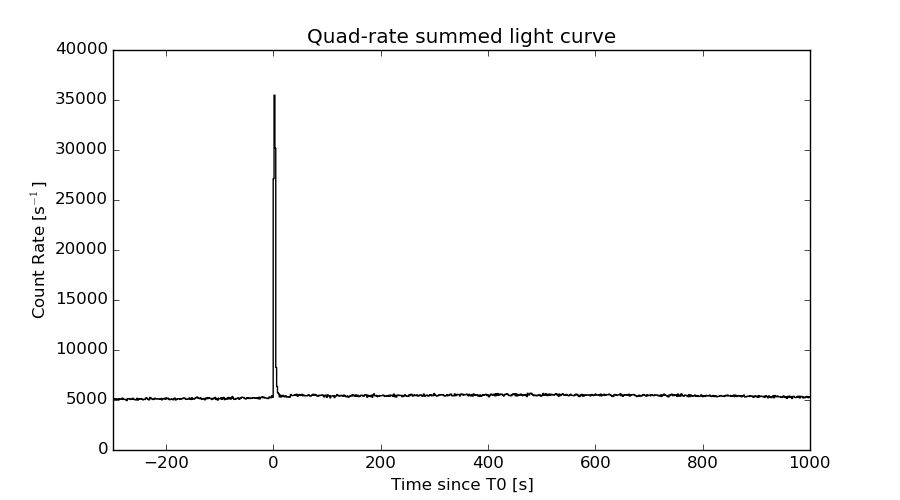
The mask-weighted light curves based on cleaned DPHs

Spectral Evolution
Spectra
Notes:
- 1) The fitting includes the systematic errors.
- 2) When the burst includes telescope slew time periods, the fitting uses an average response file made from multiple 5-s response files through out the slew time plus single time preiod for the non-slew times, and weighted by the total counts in the corresponding time period using addrmf. An average response file is needed becuase a spectral fit using the pre-slew DRM will introduce some errors in both a spectral shape and a normalization if the PHA file contains a lot of the slew/post-slew time interval.
- 3) For fits to more complicated models (e.g. a power-law over a cutoff power-law), the BAT team has decided to require a chi-square improvement of more than 6 for each extra dof.
Time averaged spectrum fit using the average DRM
Power-law model
Time interval is from   -0.148 sec. to  131.220 sec.

Spectral model in power-law:
------------------------------------------------------------
Parameters  : value       lower 90%   higher 90%
Photon index: 1.37422     ( -0.0416163   0.0415434 )
Norm@50keV  : 5.96584E-03    ( -0.000128529   0.000128483 )
------------------------------------------------------------
#Fit statistic : Chi-Squared =          36.66 using 59 PHA bins.
# Reduced chi-squared =         0.6431 for     57 degrees of freedom
# Null hypothesis probability =   9.834503e-01

Photon flux (15-150 keV)    in 131.4 sec: 0.722391 ( -0.0174096  0.0174626 ) ph/cm2/s
Energy fluence (15-150 keV)             : 7.61568e-06 ( -1.71179e-07  1.71348e-07 ) ergs/cm2
Cutoff power-law model
Time interval is from   -0.148 sec. to  131.220 sec.
Spectral model in the cutoff power-law:
------------------------------------------------------------
Parameters  : value       lower 90%   higher 90%
Photon index: 1.22974     ( -0.170123   0.131195 )
Epeak [keV] : 304.134      ( -132.839 -304.156 )
Norm@50keV  : 6.90640E-03    ( -0.000976658   0.00126157 )
------------------------------------------------------------
#Fit statistic : Chi-Squared =          34.41 using 59 PHA bins.
# Reduced chi-squared =         0.6145 for     56 degrees of freedom
# Null hypothesis probability =   9.897802e-01

Photon flux (15-150 keV)    in 131.4 sec: 0.714182 ( -0.019505  0.019592 ) ph/cm2/s
Energy fluence (15-150 keV)             : 7.54917e-06 ( -1.894e-07  1.88572e-07 ) ergs/cm2
Band function
Time interval is from   -0.148 sec. to  131.220 sec.

Spectral model in the Band function:
------------------------------------------------------------
Parameters  : value       lower 90%   higher 90%
alpha       : -0.997407   ( -0.291118   5.72476 )
beta        : -1.44155    ( 1.4422   0.0822003 )
Epeak [keV] : 118.216      ( -82.6792 1333.86 )
Norm@50keV   : 9.37334E-03    ( -0.0029552   0.0085772 )
------------------------------------------------------------
#Fit statistic : Chi-Squared =          33.22 using 59 PHA bins.
# Reduced chi-squared =         0.6039 for     55 degrees of freedom
# Null hypothesis probability =   9.911963e-01

Photon flux (15-150 keV)    in 131.4 sec:  (    ) ph/cm2/s
Energy fluence (15-150 keV)             : 0 ( 0  0 ) ergs/cm2
Single BB
Spectral model blackbody:
------------------------------------------------------------
Parameters  : value    Lower 90%  Upper 90%
kT [keV]    : 18.4256  (  )
R^2/D10^2   : 4.01214E-02  (   )
(R is the radius in km and D10 is the distance to the source in units of 10 kpc)
------------------------------------------------------------
#Fit statistic : Chi-Squared =         429.10 using 59 PHA bins.
# Reduced chi-squared =         7.5280 for     57 degrees of freedom
# Null hypothesis probability =   1.740257e-58

Energy  Fluence     90% Error
[keV]   [erg/cm2]   [erg/cm2]
15- 25  3.556e-07   1.597e-08
25- 50  1.673e-06   5.453e-08
50-150  4.147e-06   1.524e-07
15-150  6.176e-06   1.629e-07
Thermal bremsstrahlung (OTTB)
Spectral model: thermal bremsstrahlung
------------------------------------------------------------
Parameters  : value         Lower 90%    Upper 90%
kT [keV]    : 200.000       (      )
Norm        : 3.04009       (-0.0656122     0.065568)
------------------------------------------------------------
#Fit statistic : Chi-Squared =         107.88 using 59 PHA bins.
# Reduced chi-squared =         1.8927 for     57 degrees of freedom
# Null hypothesis probability =   5.463042e-05

Energy  Fluence     90% Error
[keV]   [erg/cm2]   [erg/cm2]
15- 25  9.950e-07   2.595e-08
25- 50  1.914e-06   4.993e-08
50-150  4.198e-06   1.031e-07
15-150  7.107e-06   1.748e-07
Double BB
Spectral model: bbodyrad<1> + bbodyrad<2>
------------------------------------------------------------
Parameters  : value         Lower 90%    Upper 90%
kT1 [keV]   : 8.33253        (-0.789972      0.841348)
R1^2/D10^2  : 0.371362        (-0.0964824      0.143455)
kT2 [keV]   : 31.8642        (-2.9974      4.05568)
R2^2/D10^2  : 5.15248E-03    (-0.00171079   0.00212691)
------------------------------------------------------------
#Fit statistic : Chi-Squared =          47.41 using 59 PHA bins.
# Reduced chi-squared =         0.8619 for     55 degrees of freedom
# Null hypothesis probability =   7.567705e-01

Energy  Fluence     90% Error
[keV]   [erg/cm2]   [erg/cm2]
15- 25  7.340e-07   5.637e-08
25- 50  1.837e-06   8.804e-08
50-150  4.926e-06   2.891e-07
15-150  7.497e-06   3.732e-07
Peak spectrum fit
Power-law model
Time interval is from    1.968 sec. to    2.968 sec.

Spectral model in power-law:
------------------------------------------------------------
Parameters  : value       lower 90%   higher 90%
Photon index: 1.03566     ( -0.0342582   0.034139 )
Norm@50keV  : 0.257855    ( -0.00495106   0.00494506 )
------------------------------------------------------------
#Fit statistic : Chi-Squared =          50.31 using 59 PHA bins.
# Reduced chi-squared =         0.8827 for     57 degrees of freedom
# Null hypothesis probability =   7.222342e-01

Photon flux (15-150 keV)    in 1 sec: 29.7510 ( -0.592244  0.592174 ) ph/cm2/s
Energy fluence (15-150 keV)             : 2.7539e-06 ( -5.44951e-08  5.45206e-08 ) ergs/cm2
Cutoff power-law model
Time interval is from    1.968 sec. to    2.968 sec.
Spectral model in the cutoff power-law:
------------------------------------------------------------
Parameters  : value       lower 90%   higher 90%
Photon index: 0.792531     ( -0.142498   0.138167 )
Epeak [keV] : 303.282      ( -88.4962 297.505 )
Norm@50keV  : 0.325426    ( -0.0394226   0.046131 )
------------------------------------------------------------
#Fit statistic : Chi-Squared =          41.13 using 59 PHA bins.
# Reduced chi-squared =         0.7344 for     56 degrees of freedom
# Null hypothesis probability =   9.317289e-01

Photon flux (15-150 keV)    in 1 sec: 29.3669 ( -0.625  0.6262 ) ph/cm2/s
Energy fluence (15-150 keV)             : 2.73194e-06 ( 0  0 ) ergs/cm2
Band function
Time interval is from    1.968 sec. to    2.968 sec.

Spectral model in the Band function:
------------------------------------------------------------
Parameters  : value       lower 90%   higher 90%
alpha       : 4.99993   ( -7.29958e-07   -4.99993 )
beta        : -1.06559    ( -0.0364954   0.0364277 )
Epeak [keV] : 28.2306      ( -4.01501 2.62672 )
Norm@50keV   : 8592.69    ( -159.484   12720.9 )
------------------------------------------------------------
#Fit statistic : Chi-Squared =          41.37 using 59 PHA bins.
# Reduced chi-squared =         0.7521 for     55 degrees of freedom
# Null hypothesis probability =   9.132389e-01

Photon flux (15-150 keV)    in 1 sec:  (    ) ph/cm2/s
Energy fluence (15-150 keV)             : 0 ( 0  0 ) ergs/cm2
Single BB
Spectral model blackbody:
------------------------------------------------------------
Parameters  : value    Lower 90%  Upper 90%
kT [keV]    : 22.9353  (  )
R^2/D10^2   : 0.925573  (   )
(R is the radius in km and D10 is the distance to the source in units of 10 kpc)
------------------------------------------------------------
#Fit statistic : Chi-Squared =         451.76 using 59 PHA bins.
# Reduced chi-squared =         7.9256 for     57 degrees of freedom
# Null hypothesis probability =   8.527830e-63

Energy  Fluence     90% Error
[keV]   [erg/cm2]   [erg/cm2]
15- 25  8.836e-08   3.425e-09
25- 50  4.786e-07   1.340e-08
50-150  1.881e-06   5.450e-08
15-150  2.448e-06   5.500e-08
Thermal bremsstrahlung (OTTB)
Spectral model: thermal bremsstrahlung
------------------------------------------------------------
Parameters  : value         Lower 90%    Upper 90%
kT [keV]    : 199.363       (      )
Norm        : 125.622       (     )
------------------------------------------------------------
#Fit statistic : Chi-Squared =         705.57 using 59 PHA bins.
# Reduced chi-squared =         12.378 for     57 degrees of freedom
# Null hypothesis probability =  1.319270e-112

Energy  Fluence     90% Error
[keV]   [erg/cm2]   [erg/cm2]
15- 25  3.128e-07   6.350e-09
25- 50  6.017e-07   1.275e-08
50-150  1.320e-06   2.850e-08
15-150  2.234e-06   4.550e-08
Double BB
Spectral model: bbodyrad<1> + bbodyrad<2>
------------------------------------------------------------
Parameters  : value         Lower 90%    Upper 90%
kT1 [keV]   : 9.12613        (-0.85675      0.938044)
R1^2/D10^2  : 8.91828        (-2.17486      3.0958)
kT2 [keV]   : 36.3603        (-2.83359      3.76278)
R2^2/D10^2  : 0.185841    (-0.0500145   0.0564947)
------------------------------------------------------------
#Fit statistic : Chi-Squared =          43.04 using 59 PHA bins.
# Reduced chi-squared =         0.7826 for     55 degrees of freedom
# Null hypothesis probability =   8.790581e-01

Energy  Fluence     90% Error
[keV]   [erg/cm2]   [erg/cm2]
15- 25  1.795e-07   1.305e-08
25- 50  5.408e-07   2.220e-08
50-150  2.023e-06   9.200e-08
15-150  2.743e-06   1.065e-07
Pre-slew spectrum (Pre-slew PHA with pre-slew DRM)
Power-law model
Spectral model in power-law:
------------------------------------------------------------
Parameters  : value       lower 90%   higher 90%
Photon index: 1.33186     ( -0.0278653   0.0277956 )
Norm@50keV  : 7.61529E-02    ( -0.0011705   0.0011692 )
------------------------------------------------------------
#Fit statistic : Chi-Squared =          50.07 using 59 PHA bins.
# Reduced chi-squared =         0.8785 for     57 degrees of freedom
# Null hypothesis probability =   7.303239e-01

Photon flux (15-150 keV)    in 9.337 sec: 9.14072 ( -0.161423  0.161906 ) ph/cm2/s
Energy fluence (15-150 keV)             : 6.97333e-06 ( -1.04129e-07  1.04139e-07 ) ergs/cm2
Cutoff power-law model
Spectral model in the cutoff power-law:
------------------------------------------------------------
Parameters  : value       lower 90%   higher 90%
Photon index: 1.11008     ( -0.117184   0.114404 )
Epeak [keV] : 247.605      ( -63.6741 186.813 )
Norm@50keV  : 9.37817E-02    ( -0.00934594   0.0106075 )
------------------------------------------------------------
#Fit statistic : Chi-Squared =          38.97 using 59 PHA bins.
# Reduced chi-squared =         0.6959 for     56 degrees of freedom
# Null hypothesis probability =   9.594623e-01

Photon flux (15-150 keV)    in 9.337 sec: 8.97629 ( -0.17885  0.17983 ) ph/cm2/s
Energy fluence (15-150 keV)             : 6.91581e-06 ( -1.09094e-07  1.08944e-07 ) ergs/cm2
Band function
Spectral model in the Band function:
------------------------------------------------------------
Parameters  : value       lower 90%   higher 90%
alpha       : -0.808840   ( -0.433647   2.13294 )
beta        : -1.40764    ( 1.40848   0.0608549 )
Epeak [keV] : 104.809      ( -72.2867 275.324 )
Norm@50keV   : 0.139597    ( -0.051084   0.375508 )
------------------------------------------------------------
#Fit statistic : Chi-Squared =          38.68 using 59 PHA bins.
# Reduced chi-squared =         0.7033 for     55 degrees of freedom
# Null hypothesis probability =   9.533567e-01

Photon flux (15-150 keV)    in 9.337 sec:  (    ) ph/cm2/s
Energy fluence (15-150 keV)             : 0 ( 0  0 ) ergs/cm2
S(25-50 keV) vs. S(50-100 keV) plot
S(25-50 keV)  = 1.77e-06
S(50-100 keV) = 2.72e-06
T90 vs. Hardness ratio plot
T90                                   = 55.0799999237061 sec.
Hardness ratio (energy fluence ratio) = 1.53672
Color vs. Color plot
Count Ratio  (25-50 keV) / (15-25 keV) = 1.45937
Count Ratio (50-100 keV) / (15-25 keV) = 1.18417
Mask shadow pattern
IMX = 2.746303727687254E-01, IMY = 2.173074247403469E-02
TIME vs. PHA plot around the trigger time
Blue+Cyan dotted lines: Time interval of the scaled map
From 0.000000 to 0.064000
TIME vs. DetID plot around the trigger time
Blue+Cyan dotted lines: Time interval of the scaled map
From 0.000000 to 0.064000
100 us light curve (15-350 keV)
Blue+Cyan dotted lines: Time interval of the scaled map
From 0.000000 to 0.064000
Spacecraft aspect plot
Bright source in the pre-burst/pre-slew/post-slew images
Pre-burst image of 15-350 keV band
Time interval of the image:
-50.011400 -0.148000

# RAcent  DECcent POSerr Theta    Phi  PeakCts   SNR AngSep     Name
#  [deg]    [deg]    ['] [deg]  [deg]                   [']
244.9872 -15.5755    2.6  41.6  -67.6   1.2870   4.5    3.9	Sco X-1
254.4576  35.3437   19.0  38.5 -152.9   0.0646   0.6    0.1	Her X-1
208.0954  60.4102    2.5  45.1  148.3   0.9547   4.6 ------	UNKNOWN
224.5782  67.8308    3.0  52.3  158.2   1.5421   3.9 ------	UNKNOWN
237.0530  53.4750    2.4  40.7  172.7   0.5723   4.8 ------	UNKNOWN
256.2271   1.3584    2.9  41.0  -98.5   1.3440   3.9 ------	UNKNOWN
Pre-slew background subtracted image of 15-350 keV band
Time interval of the image:
-0.148000 9.188600

# RAcent  DECcent POSerr Theta    Phi  PeakCts   SNR AngSep     Name
#  [deg]    [deg]    ['] [deg]  [deg]                   [']
244.8841 -15.5391    5.0  41.5  -67.6   0.9791   2.3    8.2	Sco X-1
254.2463  35.3167   13.5  38.3 -152.9   0.1414   0.9   10.5	Her X-1
211.9146   1.3321    0.1  15.4   -4.5  11.1564 105.5 ------	UNKNOWN
249.7351  34.9077    2.4  34.7 -154.7   0.6704   4.9 ------	UNKNOWN
265.3639  46.1887    1.9  50.1 -163.1   1.5508   6.2 ------	UNKNOWN
265.6843  28.5107    2.4  46.2 -139.8   1.2238   4.7 ------	UNKNOWN
Post-slew image of 15-350 keV band
Time interval of the image:
45.788590 962.828000

# RAcent  DECcent POSerr Theta    Phi  PeakCts   SNR AngSep     Name
#  [deg]    [deg]    ['] [deg]  [deg]                   [']
244.9648 -15.6585    0.8  36.8  -85.4  25.8801  13.6    1.4	Sco X-1
254.5369  35.3626    6.9  52.2 -159.8  -2.7229  -1.7    4.1	Her X-1
170.6806 -16.0753    4.1  44.3   41.0   5.3926   2.8 ------	UNKNOWN
177.3928  -2.8125    2.7  34.7   59.0   5.0010   4.4 ------	UNKNOWN
214.9370  24.0713    3.0  22.9  163.0   2.1248   3.8 ------	UNKNOWN
234.0476  17.3489    2.2  27.0 -151.8   3.2529   5.2 ------	UNKNOWN
236.3371   8.2757    2.7  25.3 -130.9   2.6990   4.3 ------	UNKNOWN
251.0218   3.6946    3.3  39.2 -118.4   4.4133   3.5 ------	UNKNOWN
Plot creation:
Sat May 30 14:46:24 EDT 2015