Click here for the BAT GCN circular template
Image
Pre-slew 15.0-350.0 keV image (Event data)
#   RAcent    DECcent   POSerr    Theta     Phi              Peak Cts       SNR   Name
  325.1268    58.7486   0.0037    25.2363   147.7404         5.0542843     52.064 TRIG_00583338

Foreground time interval of the image:
-24.908  11.485 (delta_t =  36.393 [sec])
Background time interval of the image:
-239.016 -24.908 (delta_t = 214.108 [sec])
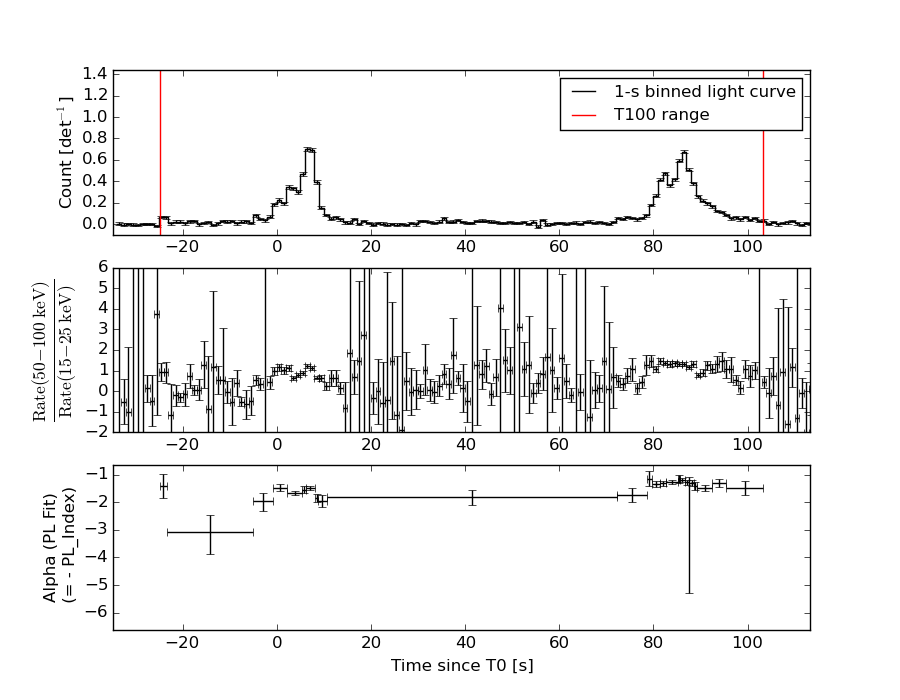
Lightcurves
Notes:
- 1) The mask-weighted light curves are using the flight position.
- 2) Multiple plots of different time binning/intervals are shown to cover all scenarios of short/long GRBs, rate/image triggers, and real/false positives.
- 3) For all the mask-weighted lightcurves, the y-axis units are counts/sec/det where a det is 0.4 x 0.4 = 0.16 sq cm.
- 4) The verticle lines correspond to following: green dotted lines are T50 interval, black dotted lines are T90 interval, blue solid line(s) is a spacecraft slew start time, and orange solid line(s) is a spacecraft slew end time.
- 5) Time of each bin is in the middle of the bin.
1 s binning
From T0-310 s to T0+310 s
From T100_start - 20 s to T100_end + 30 s

Full time interval
64 ms binning
Full time interval
From T100_start to T100_end
From T0-5 sec to T0+5 sec
16 ms binning
From T100_start-5 s to T100_start+5 s
Blue+Cyan dotted lines: Time interval of the scaled map
From 0.000000 to 0.512000
8 ms binning
From T100_start-3 s to T100_start+3 s
Blue+Cyan dotted lines: Time interval of the scaled map
From 0.000000 to 0.512000
2 ms binning
From T100_start-1 s to T100_start+1 s
Blue+Cyan dotted lines: Time interval of the scaled map
From 0.000000 to 0.512000
SN=5 or 10 sec. binning (whichever binning is satisfied first)
SN=5 or 10 sec. binning (T < 200 sec)
Quad-rate summed light curves (from T0-300s to T0+1000s)
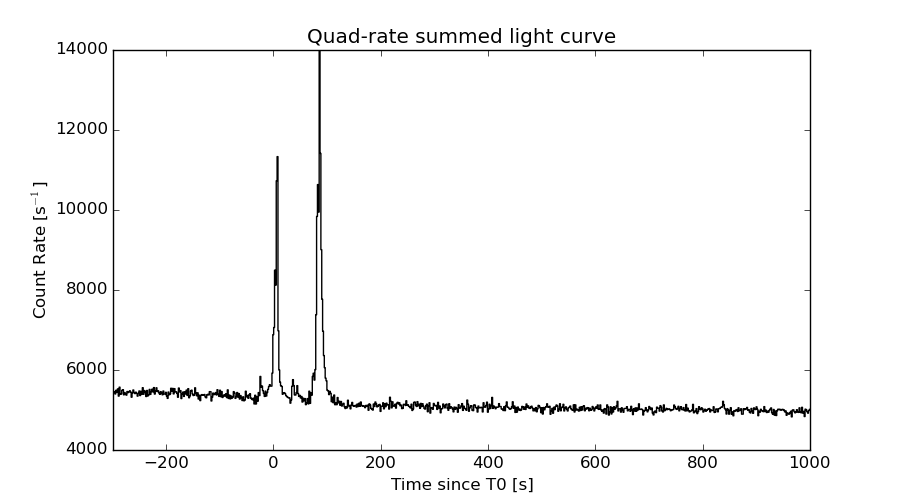
The mask-weighted light curves based on cleaned DPHs

Spectral Evolution
Spectra
Notes:
- 1) The fitting includes the systematic errors.
- 2) When the burst includes telescope slew time periods, the fitting uses an average response file made from multiple 5-s response files through out the slew time plus single time preiod for the non-slew times, and weighted by the total counts in the corresponding time period using addrmf. An average response file is needed becuase a spectral fit using the pre-slew DRM will introduce some errors in both a spectral shape and a normalization if the PHA file contains a lot of the slew/post-slew time interval.
- 3) For fits to more complicated models (e.g. a power-law over a cutoff power-law), the BAT team has decided to require a chi-square improvement of more than 6 for each extra dof.
Time averaged spectrum fit using the average DRM
Power-law model

Time interval is from  -24.908 sec. to  103.260 sec.

Spectral model in power-law:
------------------------------------------------------------
Parameters  : value       lower 90%   higher 90%
Photon index: 1.53369     ( -0.0467481   0.0467632 )
Norm@50keV  : 5.90363E-03    ( -0.00013878   0.000138778 )
------------------------------------------------------------
#Fit statistic : Chi-Squared =          44.70 using 59 PHA bins.
# Reduced chi-squared =         0.7842 for     57 degrees of freedom
# Null hypothesis probability =   8.816537e-01

Photon flux (15-150 keV)    in 128.2 sec: 0.743885 ( -0.0198577  0.0199706 ) ph/cm2/s
Energy fluence (15-150 keV)             : 7.14203e-06 ( -1.75944e-07  1.76284e-07 ) ergs/cm2
Cutoff power-law model

Time interval is from  -24.908 sec. to  103.260 sec.
Spectral model in the cutoff power-law:
------------------------------------------------------------
Parameters  : value       lower 90%   higher 90%
Photon index: 1.53163     ( -0.112772   0.0467445 )
Epeak [keV] : 9999.36      ( -9999.36 -9999.36 )
Norm@50keV  : 5.91954E-03    ( -0.000138937   0.00116036 )
------------------------------------------------------------
#Fit statistic : Chi-Squared =          44.70 using 59 PHA bins.
# Reduced chi-squared =         0.7983 for     56 degrees of freedom
# Null hypothesis probability =   8.609846e-01

Photon flux (15-150 keV)    in 128.2 sec: 0.743772 ( -0.021749  0.019423 ) ph/cm2/s
Energy fluence (15-150 keV)             : 7.14256e-06 ( -1.67737e-07  1.74839e-07 ) ergs/cm2
Band function
Time interval is from  -24.908 sec. to  103.260 sec.

Spectral model in the Band function:
------------------------------------------------------------
Parameters  : value       lower 90%   higher 90%
alpha       : -1.28020   ( 1.23007   1.23007 )
beta        : -1.55675    ( 1.55606   0.0649008 )
Epeak [keV] : 106.316      ( -99.7531 -99.7531 )
Norm@50keV   : 8.28910E-03    ( -0.00241702   0 )
------------------------------------------------------------
#Fit statistic : Chi-Squared =          44.21 using 59 PHA bins.
# Reduced chi-squared =         0.8037 for     55 degrees of freedom
# Null hypothesis probability =   8.510208e-01

Photon flux (15-150 keV)    in 128.2 sec:  (    ) ph/cm2/s
Energy fluence (15-150 keV)             : 0 ( 0  0 ) ergs/cm2
Single BB
Spectral model blackbody:
------------------------------------------------------------
Parameters  : value    Lower 90%  Upper 90%
kT [keV]    : 16.4986  (  )
R^2/D10^2   : 5.66580E-02  (   )
(R is the radius in km and D10 is the distance to the source in units of 10 kpc)
------------------------------------------------------------
#Fit statistic : Chi-Squared =         451.73 using 59 PHA bins.
# Reduced chi-squared =         7.9252 for     57 degrees of freedom
# Null hypothesis probability =   8.622864e-63

Energy  Fluence     90% Error
[keV]   [erg/cm2]   [erg/cm2]
15- 25  4.059e-07   2.026e-08
25- 50  1.752e-06   5.897e-08
50-150  3.372e-06   1.577e-07
15-150  5.530e-06   1.532e-07
Thermal bremsstrahlung (OTTB)
Spectral model: thermal bremsstrahlung
------------------------------------------------------------
Parameters  : value         Lower 90%    Upper 90%
kT [keV]    : 200.000       (      )
Norm        : 3.02015       (-0.0710736     0.0710722)
------------------------------------------------------------
#Fit statistic : Chi-Squared =          57.02 using 59 PHA bins.
# Reduced chi-squared =          1.000 for     57 degrees of freedom
# Null hypothesis probability =   4.744753e-01

Energy  Fluence     90% Error
[keV]   [erg/cm2]   [erg/cm2]
15- 25  9.644e-07   2.654e-08
25- 50  1.855e-06   5.000e-08
50-150  4.069e-06   1.045e-07
15-150  6.888e-06   1.929e-07
Double BB
Spectral model: bbodyrad<1> + bbodyrad<2>
------------------------------------------------------------
Parameters  : value         Lower 90%    Upper 90%
kT1 [keV]   : 7.83797        (-0.670125      0.705557)
R1^2/D10^2  : 0.530529        (-0.1327      0.193164)
kT2 [keV]   : 30.9554        (-3.03226      4.02135)
R2^2/D10^2  : 5.15227E-03    (-0.0017299   0.00223372)
------------------------------------------------------------
#Fit statistic : Chi-Squared =          56.70 using 59 PHA bins.
# Reduced chi-squared =          1.031 for     55 degrees of freedom
# Null hypothesis probability =   4.113139e-01

Energy  Fluence     90% Error
[keV]   [erg/cm2]   [erg/cm2]
15- 25  8.410e-07   6.634e-08
25- 50  1.863e-06   8.269e-08
50-150  4.362e-06   3.590e-07
15-150  7.066e-06   4.000e-07
Peak spectrum fit
Power-law model
Time interval is from    6.488 sec. to    7.488 sec.

Spectral model in power-law:
------------------------------------------------------------
Parameters  : value       lower 90%   higher 90%
Photon index: 1.42447     ( -0.0844175   0.0848293 )
Norm@50keV  : 4.95578E-02    ( -0.00242502   0.00242142 )
------------------------------------------------------------
#Fit statistic : Chi-Squared =          59.19 using 59 PHA bins.
# Reduced chi-squared =          1.038 for     57 degrees of freedom
# Null hypothesis probability =   3.954461e-01

Photon flux (15-150 keV)    in 1 sec: 6.06958 ( -0.300102  0.300401 ) ph/cm2/s
Energy fluence (15-150 keV)             : 4.7653e-07 ( -2.57998e-08  2.59065e-08 ) ergs/cm2
Cutoff power-law model
Time interval is from    6.488 sec. to    7.488 sec.
Spectral model in the cutoff power-law:
------------------------------------------------------------
Parameters  : value       lower 90%   higher 90%
Photon index: 1.09255     ( -0.338587   0.314424 )
Epeak [keV] : 143.011      ( -47.5717 943.54 )
Norm@50keV  : 7.19274E-02    ( -0.0208709   0.0320526 )
------------------------------------------------------------
#Fit statistic : Chi-Squared =          55.91 using 59 PHA bins.
# Reduced chi-squared =         0.9983 for     56 degrees of freedom
# Null hypothesis probability =   4.783473e-01

Photon flux (15-150 keV)    in 1 sec: 5.97669 ( -0.31219  0.31218 ) ph/cm2/s
Energy fluence (15-150 keV)             : 4.66754e-07 ( -2.78e-08  2.7708e-08 ) ergs/cm2
Band function

Time interval is from    6.488 sec. to    7.488 sec.

Spectral model in the Band function:
------------------------------------------------------------
Parameters  : value       lower 90%   higher 90%
alpha       : -1.09259   ( -0.304868   0.351516 )
beta        : -10.0000    ( 10   0 )
Epeak [keV] : 143.002      ( -39.9743 929.476 )
Norm@50keV   : 7.19165E-02    ( -0.0208504   0.0320634 )
------------------------------------------------------------
#Fit statistic : Chi-Squared =          55.91 using 59 PHA bins.
# Reduced chi-squared =          1.016 for     55 degrees of freedom
# Null hypothesis probability =   4.405519e-01

Photon flux (15-150 keV)    in 1 sec: 5.98653 (    ) ph/cm2/s
Energy fluence (15-150 keV)             : 0 ( 0  0 ) ergs/cm2
Single BB
Spectral model blackbody:
------------------------------------------------------------
Parameters  : value    Lower 90%  Upper 90%
kT [keV]    : 16.4325  (  )
R^2/D10^2   : 0.508741  (   )
(R is the radius in km and D10 is the distance to the source in units of 10 kpc)
------------------------------------------------------------
#Fit statistic : Chi-Squared =         147.91 using 59 PHA bins.
# Reduced chi-squared =         2.5949 for     57 degrees of freedom
# Null hypothesis probability =   5.208886e-10

Energy  Fluence     90% Error
[keV]   [erg/cm2]   [erg/cm2]
15- 25  2.823e-08   2.670e-09
25- 50  1.215e-07   8.750e-09
50-150  2.316e-07   2.030e-08
15-150  3.813e-07   2.200e-08
Thermal bremsstrahlung (OTTB)
Spectral model: thermal bremsstrahlung
------------------------------------------------------------
Parameters  : value         Lower 90%    Upper 90%
kT [keV]    : 200.000       (      )
Norm        : 24.8861       (-1.21384     1.21388)
------------------------------------------------------------
#Fit statistic : Chi-Squared =          63.24 using 59 PHA bins.
# Reduced chi-squared =          1.109 for     57 degrees of freedom
# Null hypothesis probability =   2.656365e-01

Energy  Fluence     90% Error
[keV]   [erg/cm2]   [erg/cm2]
15- 25  6.231e-08   3.415e-09
25- 50  1.199e-07   6.400e-09
50-150  2.629e-07   1.605e-08
15-150  4.451e-07   4.860e-08
Double BB
Spectral model: bbodyrad<1> + bbodyrad<2>
------------------------------------------------------------
Parameters  : value         Lower 90%    Upper 90%
kT1 [keV]   : 6.61073        (-1.00902      1.18351)
R1^2/D10^2  : 6.96879        (-2.98189      5.70005)
kT2 [keV]   : 25.8160        (-3.11577      4.39487)
R2^2/D10^2  : 8.95140E-02    (-0.0384037   0.0534395)
------------------------------------------------------------
#Fit statistic : Chi-Squared =          52.47 using 59 PHA bins.
# Reduced chi-squared =         0.9539 for     55 degrees of freedom
# Null hypothesis probability =   5.720537e-01

Energy  Fluence     90% Error
[keV]   [erg/cm2]   [erg/cm2]
15- 25  5.611e-08   9.965e-09
25- 50  1.149e-07   1.533e-08
50-150  2.962e-07   4.555e-08
15-150  4.672e-07   7.240e-08
Pre-slew spectrum (Pre-slew PHA with pre-slew DRM)
Power-law model

Spectral model in power-law:
------------------------------------------------------------
Parameters  : value       lower 90%   higher 90%
Photon index: 1.71161     ( -0.0650569   0.0654396 )
Norm@50keV  : 8.34967E-03    ( -0.000286824   0.000285861 )
------------------------------------------------------------
#Fit statistic : Chi-Squared =          37.49 using 59 PHA bins.
# Reduced chi-squared =         0.6577 for     57 degrees of freedom
# Null hypothesis probability =   9.786576e-01

Photon flux (15-150 keV)    in 36.39 sec: 1.11346 ( -0.0403387  0.0405399 ) ph/cm2/s
Energy fluence (15-150 keV)             : 2.81075e-06 ( -1.00372e-07  1.00795e-07 ) ergs/cm2
Cutoff power-law model

Spectral model in the cutoff power-law:
------------------------------------------------------------
Parameters  : value       lower 90%   higher 90%
Photon index: 1.60689     ( -0.258051   0.144712 )
Epeak [keV] : 191.519      (   )
Norm@50keV  : 9.39429E-03    (     )
------------------------------------------------------------
#Fit statistic : Chi-Squared =          36.97 using 59 PHA bins.
# Reduced chi-squared =         0.6601 for     56 degrees of freedom
# Null hypothesis probability =   9.767422e-01

Photon flux (15-150 keV)    in 36.39 sec: 1.10451 ( -0.04502  0.04503 ) ph/cm2/s
Energy fluence (15-150 keV)             : 2.78714e-06 ( -1.16179e-07  1.14891e-07 ) ergs/cm2
Band function
Spectral model in the Band function:
------------------------------------------------------------
Parameters  : value       lower 90%   higher 90%
alpha       : -1.06142   ( 1.17392   1.17392 )
beta        : -1.73859    ( 1.73919   0.0827438 )
Epeak [keV] : 43.0028      ( -42.857 179.34 )
Norm@50keV   : 2.28310E-02    ( -0.0231652   1.48159e+06 )
------------------------------------------------------------
#Fit statistic : Chi-Squared =          36.71 using 59 PHA bins.
# Reduced chi-squared =         0.6675 for     55 degrees of freedom
# Null hypothesis probability =   9.725804e-01

Photon flux (15-150 keV)    in 36.39 sec:  (    ) ph/cm2/s
Energy fluence (15-150 keV)             : 0 ( 0  0 ) ergs/cm2
S(25-50 keV) vs. S(50-100 keV) plot
S(25-50 keV)  = 1.80e-06
S(50-100 keV) = 2.48e-06
T90 vs. Hardness ratio plot
T90                                   = 95.2319999337196 sec.
Hardness ratio (energy fluence ratio) = 1.37778
Color vs. Color plot
Count Ratio  (25-50 keV) / (15-25 keV) = 1.29794
Count Ratio (50-100 keV) / (15-25 keV) = 0.946918
Mask shadow pattern
IMX = -3.985814177049650E-01, IMY = -2.515799622929416E-01
TIME vs. PHA plot around the trigger time
Blue+Cyan dotted lines: Time interval of the scaled map
From 0.000000 to 0.512000
TIME vs. DetID plot around the trigger time
Blue+Cyan dotted lines: Time interval of the scaled map
From 0.000000 to 0.512000
100 us light curve (15-350 keV)
Blue+Cyan dotted lines: Time interval of the scaled map
From 0.000000 to 0.512000
Spacecraft aspect plot

Bright source in the pre-burst/pre-slew/post-slew images
Pre-burst image of 15-350 keV band
Time interval of the image:
-239.016000 -24.908000

# RAcent  DECcent POSerr Theta    Phi  PeakCts   SNR AngSep     Name
#  [deg]    [deg]    ['] [deg]  [deg]                   [']
254.2142  35.4018    4.8  26.0  -15.6  -0.4875  -2.4   12.4	Her X-1
288.8078  10.9377    3.0  38.5  -91.7   2.6302   3.8    0.7	GRS 1915+105
299.5913  35.1964    0.7  18.0 -128.7   3.1827  16.1    0.3	Cyg X-1
308.0871  40.9398    4.7  18.6 -157.0   0.4748   2.5    1.3	Cyg X-3
326.0465  38.2240    4.5  31.6 -170.2   0.5725   2.6    8.3	Cyg X-2
220.8443  56.5081    2.7  37.6   41.1   1.5394   4.3 ------	UNKNOWN
Pre-slew background subtracted image of 15-350 keV band
Time interval of the image:
-24.908000 11.484610

# RAcent  DECcent POSerr Theta    Phi  PeakCts   SNR AngSep     Name
#  [deg]    [deg]    ['] [deg]  [deg]                   [']
254.5480  35.5246    0.0  25.7  -15.8  -0.1134  -1.2   11.8	Her X-1
288.7110  11.0357    6.5  38.4  -91.6   0.5136   1.8    7.5	GRS 1915+105
299.7138  35.1949    5.2  18.0 -129.0  -0.2066  -2.2    6.1	Cyg X-1
308.2616  40.7852    0.0  18.8 -156.9   0.0778   0.9   12.2	Cyg X-3
326.2613  38.1970    5.7  31.7 -170.4  -0.2006  -2.0    8.6	Cyg X-2
258.3709  79.6485    2.7  31.7   86.6   0.7505   4.2 ------	UNKNOWN
339.9524  73.3200    2.1  33.7  120.5   0.9984   5.6 ------	UNKNOWN
329.4897  61.5703    2.2  27.6  141.8   0.5645   5.2 ------	UNKNOWN
325.1267  58.7486    0.2  25.2  147.7   5.0543  52.1 ------	UNKNOWN
294.7614  23.6089    2.6  26.9 -106.1   0.5201   4.4 ------	UNKNOWN
345.3646  15.8777    2.2  59.2 -163.0   2.8389   5.2 ------	UNKNOWN
295.5401  19.1554    2.3  31.4 -105.2   0.6776   5.0 ------	UNKNOWN
235.8431   6.6854    2.6  58.9  -24.3   2.5055   4.5 ------	UNKNOWN
270.8260   7.3526    3.1  43.5  -65.0   1.4038   3.7 ------	UNKNOWN
282.8623   8.1908    2.3  41.1  -82.4   1.8224   5.0 ------	UNKNOWN
Post-slew image of 15-350 keV band
Time interval of the image:
57.684600 963.074000

# RAcent  DECcent POSerr Theta    Phi  PeakCts   SNR AngSep     Name
#  [deg]    [deg]    ['] [deg]  [deg]                   [']
254.6449  35.3596    5.3  50.5  -27.2  -2.7598  -2.2    9.2	Her X-1
299.5711  35.2087    0.6  28.9  -75.4  14.2155  18.8    1.0	Cyg X-1
308.1232  40.9418    1.5  20.8  -83.7   5.1667   8.0    0.9	Cyg X-3
326.1208  38.4087    3.4  20.4 -124.4   2.0054   3.4    5.7	Cyg X-2
 20.2762  62.0705    2.7  26.6  117.0   2.9145   4.2 ------	UNKNOWN
325.1374  58.7317    0.7   0.0 -117.7   7.9286  16.2 ------	UNKNOWN
256.4141  56.9106    2.4  35.0   -4.7   3.4044   4.7 ------	UNKNOWN
306.8691  59.1682    2.5   9.4  -21.9   2.3956   4.6 ------	UNKNOWN
318.6966  15.7663    3.0  43.3 -113.1   9.6392   3.9 ------	UNKNOWN
Plot creation:
Sat May 30 14:42:51 EDT 2015