Click here for the BAT GCN circular template
Image
Pre-slew 15.0-350.0 keV image (Event data)
# RAcent DECcent POSerr Theta Phi Peak Cts SNR Name
330.9949 -17.9366 0.0111 36.2914 -127.0703 4.4604631 17.294 TRIG_00584136
Foreground time interval of the image:
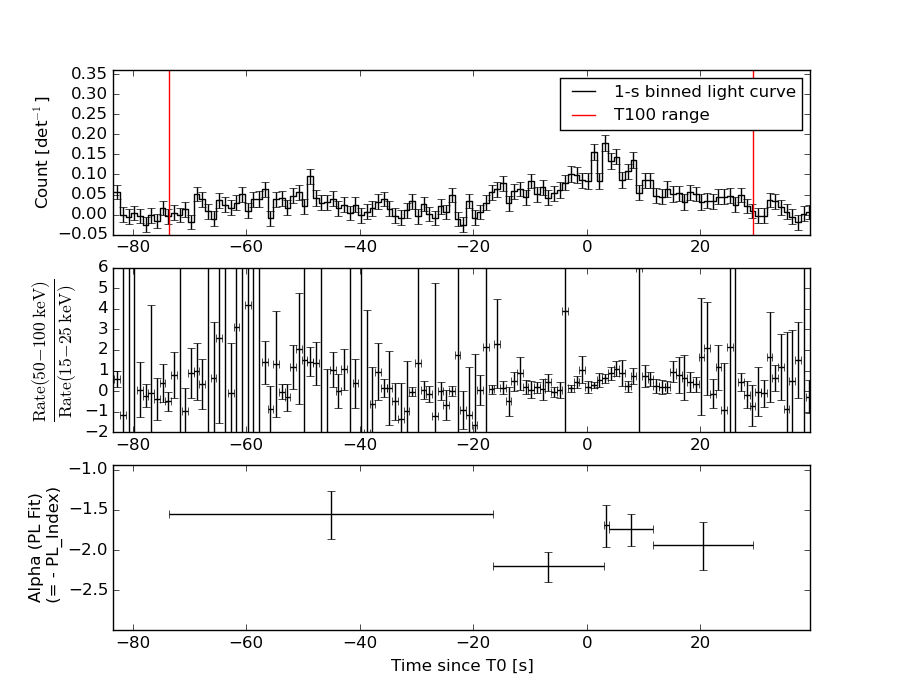
-73.608 29.368 (delta_t = 102.976 [sec])
Background time interval of the image:
-239.272 -73.608 (delta_t = 165.664 [sec])
Lightcurves
Notes:
- 1) The mask-weighted light curves are using the flight position.
- 2) Multiple plots of different time binning/intervals are shown to cover all scenarios of short/long GRBs, rate/image triggers, and real/false positives.
- 3) For all the mask-weighted lightcurves, the y-axis units are counts/sec/det where a det is 0.4 x 0.4 = 0.16 sq cm.
- 4) The verticle lines correspond to following: green dotted lines are T50 interval, black dotted lines are T90 interval, blue solid line(s) is a spacecraft slew start time, and orange solid line(s) is a spacecraft slew end time.
- 5) Time of each bin is in the middle of the bin.
1 s binning
From T0-310 s to T0+310 s
From T100_start - 20 s to T100_end + 30 s
Full time interval
64 ms binning
Full time interval
From T100_start to T100_end
From T0-5 sec to T0+5 sec
16 ms binning
From T100_start-5 s to T100_start+5 s
Blue+Cyan dotted lines: Time interval of the scaled map
From 0.000000 to 4.096000
8 ms binning
From T100_start-3 s to T100_start+3 s
Blue+Cyan dotted lines: Time interval of the scaled map
From 0.000000 to 4.096000
2 ms binning
From T100_start-1 s to T100_start+1 s
Blue+Cyan dotted lines: Time interval of the scaled map
From 0.000000 to 4.096000
SN=5 or 10 sec. binning (whichever binning is satisfied first)
SN=5 or 10 sec. binning (T < 200 sec)
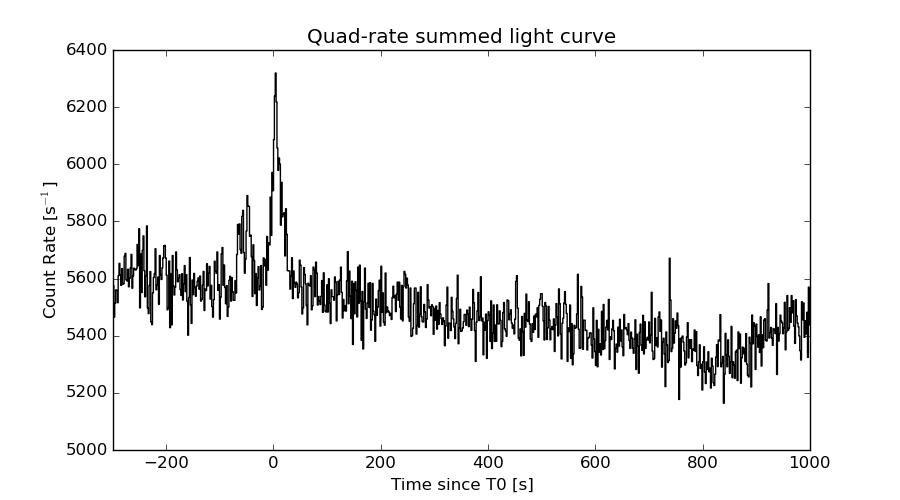
Quad-rate summed light curves (from T0-300s to T0+1000s)
Spectral Evolution
Spectra
Notes:
- 1) The fitting includes the systematic errors.
- 2) When the burst includes telescope slew time periods, the fitting uses an average response file made from multiple 5-s response files through out the slew time plus single time preiod for the non-slew times, and weighted by the total counts in the corresponding time period using addrmf. An average response file is needed becuase a spectral fit using the pre-slew DRM will introduce some errors in both a spectral shape and a normalization if the PHA file contains a lot of the slew/post-slew time interval.
- 3) For fits to more complicated models (e.g. a power-law over a cutoff power-law), the BAT team has decided to require a chi-square improvement of more than 6 for each extra dof.
Time averaged spectrum fit using the average DRM
Power-law model
Time interval is from  -73.608 sec. to   29.368 sec.

Spectral model in power-law:
------------------------------------------------------------
Parameters  : value       lower 90%   higher 90%
Photon index: 1.87224     ( -0.130094   0.13364 )
Norm@50keV  : 2.70762E-03    ( -0.000221524   0.000218658 )
------------------------------------------------------------
#Fit statistic : Chi-Squared =          56.99 using 59 PHA bins.
# Reduced chi-squared =         0.9999 for     57 degrees of freedom
# Null hypothesis probability =   4.752809e-01

Photon flux (15-150 keV)    in 103 sec: 0.384073 ( -0.0276303  0.0276623 ) ph/cm2/s
Energy fluence (15-150 keV)             : 2.5638e-06 ( -2.07764e-07  2.09964e-07 ) ergs/cm2
Cutoff power-law model
Time interval is from  -73.608 sec. to   29.368 sec.
Spectral model in the cutoff power-law:
------------------------------------------------------------
Parameters  : value       lower 90%   higher 90%
Photon index: 1.35692     ( -0.634233   0.545553 )
Epeak [keV] : 55.5954      ( -13.0827 -55.5964 )
Norm@50keV  : 5.19562E-03    ( -0.00253821   0.0063275 )
------------------------------------------------------------
#Fit statistic : Chi-Squared =          54.44 using 59 PHA bins.
# Reduced chi-squared =         0.9721 for     56 degrees of freedom
# Null hypothesis probability =   5.342788e-01

Photon flux (15-150 keV)    in 103 sec: 0.374561 ( -0.029447  0.029366 ) ph/cm2/s
Energy fluence (15-150 keV)             : 2.43974e-06 ( -2.43131e-07  2.47025e-07 ) ergs/cm2
Band function

Time interval is from  -73.608 sec. to   29.368 sec.

Spectral model in the Band function:
------------------------------------------------------------
Parameters  : value       lower 90%   higher 90%
alpha       : -1.13877   ( -0.680379   5.20481 )
beta        : -2.26717    ( 2.25544   0.406421 )
Epeak [keV] : 48.8956      ( -22.8016 93.025 )
Norm@50keV   : 7.07363E-03    ( -0.00233735   2.92065 )
------------------------------------------------------------
#Fit statistic : Chi-Squared =          53.75 using 59 PHA bins.
# Reduced chi-squared =         0.9772 for     55 degrees of freedom
# Null hypothesis probability =   5.226203e-01

Photon flux (15-150 keV)    in 103 sec:  (    ) ph/cm2/s
Energy fluence (15-150 keV)             : 2.44867e-06 ( -2.44795e-06  -2.33388e-07 ) ergs/cm2
Single BB
Spectral model blackbody:
------------------------------------------------------------
Parameters  : value    Lower 90%  Upper 90%
kT [keV]    : 11.2598  (-0.918922  1.00748)
R^2/D10^2   : 0.114062  (-0.0316364   0.0434231)
(R is the radius in km and D10 is the distance to the source in units of 10 kpc)
------------------------------------------------------------
#Fit statistic : Chi-Squared =          88.73 using 59 PHA bins.
# Reduced chi-squared =          1.557 for     57 degrees of freedom
# Null hypothesis probability =   4.520814e-03

Energy  Fluence     90% Error
[keV]   [erg/cm2]   [erg/cm2]
15- 25  3.126e-07   4.182e-08
25- 50  9.104e-07   8.111e-08
50-150  6.636e-07   1.197e-07
15-150  1.887e-06   1.643e-07
Thermal bremsstrahlung (OTTB)
Spectral model: thermal bremsstrahlung
------------------------------------------------------------
Parameters  : value         Lower 90%    Upper 90%
kT [keV]    : 86.1936       (-18.9275      28.67)
Norm        : 1.75475       (-0.185042     0.213692)
------------------------------------------------------------
#Fit statistic : Chi-Squared =          54.42 using 59 PHA bins.
# Reduced chi-squared =         0.9548 for     57 degrees of freedom
# Null hypothesis probability =   5.723434e-01

Energy  Fluence     90% Error
[keV]   [erg/cm2]   [erg/cm2]
15- 25  4.709e-07   5.371e-08
25- 50  7.887e-07   6.633e-08
50-150  1.169e-06   4.104e-07
15-150  2.429e-06   4.233e-07
Double BB
Spectral model: bbodyrad<1> + bbodyrad<2>
------------------------------------------------------------
Parameters  : value         Lower 90%    Upper 90%
kT1 [keV]   : 6.13565        (-1.93027      2.41781)
R1^2/D10^2  : 0.708224        (-0.437693      2.04596)
kT2 [keV]   : 19.2452        (-4.8708      16.8392)
R2^2/D10^2  : 1.08854E-02    (-0.00930927   0.0255335)
------------------------------------------------------------
#Fit statistic : Chi-Squared =          57.55 using 59 PHA bins.
# Reduced chi-squared =          1.046 for     55 degrees of freedom
# Null hypothesis probability =   3.809910e-01

Energy  Fluence     90% Error
[keV]   [erg/cm2]   [erg/cm2]
15- 25  4.578e-07   1.959e-07
25- 50  7.884e-07   2.669e-07
50-150  1.115e-06   5.748e-07
15-150  2.361e-06   8.110e-07
Peak spectrum fit
Power-law model
Time interval is from    2.984 sec. to    3.984 sec.

Spectral model in power-law:
------------------------------------------------------------
Parameters  : value       lower 90%   higher 90%
Photon index: 1.71658     ( -0.255243   0.267213 )
Norm@50keV  : 1.44921E-02    ( -0.00236442   0.00230367 )
------------------------------------------------------------
#Fit statistic : Chi-Squared =          54.14 using 59 PHA bins.
# Reduced chi-squared =         0.9498 for     57 degrees of freedom
# Null hypothesis probability =   5.831314e-01

Photon flux (15-150 keV)    in 1 sec: 1.93599 ( -0.284335  0.284551 ) ph/cm2/s
Energy fluence (15-150 keV)             : 1.34012e-07 ( -2.25287e-08  2.28345e-08 ) ergs/cm2
Cutoff power-law model

Time interval is from    2.984 sec. to    3.984 sec.
Spectral model in the cutoff power-law:
------------------------------------------------------------
Parameters  : value       lower 90%   higher 90%
Photon index: 1.72154     ( -0.404692   0.26467 )
Epeak [keV] : 9999.36      ( -9999.35 -9999.36 )
Norm@50keV  : 1.44726E-02    ( -0.00236492   0.0279414 )
------------------------------------------------------------
#Fit statistic : Chi-Squared =          54.14 using 59 PHA bins.
# Reduced chi-squared =         0.9668 for     56 degrees of freedom
# Null hypothesis probability =   5.455747e-01

Photon flux (15-150 keV)    in 1 sec: 1.93629 ( -0.28453  0.28359 ) ph/cm2/s
Energy fluence (15-150 keV)             : 1.33544e-07 ( -2.3466e-08  2.32e-08 ) ergs/cm2
Band function

Time interval is from    2.984 sec. to    3.984 sec.

Spectral model in the Band function:
------------------------------------------------------------
Parameters  : value       lower 90%   higher 90%
alpha       : 3.29617   ( -0.912606   -0.912606 )
beta        : -1.73312    ( 1.73054   0.265895 )
Epeak [keV] : 19.1117      ( -20.9792 348.293 )
Norm@50keV   : 362.742    ( -362.917   2.78096e+06 )
------------------------------------------------------------
#Fit statistic : Chi-Squared =          54.07 using 59 PHA bins.
# Reduced chi-squared =         0.9831 for     55 degrees of freedom
# Null hypothesis probability =   5.101050e-01

Photon flux (15-150 keV)    in 1 sec: 1.93213 (    ) ph/cm2/s
Energy fluence (15-150 keV)             : 0 ( 0  0 ) ergs/cm2
Single BB
Spectral model blackbody:
------------------------------------------------------------
Parameters  : value    Lower 90%  Upper 90%
kT [keV]    : 13.3853  (-2.87245  3.40686)
R^2/D10^2   : 0.309960  (-0.308089   0.427672)
(R is the radius in km and D10 is the distance to the source in units of 10 kpc)
------------------------------------------------------------
#Fit statistic : Chi-Squared =          73.15 using 59 PHA bins.
# Reduced chi-squared =          1.283 for     57 degrees of freedom
# Null hypothesis probability =   7.340693e-02

Energy  Fluence     90% Error
[keV]   [erg/cm2]   [erg/cm2]
15- 25  1.177e-08   3.820e-09
25- 50  4.181e-08   9.370e-09
50-150  4.815e-08   1.646e-08
15-150  1.017e-07   2.298e-08
Thermal bremsstrahlung (OTTB)
Spectral model: thermal bremsstrahlung
------------------------------------------------------------
Parameters  : value         Lower 90%    Upper 90%
kT [keV]    : 142.906       (-66.3117      -140.986)
Norm        : 7.97253       (-1.29423     1.80825)
------------------------------------------------------------
#Fit statistic : Chi-Squared =          54.93 using 59 PHA bins.
# Reduced chi-squared =         0.9637 for     57 degrees of freedom
# Null hypothesis probability =   5.530936e-01

Energy  Fluence     90% Error
[keV]   [erg/cm2]   [erg/cm2]
15- 25  2.056e-08   1.139e-08
25- 50  3.783e-08   2.056e-08
50-150  7.316e-08   4.458e-08
15-150  1.316e-07   7.620e-08
Double BB
Spectral model: bbodyrad<1> + bbodyrad<2>
------------------------------------------------------------
Parameters  : value         Lower 90%    Upper 90%
kT1 [keV]   : 5.29686        (-1.67828      2.21227)
R1^2/D10^2  : 6.83213        (-5.01719      27.7861)
kT2 [keV]   : 23.6722        (-6.46656      13.9352)
R2^2/D10^2  : 3.27874E-02    (-0.0260035   0.0431254)
------------------------------------------------------------
#Fit statistic : Chi-Squared =          53.18 using 59 PHA bins.
# Reduced chi-squared =         0.9668 for     55 degrees of freedom
# Null hypothesis probability =   5.446520e-01

Energy  Fluence     90% Error
[keV]   [erg/cm2]   [erg/cm2]
15- 25  2.410e-08   1.337e-08
25- 50  3.373e-08   1.516e-08
50-150  7.647e-08   4.423e-08
15-150  1.343e-07   6.493e-08
Pre-slew spectrum (Pre-slew PHA with pre-slew DRM)
Power-law model

Spectral model in power-law:
------------------------------------------------------------
Parameters  : value       lower 90%   higher 90%
Photon index: 1.87224     ( -0.130094   0.13364 )
Norm@50keV  : 2.70762E-03    ( -0.000221524   0.000218658 )
------------------------------------------------------------
#Fit statistic : Chi-Squared =          56.99 using 59 PHA bins.
# Reduced chi-squared =         0.9999 for     57 degrees of freedom
# Null hypothesis probability =   4.752809e-01

Photon flux (15-150 keV)    in 103 sec: 0.384073 ( -0.0276303  0.0276623 ) ph/cm2/s
Energy fluence (15-150 keV)             : 2.5638e-06 ( -2.07764e-07  2.09964e-07 ) ergs/cm2
Cutoff power-law model
Spectral model in the cutoff power-law:
------------------------------------------------------------
Parameters  : value       lower 90%   higher 90%
Photon index: 1.35692     ( -0.634233   0.545553 )
Epeak [keV] : 55.5954      ( -13.0827 -55.5964 )
Norm@50keV  : 5.19562E-03    ( -0.00253821   0.0063275 )
------------------------------------------------------------
#Fit statistic : Chi-Squared =          54.44 using 59 PHA bins.
# Reduced chi-squared =         0.9721 for     56 degrees of freedom
# Null hypothesis probability =   5.342788e-01

Photon flux (15-150 keV)    in 103 sec: 0.374561 ( -0.029447  0.029366 ) ph/cm2/s
Energy fluence (15-150 keV)             : 2.43974e-06 ( -2.43131e-07  2.47025e-07 ) ergs/cm2
Band function

Spectral model in the Band function:
------------------------------------------------------------
Parameters  : value       lower 90%   higher 90%
alpha       : -1.13877   ( -0.9122   5.20714 )
beta        : -2.26717    ( 2.25544   0.406421 )
Epeak [keV] : 48.8956      ( -22.8016 91.8751 )
Norm@50keV   : 7.07363E-03    ( -0.00233735   2.90197 )
------------------------------------------------------------
#Fit statistic : Chi-Squared =          53.75 using 59 PHA bins.
# Reduced chi-squared =         0.9772 for     55 degrees of freedom
# Null hypothesis probability =   5.226203e-01

Photon flux (15-150 keV)    in 103 sec:  (    ) ph/cm2/s
Energy fluence (15-150 keV)             : 2.44867e-06 ( -2.44795e-06  -2.33388e-07 ) ergs/cm2
S(25-50 keV) vs. S(50-100 keV) plot
S(25-50 keV)  = 7.41e-07
S(50-100 keV) = 8.10e-07
T90 vs. Hardness ratio plot
T90                                   = 84.0919999480247 sec.
Hardness ratio (energy fluence ratio) = 1.09312
Color vs. Color plot
Count Ratio  (25-50 keV) / (15-25 keV) = 1.24477
Count Ratio (50-100 keV) / (15-25 keV) = 0.68935
Mask shadow pattern
IMX = -4.426582386676653E-01, IMY = 5.859297902425955E-01
TIME vs. PHA plot around the trigger time
Blue+Cyan dotted lines: Time interval of the scaled map
From 0.000000 to 4.096000
TIME vs. DetID plot around the trigger time
Blue+Cyan dotted lines: Time interval of the scaled map
From 0.000000 to 4.096000
100 us light curve (15-350 keV)
Blue+Cyan dotted lines: Time interval of the scaled map
From 0.000000 to 4.096000
Spacecraft aspect plot
Bright source in the pre-burst/pre-slew/post-slew images
Pre-burst image of 15-350 keV band
Time interval of the image:
-239.272000 -73.608000

# RAcent  DECcent POSerr Theta    Phi  PeakCts   SNR AngSep     Name
#  [deg]    [deg]    ['] [deg]  [deg]                   [']
299.4921  35.2083    2.9  43.5  -22.9   1.1002   4.0    4.8	Cyg X-1
308.0820  41.0314    2.8  39.3  -11.0   0.9659   4.2    4.9	Cyg X-3
326.1054  38.3295    2.4  26.9    1.4   0.8773   4.8    3.2	Cyg X-2
308.0604  37.6114    2.2  37.8  -15.9   1.0908   5.2 ------	UNKNOWN
355.3846 -23.6250    3.1  41.5 -164.0   1.0163   3.7 ------	UNKNOWN
293.6315  15.4907    4.3  47.8  -51.0   2.2469   2.7 ------	UNKNOWN
328.9294 -30.1498    2.4  48.4 -130.5   3.9122   4.9 ------	UNKNOWN
Pre-slew background subtracted image of 15-350 keV band
Time interval of the image:
-73.608000 29.368000

# RAcent  DECcent POSerr Theta    Phi  PeakCts   SNR AngSep     Name
#  [deg]    [deg]    ['] [deg]  [deg]                   [']
299.5367  35.4073    0.0  43.5  -22.6  -0.4750  -1.9   12.6	Cyg X-1
307.9522  41.0306    6.0  39.4  -11.1  -0.4070  -1.9    8.5	Cyg X-3
326.4265  38.2952    0.0  26.7    1.8   0.3140   1.9   12.1	Cyg X-2
  7.4811  28.3132    2.4  25.2   89.8   0.9675   4.8 ------	UNKNOWN
330.9961 -17.9381    0.7  36.3 -127.1   4.4522  17.3 ------	UNKNOWN
Post-slew image of 15-350 keV band
Time interval of the image:
909.228590 962.769600

# RAcent  DECcent POSerr Theta    Phi  PeakCts   SNR AngSep     Name
#  [deg]    [deg]    ['] [deg]  [deg]                   [']
135.5010 -40.4862    2.5  47.8  149.7   1.4678   4.5    4.3	Vela X-1
170.5079 -60.6493    6.1  48.8 -170.6  -0.3746  -1.9    5.9	Cen X-3
186.4770 -62.8121   15.4  51.9 -161.2  -0.1683  -0.8    5.5	GX 301-2
Plot creation:
Sat May 30 14:38:46 EDT 2015