Click here for the BAT GCN circular template
Image
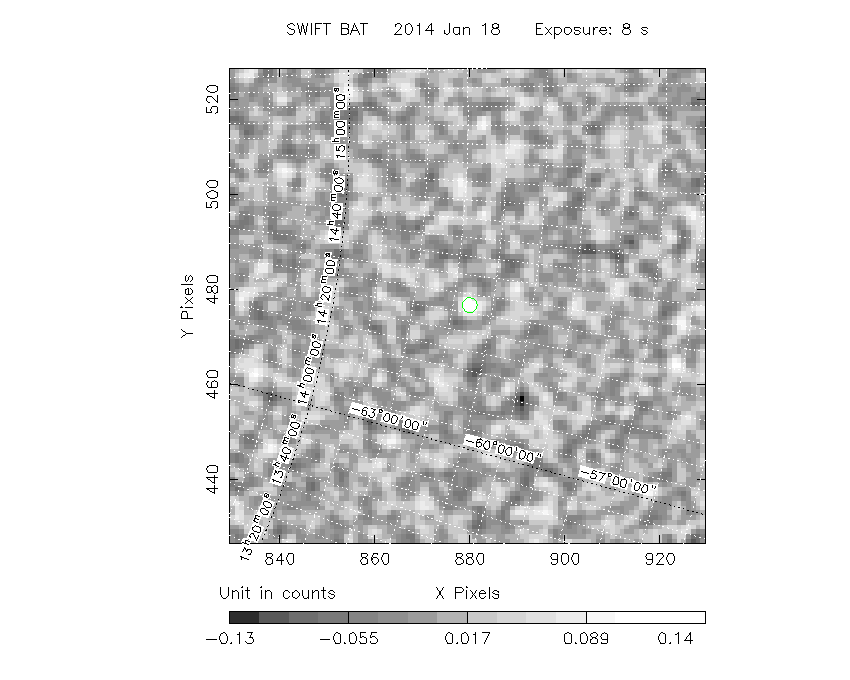
Pre-slew 15-350 keV image (Event data; bkg subtracted)
#   RAcent  DECcent POSerr  Theta    Phi     Peak Cts     SNR  Name
  215.4105 -61.5839 0.0323    0.0 -173.6       0.1878     6.0  TRIG_00584155
------------------------------------------

Foreground time interval of the image:
  0.000   8.192 (delta_t =   8.192 [sec])
Background time interval of the image:
-239.200 -27.200 (delta_t = 212.000 [sec])
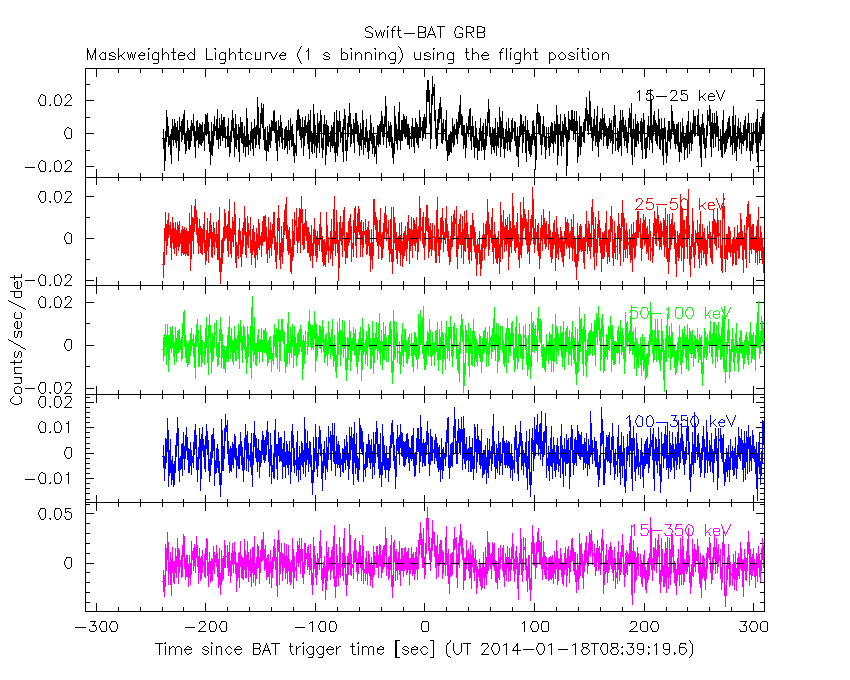
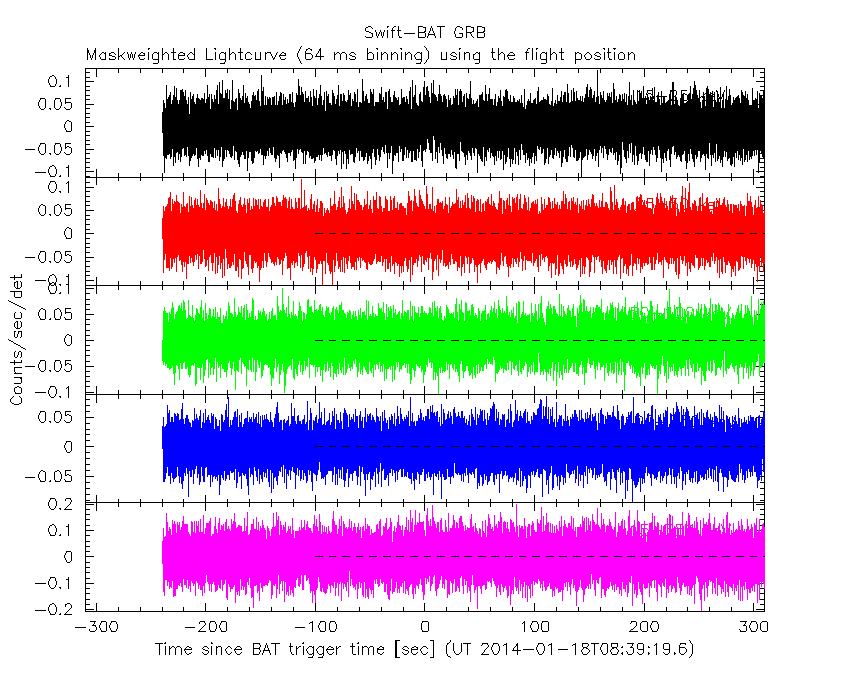
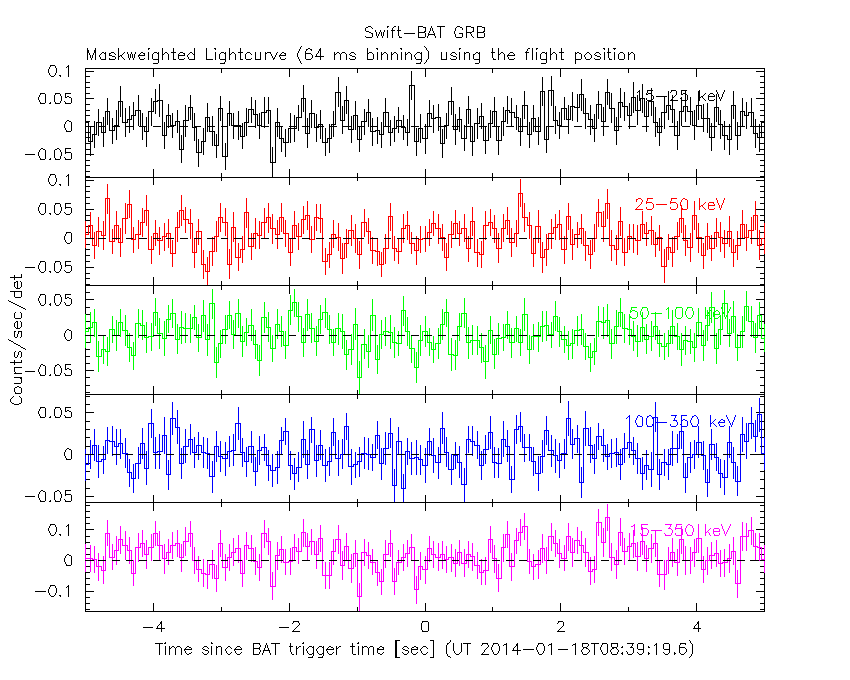
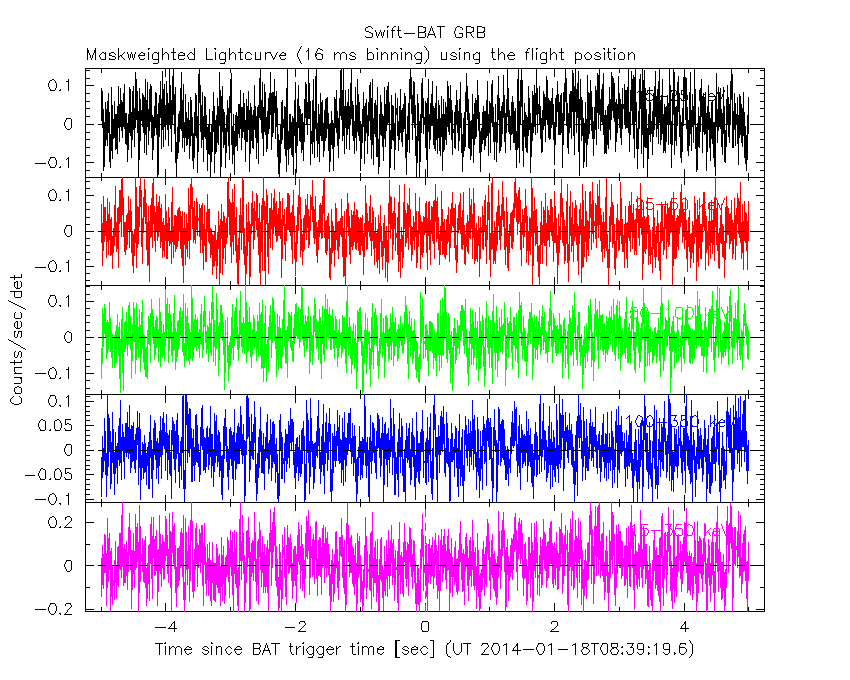
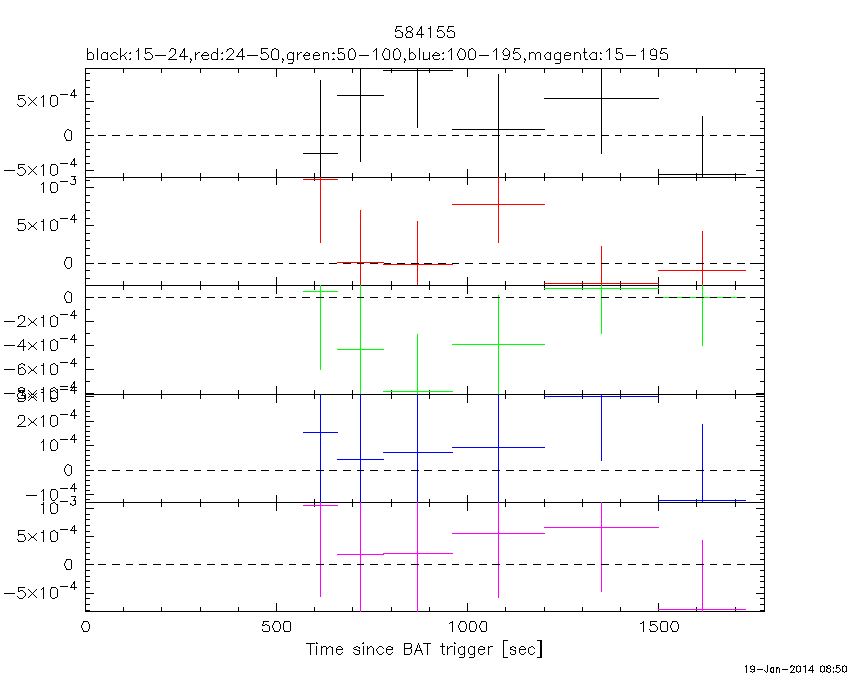
Lightcurves
Notes:
- 1) All plots contain as much data as has been downloaded to date.
- 2) The mask-weighted light curves are using the flight position.
- 3) Multiple plots of different time binning/intervals are shown to cover all scenarios of short/long GRBs, rate/image triggers, and real/false positives.
- 4) For all the mask-weighted lightcurves, the y-axis units are counts/sec/det where a det is 0.4 x 0.4 = 0.16 sq cm.
- 5) The verticle lines correspond to following: green dotted lines are T50 interval, black dotted lines are T90 interval, blue solid line(s) is a spacecraft slew start time, and orange solid line(s) is a spacecraft slew end time.
- 6) Time of each bin is in the middle of the bin.
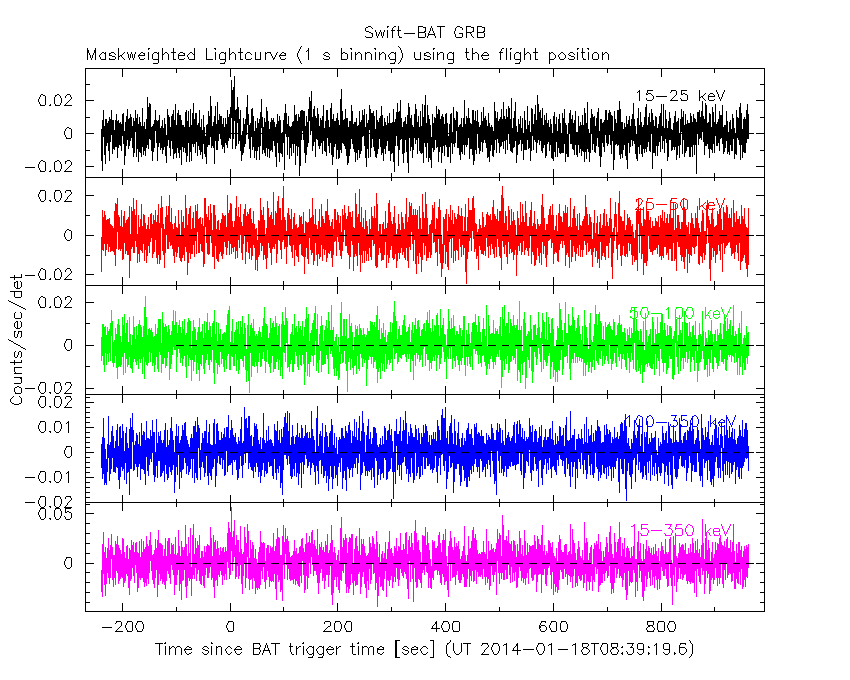
1 s binning
From T0-310 s to T0+310 s
From T100_start - 20 s to T100_end + 30 s
Full time interval
64 ms binning
Full time interval
From T100_start to T100_end
From T0-5 sec to T0+5 sec
16 ms binning
From T100_start-5 s to T100_start+5 s
Blue+Cyan dotted lines: Time interval of the scaled map
From 0.000000 to 8.192000
8 ms binning
From T100_start-3 s to T100_start+3 s
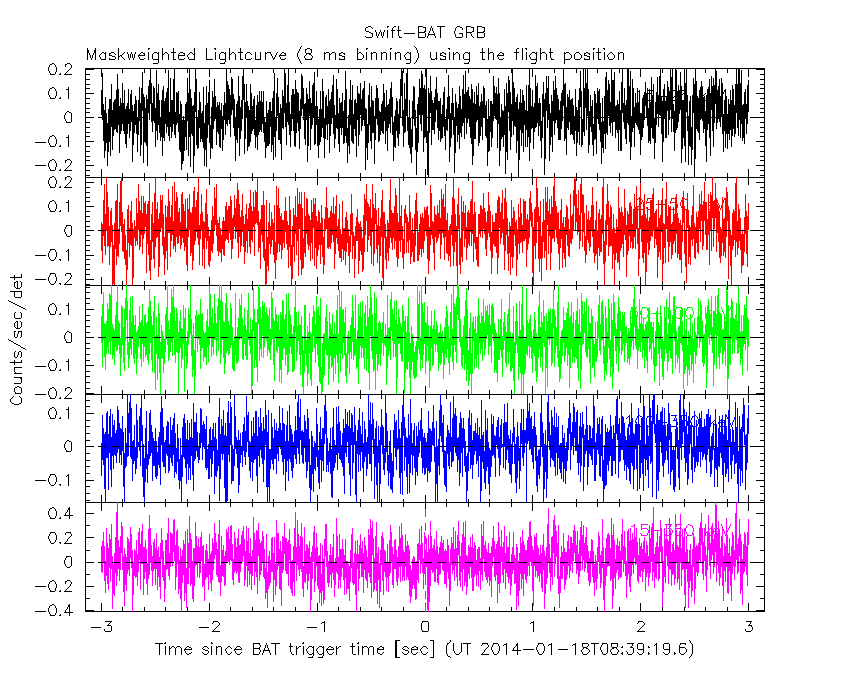
Blue+Cyan dotted lines: Time interval of the scaled map
From 0.000000 to 8.192000
2 ms binning
From T100_start-1 s to T100_start+1 s
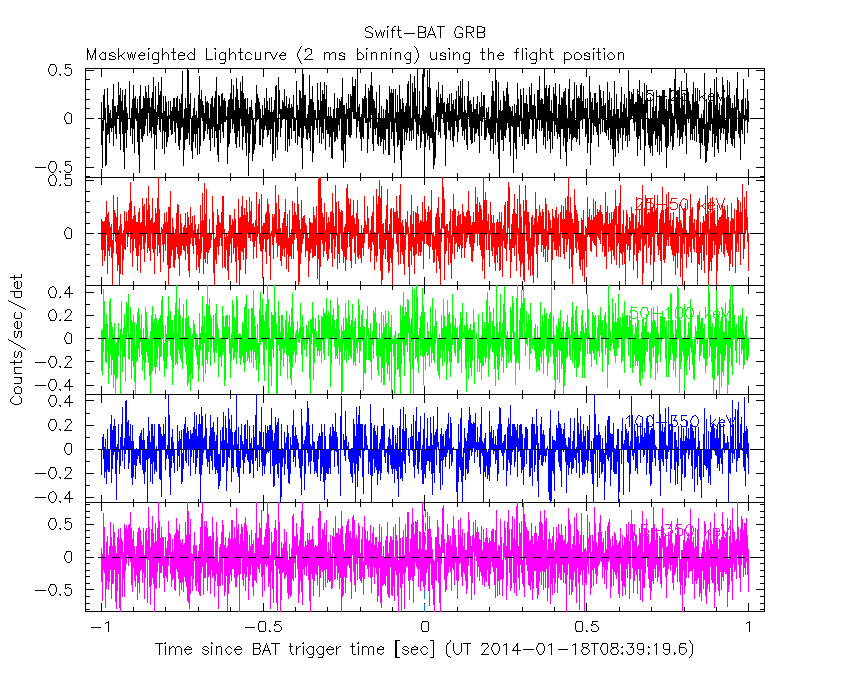
Blue+Cyan dotted lines: Time interval of the scaled map
From 0.000000 to 8.192000
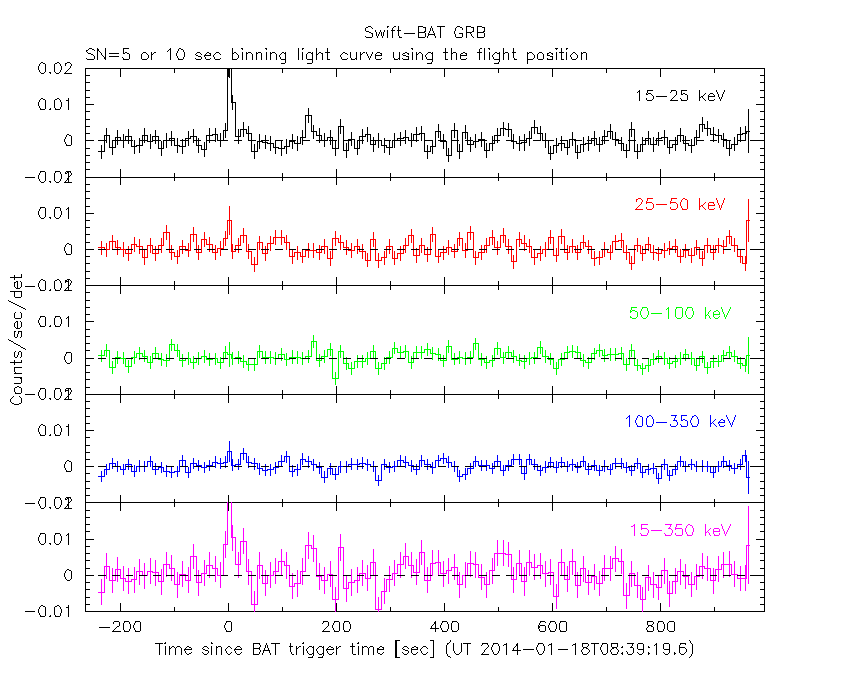
SN=5 or 10 sec. binning (whichever binning is satisfied first)
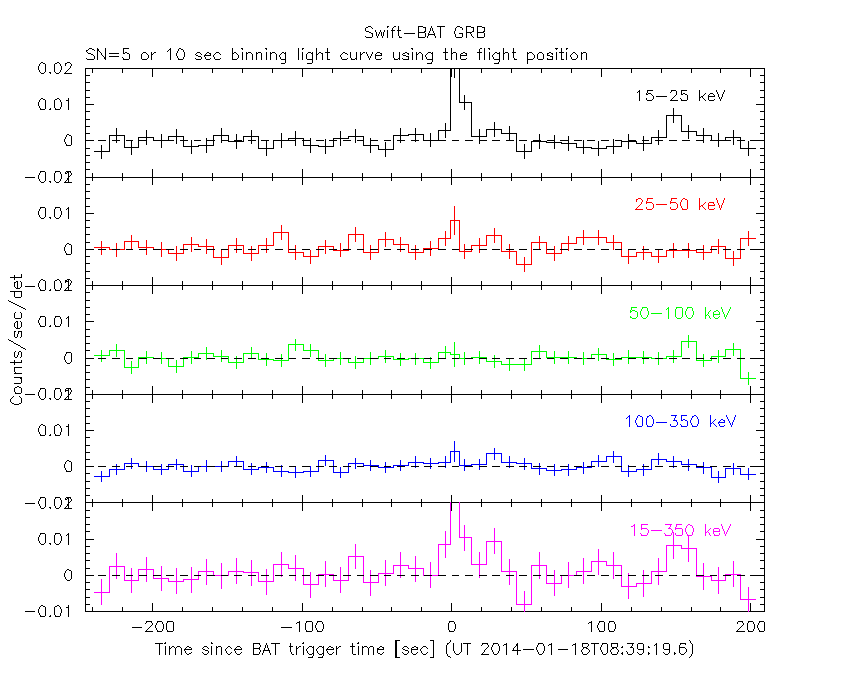
SN=5 or 10 sec. binning (T < 200 sec)
The mask-weighted light curves based on cleaned DPHs
Spectra
Notes:
- 1) The fitting includes the systematic errors.
- 2) For long bursts, a spectral fit of the pre-slew DRM will introduce some errors in both a spectral shape and a normalization if the PHA file contains a lot of the slew/post-slew time interval.
- 3) For fits to more complicated models (e.g. a power-law over a cutoff power-law), the BAT team has decided to require a chi-square improvement of more than 6 for each extra dof.
- 4) For short bursts (T90<1sec), the specrtum is also fit with Blackbody, OTTB, and Double Blackbody.
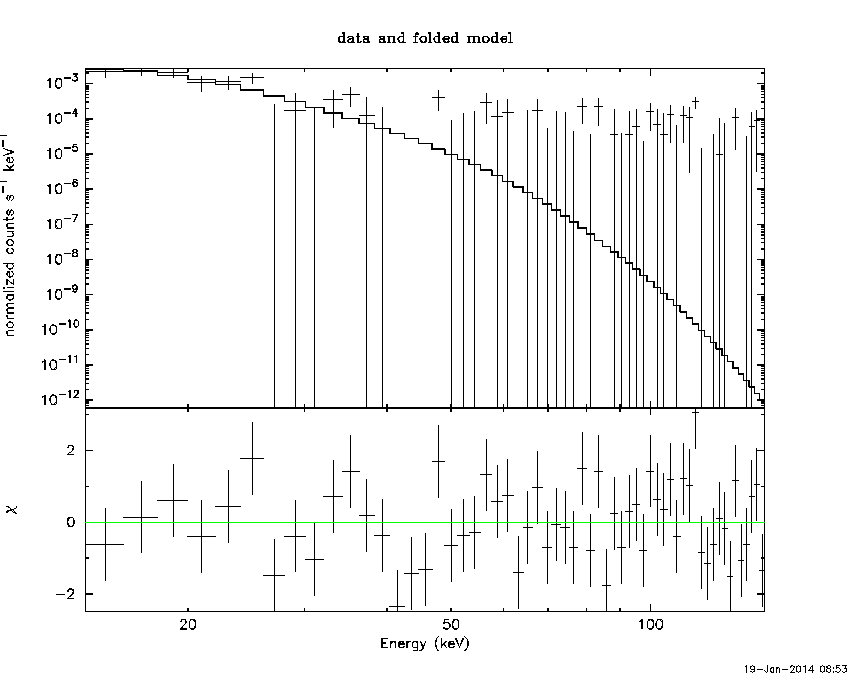
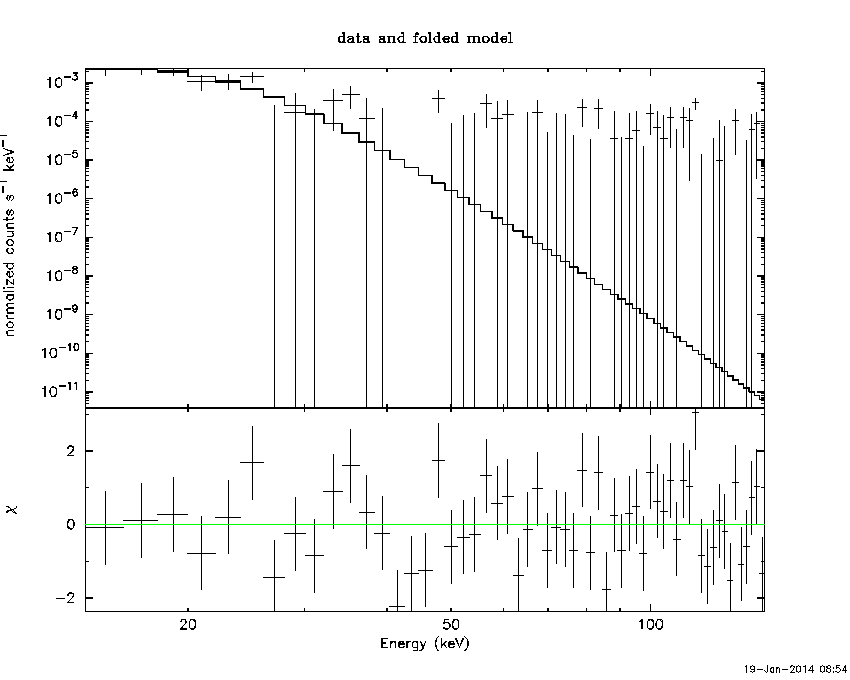
Time averaged spectrum fit using the pre-slew DRM
Power-law model

Time interval is from    0.000 sec. to    8.192 sec.

Spectral model in power-law:
------------------------------------------------------------
Parameters  : value       lower 90%   higher 90%
Photon index: 4.22547     ( -0.791251   1.02778 )
Norm@50keV  : 2.42627E-04    ( -0.000243017   0.000287763 )
------------------------------------------------------------
#Fit statistic : Chi-Squared =          68.16 using 59 PHA bins.
# Reduced chi-squared =          1.196 for     57 degrees of freedom
# Null hypothesis probability =   1.479694e-01

Photon flux (15-150 keV)    in 8.192 sec: 0.182684 ( -0.0454928  0.0463787 ) ph/cm2/s
Energy fluence (15-150 keV)             : 5.18505e-08 ( -1.53283e-08  1.77326e-08 ) ergs/cm2
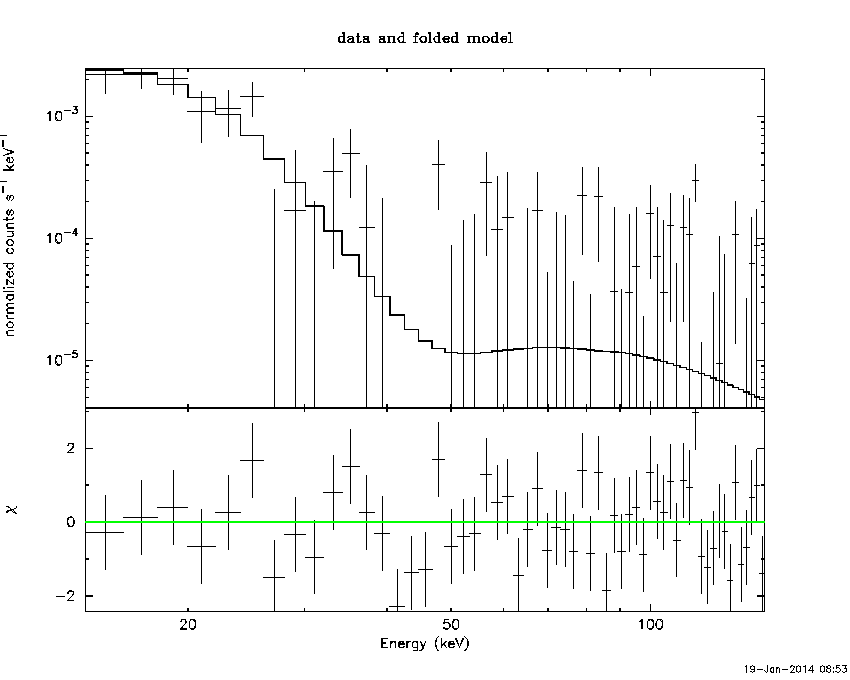
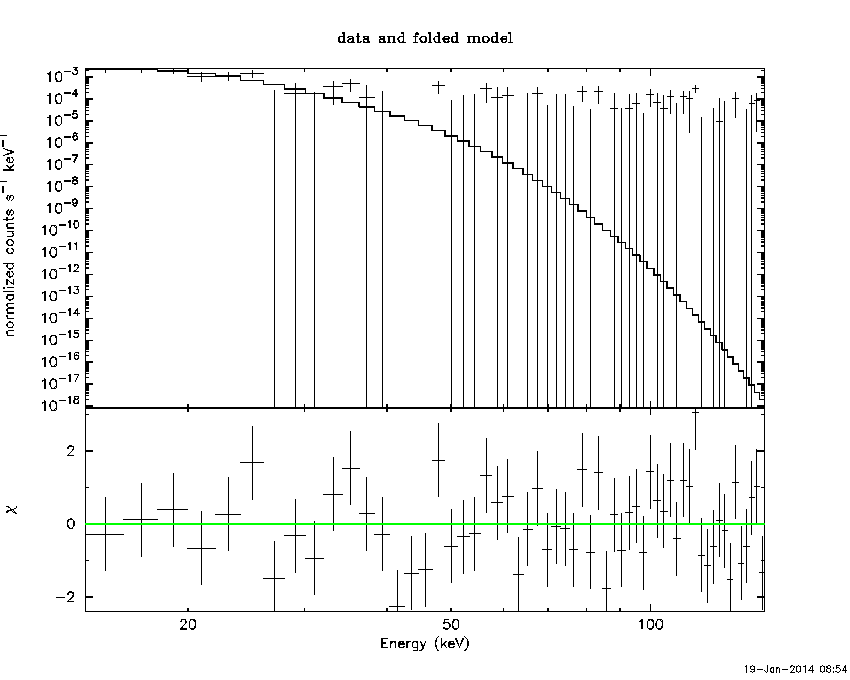
Cutoff power-law model

Time interval is from    0.000 sec. to    8.192 sec.
Spectral model in the cutoff power-law:
------------------------------------------------------------
Parameters  : value       lower 90%   higher 90%
Photon index: 1.00000     (     )
Epeak [keV] : 50.0000      (   )
Norm@50keV  : 2.78785E-03    (     )
------------------------------------------------------------
#Fit statistic : Chi-Squared =         101.95 using 59 PHA bins.
# Reduced chi-squared =         1.8205 for     56 degrees of freedom
# Null hypothesis probability =   1.714877e-04

Photon flux (15-150 keV)    in 8.192 sec: 0.187215 ( -0.042363  0.042804 ) ph/cm2/s
Energy fluence (15-150 keV)             : 4.82536e-08 ( -1.1917e-08  1.2979e-08 ) ergs/cm2
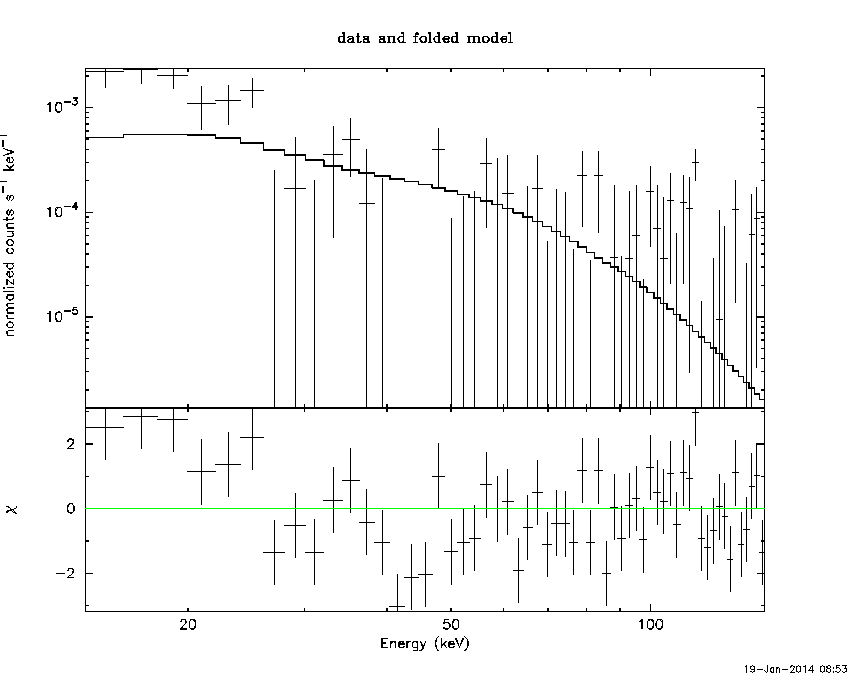
Band function

Time interval is from    0.000 sec. to    8.192 sec.

Spectral model in the Band function:
------------------------------------------------------------
Parameters  : value       lower 90%   higher 90%
alpha       : 4.04902   ( 1.70225   1.70225 )
beta        : -10.0000    ( 9.99824   0.0100452 )
Epeak [keV] : 15.3652      ( -3.44937 16.8003 )
Norm@50keV   : 1622.65    ( -1619.96   6788.86 )
------------------------------------------------------------
#Fit statistic : Chi-Squared =          64.86 using 59 PHA bins.
# Reduced chi-squared =          1.179 for     55 degrees of freedom
# Null hypothesis probability =   1.706641e-01

Photon flux (15-150 keV)    in 8.192 sec:  (    ) ph/cm2/s
Energy fluence (15-150 keV)             : 0 ( 0  0 ) ergs/cm2
Single BB

Spectral model blackbody:
------------------------------------------------------------
Parameters  : value    Lower 90%  Upper 90%
kT [keV]    : 3.42480  (-0.674795  0.799166)
R^2/D10^2   : 11.9559  (-11.9559   31.3567)
(R is the radius in km and D10 is the distance to the source in units of 10 kpc)
------------------------------------------------------------
#Fit statistic : Chi-Squared =          65.00 using 59 PHA bins.
# Reduced chi-squared =          1.140 for     57 degrees of freedom
# Null hypothesis probability =   2.180778e-01

Energy  Fluence     90% Error
[keV]   [erg/cm2]   [erg/cm2]
15- 25  3.983e-08   2.273e-08
25- 50  9.018e-09   5.820e-09
50-150  3.968e-11   4.325e-11
15-150  4.889e-08   2.868e-08
Thermal bremsstrahlung (OTTB)
Spectral model: thermal bremsstrahlung
------------------------------------------------------------
Parameters  : value         Lower 90%    Upper 90%
kT [keV]    : 7.60585       (-2.37292      3.71126)
Norm        : 12.0200       (-6.84601     20.6495)
------------------------------------------------------------
#Fit statistic : Chi-Squared =          66.01 using 59 PHA bins.
# Reduced chi-squared =          1.158 for     57 degrees of freedom
# Null hypothesis probability =   1.935062e-01

Energy  Fluence     90% Error
[keV]   [erg/cm2]   [erg/cm2]
15- 25  3.802e-08   2.174e-08
25- 50  1.088e-08   6.996e-09
50-150  3.235e-10   3.847e-10
15-150  4.922e-08   2.810e-08
Double BB
Spectral model: bbodyrad<1> + bbodyrad<2>
------------------------------------------------------------
Parameters  : value         Lower 90%    Upper 90%
kT1 [keV]   : 3.42076        (-0.682994      0.78389)
R1^2/D10^2  : 12.0005        (-12.0115      29.9647)
kT2 [keV]   : 199.355        (-199.363      -199.363)
R2^2/D10^2  : 4.77401E-06    (-4.8828e-06   -4.8828e-06)
------------------------------------------------------------
#Fit statistic : Chi-Squared =          64.74 using 59 PHA bins.
# Reduced chi-squared =          1.177 for     55 degrees of freedom
# Null hypothesis probability =   1.731934e-01

Energy  Fluence     90% Error
[keV]   [erg/cm2]   [erg/cm2]
15- 25  3.977e-08   2.281e-08
25- 50  9.384e-09   5.755e-09
50-150  1.039e-08   4.293e-11
15-150  5.955e-08   2.911e-08
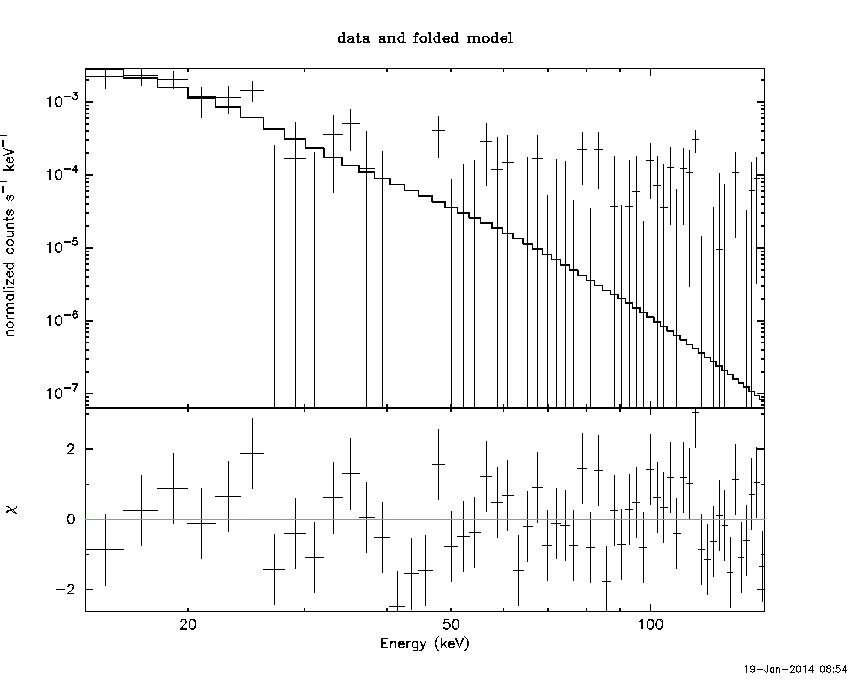
Peak spectrum fit
Power-law model

Time interval is from    0.000 sec. to    8.192 sec.

Spectral model in power-law:
------------------------------------------------------------
Parameters  : value       lower 90%   higher 90%
Photon index: 4.22547     ( -0.791251   1.02778 )
Norm@50keV  : 2.42627E-04    ( -0.000243017   0.000287763 )
------------------------------------------------------------
#Fit statistic : Chi-Squared =          68.16 using 59 PHA bins.
# Reduced chi-squared =          1.196 for     57 degrees of freedom
# Null hypothesis probability =   1.479694e-01

Photon flux (15-150 keV)    in 8.192 sec: 0.182684 ( -0.0454928  0.0463787 ) ph/cm2/s
Energy fluence (15-150 keV)             : 5.18505e-08 ( -1.53283e-08  1.77326e-08 ) ergs/cm2
Cutoff power-law model
Time interval is from    0.000 sec. to    8.192 sec.
Spectral model in the cutoff power-law:
------------------------------------------------------------
Parameters  : value       lower 90%   higher 90%
Photon index: 1.00000     (     )
Epeak [keV] : 50.0000      (   )
Norm@50keV  : 2.78785E-03    (     )
------------------------------------------------------------
#Fit statistic : Chi-Squared =         101.95 using 59 PHA bins.
# Reduced chi-squared =         1.8205 for     56 degrees of freedom
# Null hypothesis probability =   1.714877e-04

Photon flux (15-150 keV)    in 8.192 sec: 0.187215 ( -0.042363  0.042804 ) ph/cm2/s
Energy fluence (15-150 keV)             : 4.82536e-08 ( -1.1917e-08  1.2979e-08 ) ergs/cm2
Band function
Time interval is from    0.000 sec. to    8.192 sec.

Spectral model in the Band function:
------------------------------------------------------------
Parameters  : value       lower 90%   higher 90%
alpha       : 4.04902   ( 1.70225   1.70225 )
beta        : -10.0000    ( 9.99824   0.0100452 )
Epeak [keV] : 15.3652      ( -3.44937 16.8003 )
Norm@50keV   : 1622.65    ( -1619.96   6786.51 )
------------------------------------------------------------
#Fit statistic : Chi-Squared =          64.86 using 59 PHA bins.
# Reduced chi-squared =          1.179 for     55 degrees of freedom
# Null hypothesis probability =   1.706641e-01

Photon flux (15-150 keV)    in 8.192 sec:  (    ) ph/cm2/s
Energy fluence (15-150 keV)             : 0 ( 0  0 ) ergs/cm2
Single BB
Spectral model blackbody:
------------------------------------------------------------
Parameters  : value    Lower 90%  Upper 90%
kT [keV]    : 3.42480  (-0.674795  0.799166)
R^2/D10^2   : 11.9559  (-11.9559   31.3567)
(R is the radius in km and D10 is the distance to the source in units of 10 kpc)
------------------------------------------------------------
#Fit statistic : Chi-Squared =          65.00 using 59 PHA bins.
# Reduced chi-squared =          1.140 for     57 degrees of freedom
# Null hypothesis probability =   2.180778e-01

Energy  Fluence     90% Error
[keV]   [erg/cm2]   [erg/cm2]
15- 25  3.983e-08   2.285e-08
25- 50  9.018e-09   5.951e-09
50-150  3.968e-11   4.243e-11
15-150  4.889e-08   2.759e-08
Thermal bremsstrahlung (OTTB)

Spectral model: thermal bremsstrahlung
------------------------------------------------------------
Parameters  : value         Lower 90%    Upper 90%
kT [keV]    : 7.60585       (-2.37292      3.71126)
Norm        : 12.0200       (-6.84601     20.6495)
------------------------------------------------------------
#Fit statistic : Chi-Squared =          66.01 using 59 PHA bins.
# Reduced chi-squared =          1.158 for     57 degrees of freedom
# Null hypothesis probability =   1.935062e-01

Energy  Fluence     90% Error
[keV]   [erg/cm2]   [erg/cm2]
15- 25  3.802e-08   2.145e-08
25- 50  1.088e-08   7.094e-09
50-150  3.235e-10   3.464e-10
15-150  4.922e-08   2.813e-08
Double BB

Spectral model: bbodyrad<1> + bbodyrad<2>
------------------------------------------------------------
Parameters  : value         Lower 90%    Upper 90%
kT1 [keV]   : 3.42076        (-0.682994      0.78389)
R1^2/D10^2  : 12.0005        (-12.0115      29.9649)
kT2 [keV]   : 199.355        (-199.363      -199.363)
R2^2/D10^2  : 4.77401E-06    (-4.8828e-06   -4.8828e-06)
------------------------------------------------------------
#Fit statistic : Chi-Squared =          64.74 using 59 PHA bins.
# Reduced chi-squared =          1.177 for     55 degrees of freedom
# Null hypothesis probability =   1.731934e-01

Energy  Fluence     90% Error
[keV]   [erg/cm2]   [erg/cm2]
15- 25  3.977e-08   2.245e-08
25- 50  9.384e-09   5.718e-09
50-150  1.039e-08   5.128e-11
15-150  5.955e-08   2.782e-08
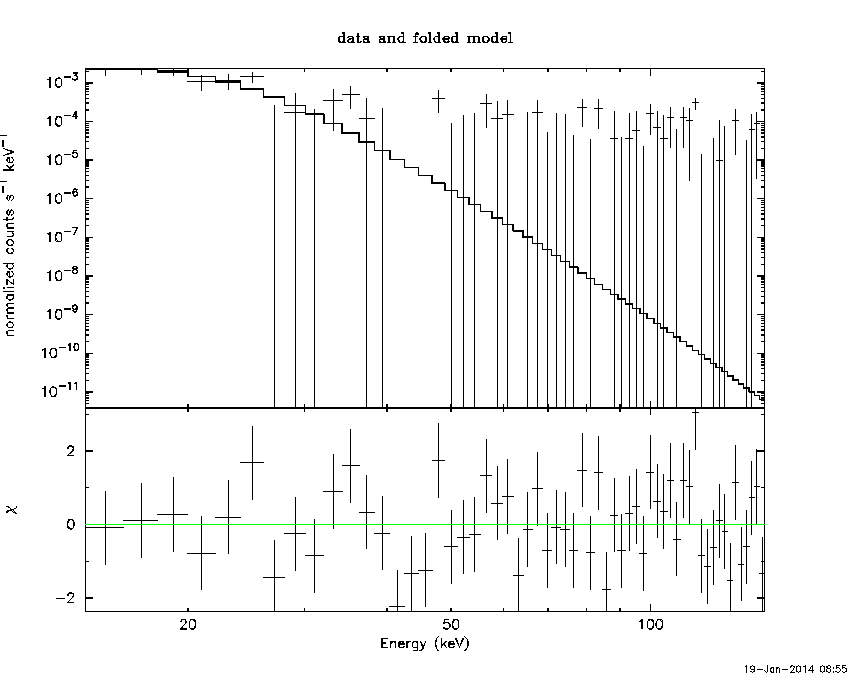
Pre-slew spectrum (Pre-slew PHA with pre-slew DRM)
Power-law model
Spectral model in power-law:
------------------------------------------------------------
Parameters  : value       lower 90%   higher 90%
Photon index: 4.22547     ( -0.791251   1.02778 )
Norm@50keV  : 2.42627E-04    ( -0.000243017   0.000287763 )
------------------------------------------------------------
#Fit statistic : Chi-Squared =          68.16 using 59 PHA bins.
# Reduced chi-squared =          1.196 for     57 degrees of freedom
# Null hypothesis probability =   1.479694e-01

Photon flux (15-150 keV)    in 8.192 sec: 0.182684 ( -0.0454928  0.0463787 ) ph/cm2/s
Energy fluence (15-150 keV)             : 5.18505e-08 ( -1.53283e-08  1.77326e-08 ) ergs/cm2
Cutoff power-law model

Spectral model in the cutoff power-law:
------------------------------------------------------------
Parameters  : value       lower 90%   higher 90%
Photon index: 1.00000     (     )
Epeak [keV] : 50.0000      (   )
Norm@50keV  : 2.78785E-03    (     )
------------------------------------------------------------
#Fit statistic : Chi-Squared =         101.95 using 59 PHA bins.
# Reduced chi-squared =         1.8205 for     56 degrees of freedom
# Null hypothesis probability =   1.714877e-04

Photon flux (15-150 keV)    in 8.192 sec: 0.187215 ( -0.042363  0.042804 ) ph/cm2/s
Energy fluence (15-150 keV)             : 4.82536e-08 ( -1.1917e-08  1.2979e-08 ) ergs/cm2
Band function
Spectral model in the Band function:
------------------------------------------------------------
Parameters  : value       lower 90%   higher 90%
alpha       : 4.04902   ( 1.70225   1.70225 )
beta        : -10.0000    ( 9.99824   0.0100452 )
Epeak [keV] : 15.3652      ( -3.44937 16.8003 )
Norm@50keV   : 1622.65    ( -1619.96   6786.47 )
------------------------------------------------------------
#Fit statistic : Chi-Squared =          64.86 using 59 PHA bins.
# Reduced chi-squared =          1.179 for     55 degrees of freedom
# Null hypothesis probability =   1.706641e-01

Photon flux (15-150 keV)    in 8.192 sec:  (    ) ph/cm2/s
Energy fluence (15-150 keV)             : 0 ( 0  0 ) ergs/cm2
S(25-50 keV) vs. S(50-100 keV) plot
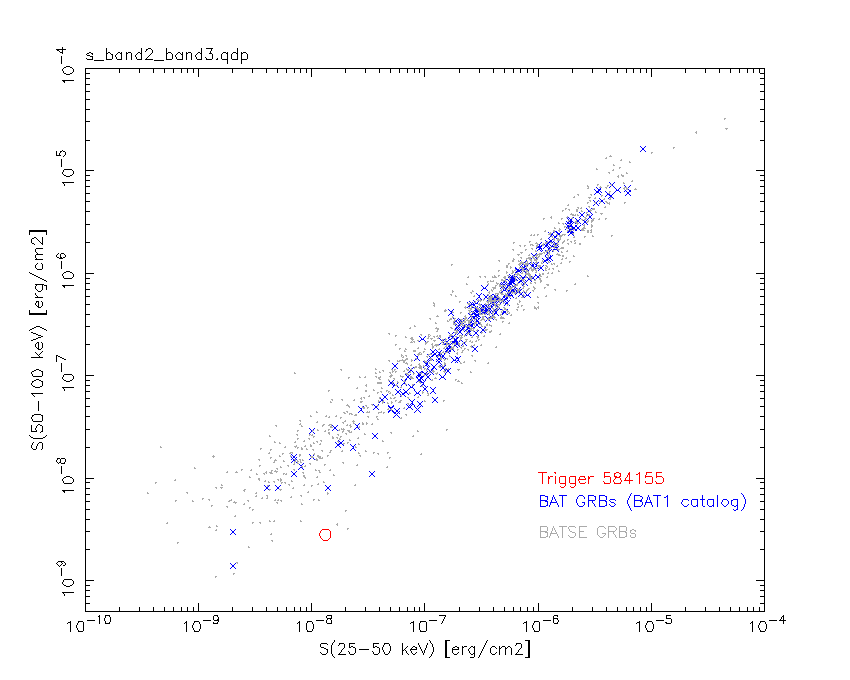
S(25-50 keV)  = 1.3164e-08
S(50-100 keV) = 2.81804e-09
T90 vs. Hardness ratio plot
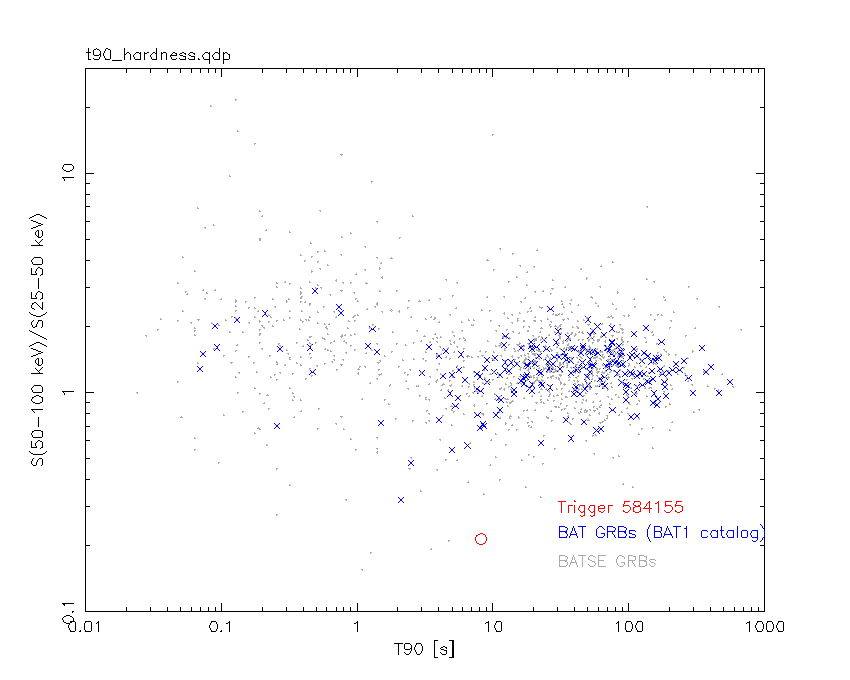
T90                                   = 8.19200003147125 sec.
Hardness ratio (energy fluence ratio) = 0.214072
Color vs. Color plot
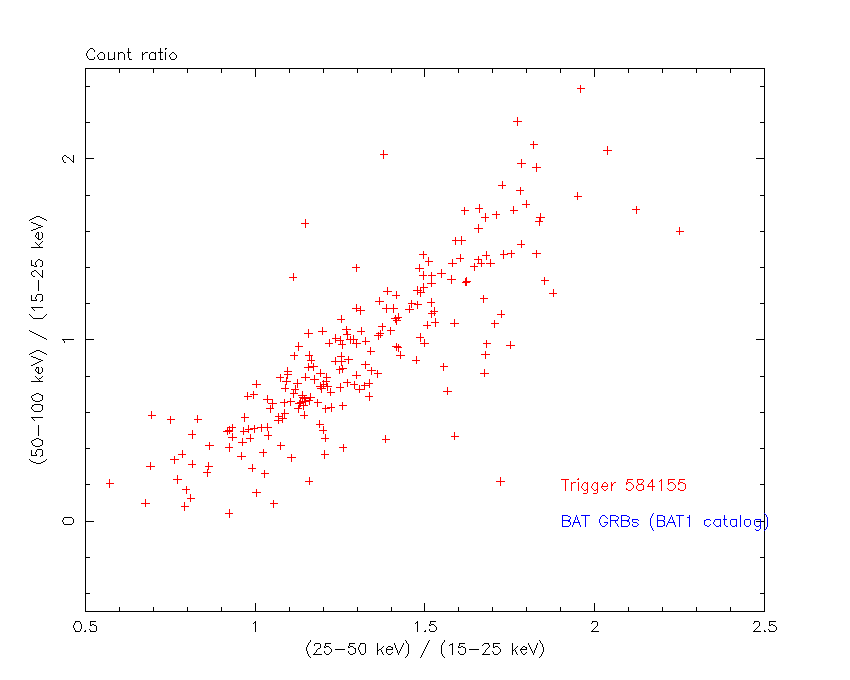
Count Ratio  (25-50 keV) / (15-25 keV) = 0.132766
Count Ratio (50-100 keV) / (15-25 keV) = -0.00605179
Mask shadow pattern
IMX = -6.924381378664515E-04, IMY = 7.771820652658479E-05
TIME vs. PHA plot around the trigger time
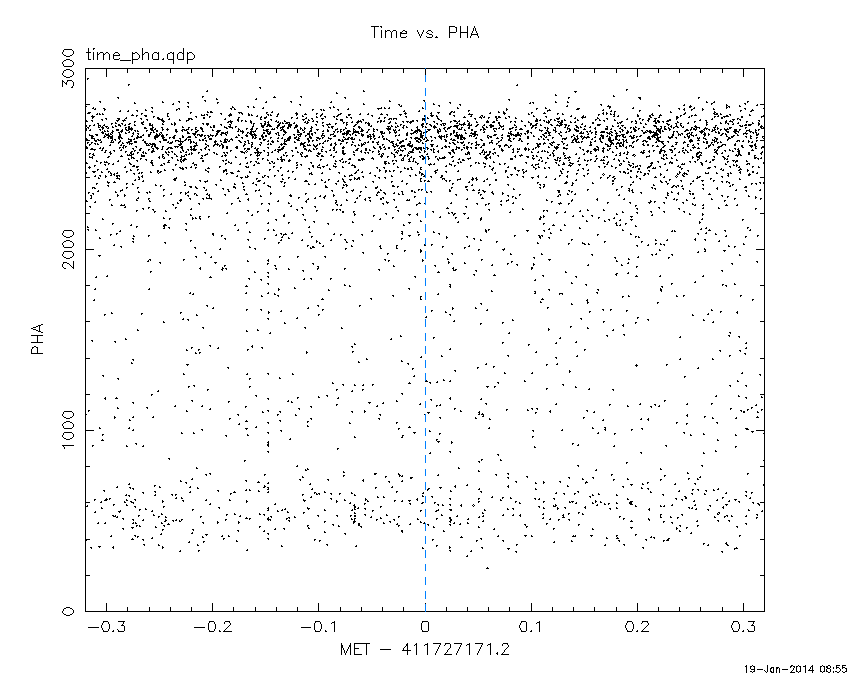
Blue+Cyan dotted lines: Time interval of the scaled map
From 0.000000 to 8.192000
TIME vs. DetID plot around the trigger time
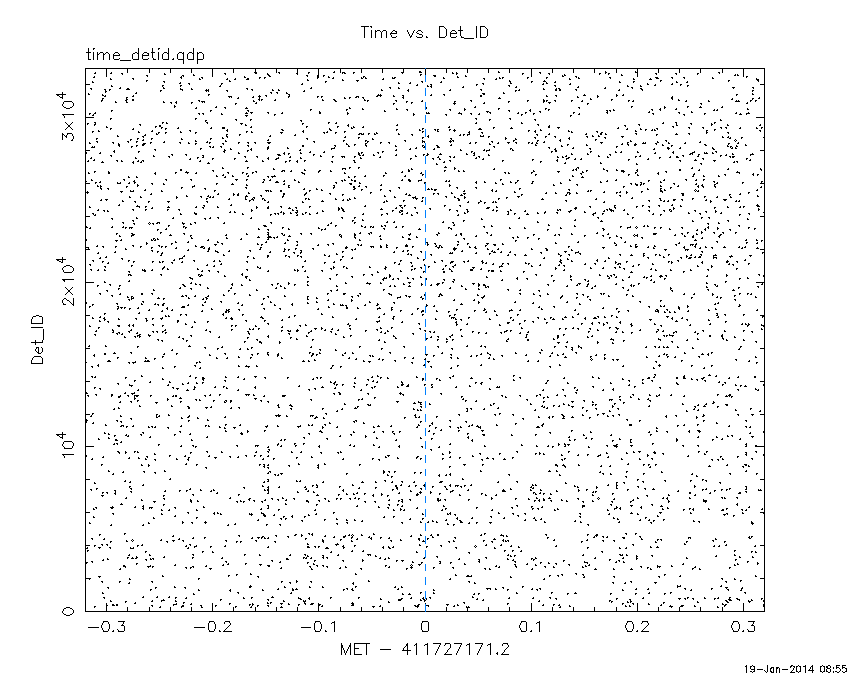
Blue+Cyan dotted lines: Time interval of the scaled map
From 0.000000 to 8.192000
100 us light curve (15-350 keV)
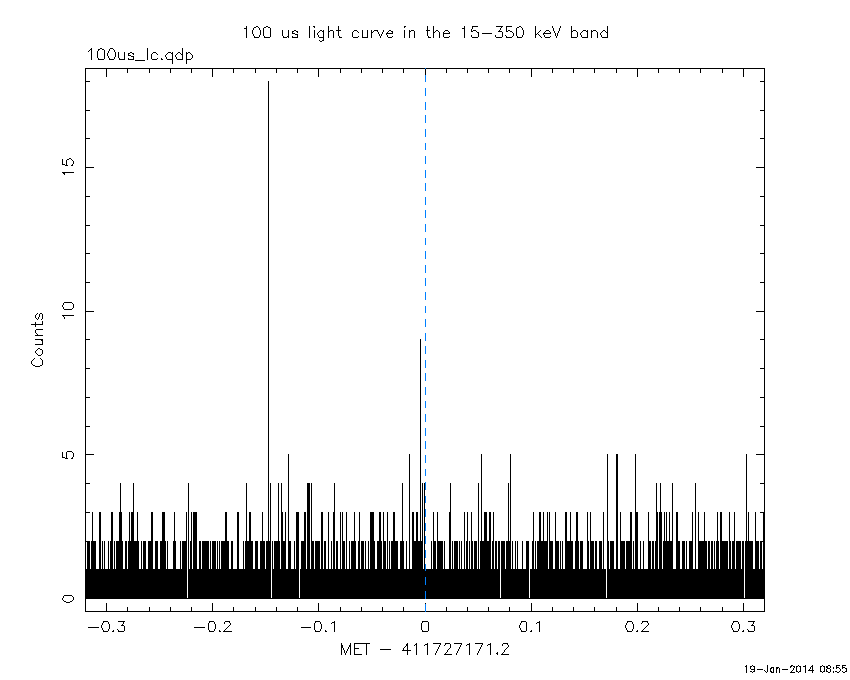
Blue+Cyan dotted lines: Time interval of the scaled map
From 0.000000 to 8.192000
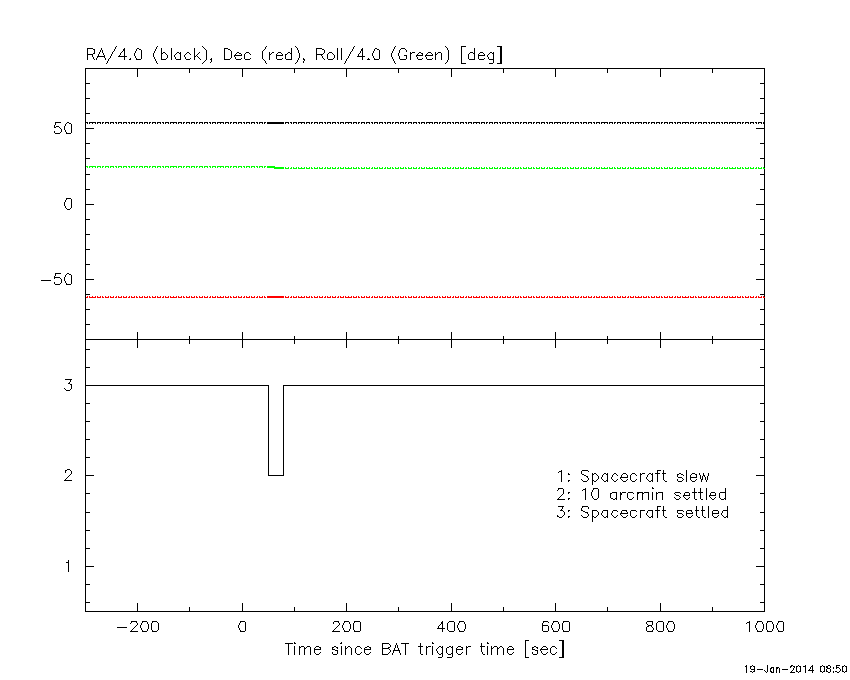
Spacecraft aspect plot
Bright source in the pre-burst/pre-slew/post-slew images
Pre-burst image of 15-350 keV band
Time interval of the image:
-239.200000 -27.200000

# RAcent  DECcent POSerr Theta    Phi  PeakCts   SNR AngSep     Name
#  [deg]    [deg]    ['] [deg]  [deg]                   [']
170.4491 -60.7485   68.6  21.2   63.3  -0.0386  -0.2    8.5	Cen X-3
186.3618 -62.7264    6.9  13.5   63.5   0.3190   1.7    8.5	GX 301-2
244.9567 -15.6424    1.1  50.6 -151.0   5.7479  10.6    1.3	Sco X-1
255.9865 -37.8442   55.4  34.4 -123.7  -0.0645  -0.2    0.0	4U 1700-377
256.4355 -36.4234  144.3  35.8 -124.5   0.0274   0.1    0.0	GX 349+2
264.8492 -44.2989    6.0  33.3 -107.1  -0.6640  -1.9   10.1	4U 1735-44
263.0920 -33.8951   10.6  40.9 -119.2   0.5922   1.1    6.3	GX 354-0
196.0647 -13.4372    2.3  50.2  146.2   4.7813   4.9 ------	UNKNOWN
108.1746 -57.3546    2.3  48.3   34.6   3.7962   5.0 ------	UNKNOWN
212.3029 -39.0469    3.2  22.7  164.8   0.7269   3.6 ------	UNKNOWN
222.1171  -4.8437    3.2  57.0  179.0   4.4698   3.6 ------	UNKNOWN
 55.3863 -83.0365    2.9  35.0   -4.9   0.9922   3.9 ------	UNKNOWN
235.1021  -5.7879    2.3  57.7 -165.6   4.9722   4.9 ------	UNKNOWN
266.9492 -32.4729    2.8  43.8 -116.3   3.7916   4.1 ------	UNKNOWN
Pre-slew background subtracted image of 15-350 keV band
Time interval of the image:
0.000000 8.192000

# RAcent  DECcent POSerr Theta    Phi  PeakCts   SNR AngSep     Name
#  [deg]    [deg]    ['] [deg]  [deg]                   [']
170.5028 -60.7398    4.9  21.2   63.3   0.0902   2.4    8.9	Cen X-3
187.0266 -62.7097    3.0  13.2   63.8   0.1333   3.8   10.8	GX 301-2
244.9711 -15.7796    4.5  50.4 -151.0  -0.2293  -2.6    8.4	Sco X-1
256.1219 -37.7420   17.3  34.6 -123.6  -0.0339  -0.7    8.9	4U 1700-377
256.6865 -36.4967    0.0  35.9 -124.1  -0.0458  -0.8   12.9	GX 349+2
264.6018 -44.3593    2.3  33.2 -107.3  -0.2730  -4.9    8.1	4U 1735-44
262.7448 -33.7896    7.5  40.8 -119.7   0.1187   1.5   12.5	GX 354-0
215.4105 -61.5839    1.9   0.0 -173.6   0.1878   6.0 ------	UNKNOWN
Post-slew image of 15-350 keV band
Time interval of the image:
Plot creation:
Sun Jan 19 08:55:44 EST 2014