Special notes of this burst
Image
Pre-slew 15.0-350.0 keV image (Event data)

#   RAcent    DECcent   POSerr    Theta     Phi              Peak Cts       SNR   Name
  326.7640    26.2147   0.0177    13.7748  -167.8239         0.1590546     10.880 TRIG_00585149

Foreground time interval of the image:
  0.076   1.588 (delta_t =   1.512 [sec])
Background time interval of the image:
-239.024   0.076 (delta_t = 239.100 [sec])
Lightcurves
Notes:
- 1) The mask-weighted light curves are using the flight position.
- 2) Multiple plots of different time binning/intervals are shown to cover all scenarios of short/long GRBs, rate/image triggers, and real/false positives.
- 3) For all the mask-weighted lightcurves, the y-axis units are counts/sec/det where a det is 0.4 x 0.4 = 0.16 sq cm.
- 4) The verticle lines correspond to following: green dotted lines are T50 interval, black dotted lines are T90 interval, blue solid line(s) is a spacecraft slew start time, and orange solid line(s) is a spacecraft slew end time.
- 5) Time of each bin is in the middle of the bin.
1 s binning
From T0-310 s to T0+310 s

From T100_start - 20 s to T100_end + 30 s

Full time interval

64 ms binning
Full time interval

From T100_start to T100_end

From T0-5 sec to T0+5 sec

16 ms binning
From T100_start-5 s to T100_start+5 s

Blue+Cyan dotted lines: Time interval of the scaled map
From 0.000000 to 1.024000
8 ms binning
From T100_start-3 s to T100_start+3 s

Blue+Cyan dotted lines: Time interval of the scaled map
From 0.000000 to 1.024000
2 ms binning
From T100_start-1 s to T100_start+1 s

Blue+Cyan dotted lines: Time interval of the scaled map
From 0.000000 to 1.024000
SN=5 or 10 sec. binning (whichever binning is satisfied first)

SN=5 or 10 sec. binning (T < 200 sec)
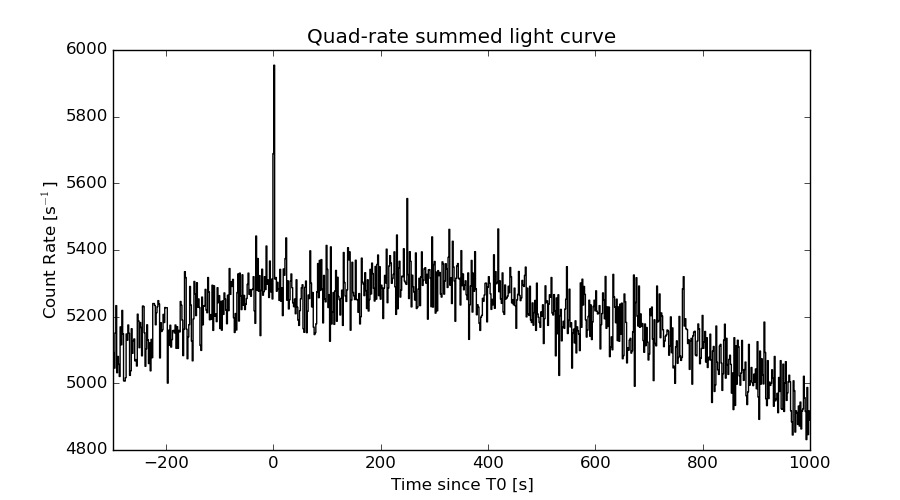
Quad-rate summed light curves (from T0-300s to T0+1000s)
The mask-weighted light curves based on cleaned DPHs

Spectral Evolution

Spectra
Notes:
- 1) The fitting includes the systematic errors.
- 2) When the burst includes telescope slew time periods, the fitting uses an average response file made from multiple 5-s response files through out the slew time plus single time preiod for the non-slew times, and weighted by the total counts in the corresponding time period using addrmf. An average response file is needed becuase a spectral fit using the pre-slew DRM will introduce some errors in both a spectral shape and a normalization if the PHA file contains a lot of the slew/post-slew time interval.
- 3) For fits to more complicated models (e.g. a power-law over a cutoff power-law), the BAT team has decided to require a chi-square improvement of more than 6 for each extra dof.
Time averaged spectrum fit using the average DRM
Power-law model

Time interval is from    0.076 sec. to    1.588 sec.

Spectral model in power-law:
------------------------------------------------------------
Parameters  : value       lower 90%   higher 90%
Photon index: 2.23046     ( -0.313109   0.349509 )
Norm@50keV  : 4.95524E-03    ( -0.00118635   0.0011448 )
------------------------------------------------------------
#Fit statistic : Chi-Squared =          49.33 using 59 PHA bins.
# Reduced chi-squared =         0.8655 for     57 degrees of freedom
# Null hypothesis probability =   7.548599e-01

Photon flux (15-150 keV)    in 1.512 sec: 0.833720 ( -0.126283  0.126293 ) ph/cm2/s
Energy fluence (15-150 keV)             : 7.07605e-08 ( -1.37796e-08  1.4421e-08 ) ergs/cm2
Cutoff power-law model

Time interval is from    0.076 sec. to    1.588 sec.
Spectral model in the cutoff power-law:
------------------------------------------------------------
Parameters  : value       lower 90%   higher 90%
Photon index: 2.39523     (     )
Epeak [keV] : 158.455      (   )
Norm@50keV  : 3.99158E-03    (     )
------------------------------------------------------------
#Fit statistic : Chi-Squared =          49.14 using 59 PHA bins.
# Reduced chi-squared =         0.8774 for     56 degrees of freedom
# Null hypothesis probability =   7.301907e-01

Photon flux (15-150 keV)    in 1.512 sec: 0.833402 (    ) ph/cm2/s
Energy fluence (15-150 keV)             : 7.04401e-08 ( -1.42789e-08  1.47387e-08 ) ergs/cm2
Band function

Time interval is from    0.076 sec. to    1.588 sec.

Spectral model in the Band function:
------------------------------------------------------------
Parameters  : value       lower 90%   higher 90%
alpha       : 5.00000   ( -4.99226   -4.99226 )
beta        : -2.29613    ( -0.53379   0.338826 )
Epeak [keV] : 17.8603      ( -17.2702 5.9731 )
Norm@50keV   : 9737.51    ( -1469.42   1.23899e+07 )
------------------------------------------------------------
#Fit statistic : Chi-Squared =          48.95 using 59 PHA bins.
# Reduced chi-squared =         0.8900 for     55 degrees of freedom
# Null hypothesis probability =   7.036640e-01

Photon flux (15-150 keV)    in 1.512 sec: 0.833400 ( 6.1666  -0.12623 ) ph/cm2/s
Energy fluence (15-150 keV)             : 0 ( 0  0 ) ergs/cm2
Single BB

Spectral model blackbody:
------------------------------------------------------------
Parameters  : value    Lower 90%  Upper 90%
kT [keV]    : 7.21404  (-1.44317  1.83449)
R^2/D10^2   : 1.33414  (-0.79257   2.01539)
(R is the radius in km and D10 is the distance to the source in units of 10 kpc)
------------------------------------------------------------
#Fit statistic : Chi-Squared =          64.09 using 59 PHA bins.
# Reduced chi-squared =          1.124 for     57 degrees of freedom
# Null hypothesis probability =   2.419181e-01

Energy  Fluence     90% Error
[keV]   [erg/cm2]   [erg/cm2]
15- 25  1.738e-08   5.346e-09
25- 50  2.522e-08   6.902e-09
50-150  4.654e-09   2.464e-09
15-150  4.725e-08   1.074e-08
Thermal bremsstrahlung (OTTB)

Spectral model: thermal bremsstrahlung
------------------------------------------------------------
Parameters  : value         Lower 90%    Upper 90%
kT [keV]    : 44.6126       (-16.7779      34.1085)
Norm        : 4.98848       (-1.34183     2.13306)
------------------------------------------------------------
#Fit statistic : Chi-Squared =          51.99 using 59 PHA bins.
# Reduced chi-squared =         0.9122 for     57 degrees of freedom
# Null hypothesis probability =   6.629160e-01

Energy  Fluence     90% Error
[keV]   [erg/cm2]   [erg/cm2]
15- 25  1.791e-08   3.723e-09
25- 50  2.465e-08   5.519e-09
50-150  2.140e-08   9.898e-09
15-150  6.397e-08   1.412e-08
Double BB

Spectral model: bbodyrad<1> + bbodyrad<2>
------------------------------------------------------------
Parameters  : value         Lower 90%    Upper 90%
kT1 [keV]   : 4.67189        (-1.21178      1.50012)
R1^2/D10^2  : 6.70886        (-4.57289      7.94811)
kT2 [keV]   : 21.3208        (-8.20256      22.3277)
R2^2/D10^2  : 1.42660E-02    (-0.012808   0.0755061)
------------------------------------------------------------
#Fit statistic : Chi-Squared =          47.99 using 59 PHA bins.
# Reduced chi-squared =         0.8726 for     55 degrees of freedom
# Null hypothesis probability =   7.371689e-01

Energy  Fluence     90% Error
[keV]   [erg/cm2]   [erg/cm2]
15- 25  2.049e-08   1.154e-08
25- 50  1.981e-08   1.052e-08
50-150  3.268e-08   1.969e-08
15-150  7.299e-08   3.970e-08
Peak spectrum fit
Power-law model

Time interval is from    0.172 sec. to    1.172 sec.

Spectral model in power-law:
------------------------------------------------------------
Parameters  : value       lower 90%   higher 90%
Photon index: 2.23226     ( -0.336411   0.380537 )
Norm@50keV  : 5.38541E-03    ( -0.00143247   0.00138874 )
------------------------------------------------------------
#Fit statistic : Chi-Squared =          66.21 using 59 PHA bins.
# Reduced chi-squared =          1.162 for     57 degrees of freedom
# Null hypothesis probability =   1.889799e-01

Photon flux (15-150 keV)    in 1 sec: 0.906968 ( -0.154364  0.154395 ) ph/cm2/s
Energy fluence (15-150 keV)             : 5.08761e-08 ( -1.10704e-08  1.16483e-08 ) ergs/cm2
Cutoff power-law model
Time interval is from    0.172 sec. to    1.172 sec.
Spectral model in the cutoff power-law:
------------------------------------------------------------
Parameters  : value       lower 90%   higher 90%
Photon index: 1.97739     (     )
Epeak [keV] : 3.55090      (   )
Norm@50keV  : 7.65208E-03    (     )
------------------------------------------------------------
#Fit statistic : Chi-Squared =          66.32 using 59 PHA bins.
# Reduced chi-squared =          1.184 for     56 degrees of freedom
# Null hypothesis probability =   1.628637e-01

Photon flux (15-150 keV)    in 1 sec: 0.907109 ( -0.157568  0.154051 ) ph/cm2/s
Energy fluence (15-150 keV)             : 5.04198e-08 ( -1.26212e-08  1.2011e-08 ) ergs/cm2
Band function

Time interval is from    0.172 sec. to    1.172 sec.

Spectral model in the Band function:
------------------------------------------------------------
Parameters  : value       lower 90%   higher 90%
alpha       : -2.64699   ( 2.64699   2.64699 )
beta        : -2.23226    ( -0.380537   0.336934 )
Epeak [keV] : 3.98444      ( -3.98444 -3.98444 )
Norm@50keV   : 0.731953    ( -0.194693   0.188749 )
------------------------------------------------------------
#Fit statistic : Chi-Squared =          66.21 using 59 PHA bins.
# Reduced chi-squared =          1.204 for     55 degrees of freedom
# Null hypothesis probability =   1.431469e-01

Photon flux (15-150 keV)    in 1 sec: 0.901859 (    ) ph/cm2/s
Energy fluence (15-150 keV)             : 0 ( 0  0 ) ergs/cm2
Single BB

Spectral model blackbody:
------------------------------------------------------------
Parameters  : value    Lower 90%  Upper 90%
kT [keV]    : 7.04573  (-1.3819  1.76734)
R^2/D10^2   : 1.63725  (-0.9763   2.3845)
(R is the radius in km and D10 is the distance to the source in units of 10 kpc)
------------------------------------------------------------
#Fit statistic : Chi-Squared =          75.12 using 59 PHA bins.
# Reduced chi-squared =          1.318 for     57 degrees of freedom
# Null hypothesis probability =   5.418624e-02

Energy  Fluence     90% Error
[keV]   [erg/cm2]   [erg/cm2]
15- 25  1.314e-08   4.082e-09
25- 50  1.823e-08   6.111e-09
50-150  3.093e-09   1.892e-09
15-150  3.447e-08   9.820e-09
Thermal bremsstrahlung (OTTB)

Spectral model: thermal bremsstrahlung
------------------------------------------------------------
Parameters  : value         Lower 90%    Upper 90%
kT [keV]    : 43.1070       (-16.9919      35.9869)
Norm        : 5.58730       (-1.62237     2.64414)
------------------------------------------------------------
#Fit statistic : Chi-Squared =          67.46 using 59 PHA bins.
# Reduced chi-squared =          1.183 for     57 degrees of freedom
# Null hypothesis probability =   1.619125e-01

Energy  Fluence     90% Error
[keV]   [erg/cm2]   [erg/cm2]
15- 25  1.314e-08   3.001e-09
25- 50  1.784e-08   4.400e-09
50-150  1.495e-08   8.603e-09
15-150  4.592e-08   1.211e-08
Double BB

Spectral model: bbodyrad<1> + bbodyrad<2>
------------------------------------------------------------
Parameters  : value         Lower 90%    Upper 90%
kT1 [keV]   : 5.09898        (-1.34738      1.55557)
R1^2/D10^2  : 5.15855        (-3.39486      6.05331)
kT2 [keV]   : 22.9171        (-9.71919      26.8199)
R2^2/D10^2  : 1.12677E-02    (-0.0102623   0.0790599)
------------------------------------------------------------
#Fit statistic : Chi-Squared =          64.15 using 59 PHA bins.
# Reduced chi-squared =          1.166 for     55 degrees of freedom
# Null hypothesis probability =   1.864178e-01

Energy  Fluence     90% Error
[keV]   [erg/cm2]   [erg/cm2]
15- 25  1.464e-08   8.185e-09
25- 50  1.511e-08   7.688e-09
50-150  2.324e-08   1.413e-08
15-150  5.298e-08   2.802e-08
Pre-slew spectrum (Pre-slew PHA with pre-slew DRM)
Power-law model

Spectral model in power-law:
------------------------------------------------------------
Parameters  : value       lower 90%   higher 90%
Photon index: 2.23046     ( -0.313109   0.349509 )
Norm@50keV  : 4.95524E-03    ( -0.00118635   0.0011448 )
------------------------------------------------------------
#Fit statistic : Chi-Squared =          49.33 using 59 PHA bins.
# Reduced chi-squared =         0.8655 for     57 degrees of freedom
# Null hypothesis probability =   7.548599e-01

Photon flux (15-150 keV)    in 1.512 sec: 0.833720 ( -0.126283  0.126293 ) ph/cm2/s
Energy fluence (15-150 keV)             : 7.07605e-08 ( -1.37796e-08  1.4421e-08 ) ergs/cm2
Cutoff power-law model

Spectral model in the cutoff power-law:
------------------------------------------------------------
Parameters  : value       lower 90%   higher 90%
Photon index: 2.39523     (     )
Epeak [keV] : 158.455      (   )
Norm@50keV  : 3.99158E-03    (     )
------------------------------------------------------------
#Fit statistic : Chi-Squared =          49.14 using 59 PHA bins.
# Reduced chi-squared =         0.8774 for     56 degrees of freedom
# Null hypothesis probability =   7.301907e-01

Photon flux (15-150 keV)    in 1.512 sec: 0.833402 (    ) ph/cm2/s
Energy fluence (15-150 keV)             : 7.04401e-08 ( -1.42789e-08  1.47387e-08 ) ergs/cm2
Band function

Spectral model in the Band function:
------------------------------------------------------------
Parameters  : value       lower 90%   higher 90%
alpha       : 5.00000   ( -4.99226   -4.99226 )
beta        : -2.29613    ( -0.53379   0.338826 )
Epeak [keV] : 17.8603      ( -17.2702 5.9731 )
Norm@50keV   : 9737.51    ( -1469.42   1.23899e+07 )
------------------------------------------------------------
#Fit statistic : Chi-Squared =          48.95 using 59 PHA bins.
# Reduced chi-squared =         0.8900 for     55 degrees of freedom
# Null hypothesis probability =   7.036640e-01

Photon flux (15-150 keV)    in 1.512 sec: 0.833400 ( 6.1666  -0.12623 ) ph/cm2/s
Energy fluence (15-150 keV)             : 0 ( 0  0 ) ergs/cm2
S(25-50 keV) vs. S(50-100 keV) plot

S(25-50 keV)  = 2.26e-08
S(50-100 keV) = 1.92e-08
T90 vs. Hardness ratio plot
T90                                   = 1.35999995470047 sec.
Hardness ratio (energy fluence ratio) = 0.849558
Color vs. Color plot
Count Ratio  (25-50 keV) / (15-25 keV) = 0.753522
Count Ratio (50-100 keV) / (15-25 keV) = 0.453963
Mask shadow pattern

IMX = -2.396429390421482E-01, IMY = 5.170811366039454E-02
TIME vs. PHA plot around the trigger time

Blue+Cyan dotted lines: Time interval of the scaled map
From 0.000000 to 1.024000
TIME vs. DetID plot around the trigger time

Blue+Cyan dotted lines: Time interval of the scaled map
From 0.000000 to 1.024000
100 us light curve (15-350 keV)

Blue+Cyan dotted lines: Time interval of the scaled map
From 0.000000 to 1.024000
Spacecraft aspect plot

Bright source in the pre-burst/pre-slew/post-slew images
Pre-burst image of 15-350 keV band
Time interval of the image:
-239.024000 0.076000

# RAcent  DECcent POSerr Theta    Phi  PeakCts   SNR AngSep     Name
#  [deg]    [deg]    ['] [deg]  [deg]                   [']
254.2823  35.3533  685.5  48.0   22.0   0.0114   0.0    8.6	Her X-1
268.3922  -1.4970   20.9  52.0  -29.6   0.3624   0.6    3.0	SW J1753.5-0127
288.8218  10.9649    0.9  28.6  -37.2   3.5000  13.2    1.8	GRS 1915+105
299.5899  35.2132    1.5  11.5   29.8   1.6244   7.6    0.7	Cyg X-1
308.0879  40.9509    1.1  11.3   75.6   2.2732  10.1    1.0	Cyg X-3
326.0071  38.3209    8.2  14.4  140.8   0.3163   1.4    7.7	Cyg X-2
323.9530  52.4656    2.3  24.2  108.1   1.5176   5.0 ------	UNKNOWN
258.9432  31.7826    2.8  44.9   16.1   1.8256   4.1 ------	UNKNOWN
255.0908  25.6421    2.6  49.8    9.3   2.7224   4.4 ------	UNKNOWN
261.4971  26.3331    2.5  44.1    7.8   1.8100   4.6 ------	UNKNOWN
Pre-slew background subtracted image of 15-350 keV band
Time interval of the image:
0.076000 1.588000

# RAcent  DECcent POSerr Theta    Phi  PeakCts   SNR AngSep     Name
#  [deg]    [deg]    ['] [deg]  [deg]                   [']
254.5009  35.4477    3.7  47.8   22.1   0.1348   3.1    6.7	Her X-1
268.5054  -1.4368    4.4  51.8  -29.7  -0.1138  -2.6    8.3	SW J1753.5-0127
288.8396  10.9682    6.6  28.6  -37.2   0.0316   1.7    2.8	GRS 1915+105
299.4027  35.2333   17.3  11.6   29.6   0.0096   0.7    9.4	Cyg X-1
308.0079  41.0996    6.3  11.5   75.5  -0.0287  -1.8   10.0	Cyg X-3
326.3828  38.4434    0.0  14.7  141.0  -0.0179  -1.1   12.3	Cyg X-2
267.3888  53.0590    1.8  39.5   48.4   0.2229   6.4 ------	UNKNOWN
313.2394  60.3281    2.1  30.3   91.2   0.1380   5.4 ------	UNKNOWN
326.7640  26.2147    1.1  13.8 -167.8   0.1590  10.9 ------	UNKNOWN
Post-slew image of 15-350 keV band
Time interval of the image:
50.876600 963.026200

# RAcent  DECcent POSerr Theta    Phi  PeakCts   SNR AngSep     Name
#  [deg]    [deg]    ['] [deg]  [deg]                   [']
288.7975  10.9371    0.9  38.9  -35.3  12.6364  13.3    0.5	GRS 1915+105
299.5972  35.1897    1.2  24.9    8.3   6.5042   9.7    0.8	Cyg X-1
308.1038  40.9674    0.8  21.3   29.0   9.3281  13.7    0.9	Cyg X-3
326.1380  38.2304    4.7  12.0   68.3  -1.4258  -2.4    5.7	Cyg X-2
279.5364  60.6471    4.9  46.9   41.1   6.7762   2.4 ------	UNKNOWN
272.0986  18.2604    3.1  50.9  -16.6   5.0836   3.7 ------	UNKNOWN
266.6173  15.3665    3.8  56.8  -17.7   7.6670   3.0 ------	UNKNOWN
319.0853 -14.2760    5.6  41.2  -98.1   8.4250   2.1 ------	UNKNOWN
Plot creation:
Sat May 30 14:34:31 EDT 2015