Special notes of this burst
Image
Pre-slew 15.0-350.0 keV image (Event data)
#   RAcent    DECcent   POSerr    Theta     Phi              Peak Cts       SNR   Name
  105.1675   -73.1361   0.0035    24.4015   104.8759        21.0133874     55.538 TRIG_00586569

Foreground time interval of the image:
 -5.700  82.040 (delta_t =  87.740 [sec])
Background time interval of the image:
-67.275  -5.700 (delta_t =  61.575 [sec])
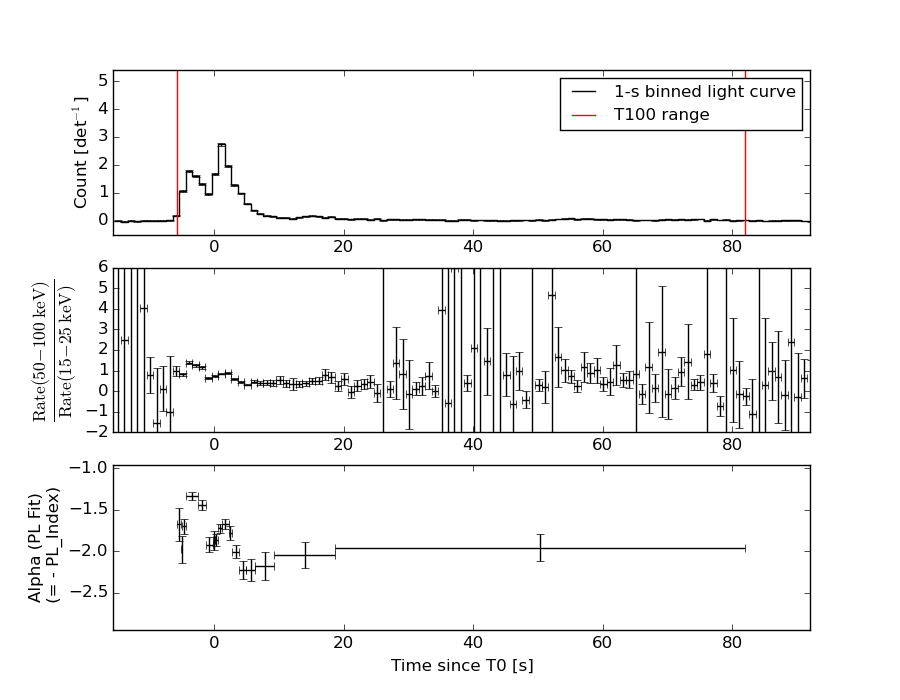
Lightcurves
Notes:
- 1) The mask-weighted light curves are using the flight position.
- 2) Multiple plots of different time binning/intervals are shown to cover all scenarios of short/long GRBs, rate/image triggers, and real/false positives.
- 3) For all the mask-weighted lightcurves, the y-axis units are counts/sec/det where a det is 0.4 x 0.4 = 0.16 sq cm.
- 4) The verticle lines correspond to following: green dotted lines are T50 interval, black dotted lines are T90 interval, blue solid line(s) is a spacecraft slew start time, and orange solid line(s) is a spacecraft slew end time.
- 5) Time of each bin is in the middle of the bin.
1 s binning
From T0-310 s to T0+310 s

From T100_start - 20 s to T100_end + 30 s

Full time interval
64 ms binning
Full time interval

From T100_start to T100_end

From T0-5 sec to T0+5 sec
16 ms binning
From T100_start-5 s to T100_start+5 s
Blue+Cyan dotted lines: Time interval of the scaled map
From 0.000000 to 1.024000
8 ms binning
From T100_start-3 s to T100_start+3 s

Blue+Cyan dotted lines: Time interval of the scaled map
From 0.000000 to 1.024000
2 ms binning
From T100_start-1 s to T100_start+1 s

Blue+Cyan dotted lines: Time interval of the scaled map
From 0.000000 to 1.024000
SN=5 or 10 sec. binning (whichever binning is satisfied first)

SN=5 or 10 sec. binning (T < 200 sec)

Quad-rate summed light curves (from T0-300s to T0+1000s)
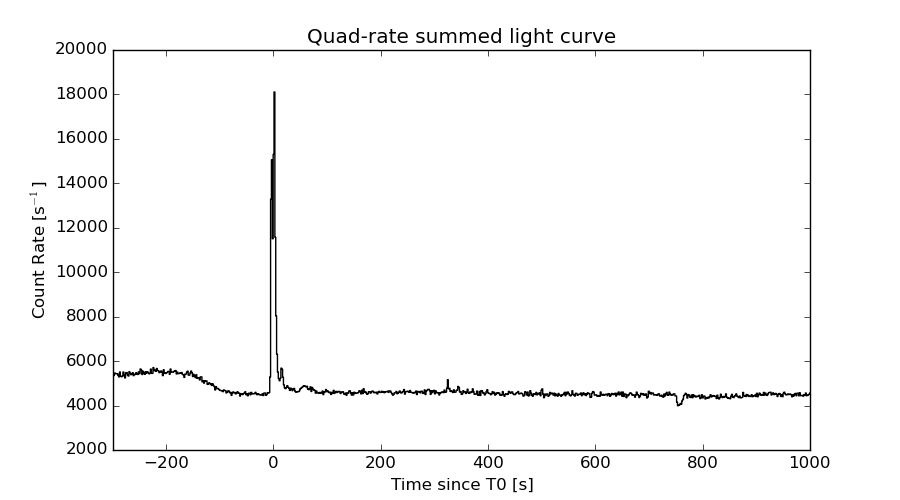
The mask-weighted light curves based on cleaned DPHs

Spectral Evolution
Spectra
Notes:
- 1) The fitting includes the systematic errors.
- 2) When the burst includes telescope slew time periods, the fitting uses an average response file made from multiple 5-s response files through out the slew time plus single time preiod for the non-slew times, and weighted by the total counts in the corresponding time period using addrmf. An average response file is needed becuase a spectral fit using the pre-slew DRM will introduce some errors in both a spectral shape and a normalization if the PHA file contains a lot of the slew/post-slew time interval.
- 3) For fits to more complicated models (e.g. a power-law over a cutoff power-law), the BAT team has decided to require a chi-square improvement of more than 6 for each extra dof.
Time averaged spectrum fit using the average DRM
Power-law model

Time interval is from   -5.700 sec. to   82.040 sec.

Spectral model in power-law:
------------------------------------------------------------
Parameters  : value       lower 90%   higher 90%
Photon index: 1.79738     ( -0.0393692   0.0394351 )
Norm@50keV  : 1.48505E-02    ( -0.000294644   0.0002946 )
------------------------------------------------------------
#Fit statistic : Chi-Squared =          64.97 using 59 PHA bins.
# Reduced chi-squared =          1.140 for     57 degrees of freedom
# Null hypothesis probability =   2.188500e-01

Photon flux (15-150 keV)    in 87.74 sec: 2.04429 ( -0.0489042  0.0491518 ) ph/cm2/s
Energy fluence (15-150 keV)             : 1.19964e-05 ( -2.40015e-07  2.40087e-07 ) ergs/cm2
Cutoff power-law model

Time interval is from   -5.700 sec. to   82.040 sec.
Spectral model in the cutoff power-law:
------------------------------------------------------------
Parameters  : value       lower 90%   higher 90%
Photon index: 1.61632     ( -0.162889   0.157111 )
Epeak [keV] : 113.714      ( -29.9013 317.506 )
Norm@50keV  : 1.80114E-02    ( -0.00271027   0.00332512 )
------------------------------------------------------------
#Fit statistic : Chi-Squared =          61.10 using 59 PHA bins.
# Reduced chi-squared =          1.091 for     56 degrees of freedom
# Null hypothesis probability =   2.977420e-01

Photon flux (15-150 keV)    in 87.74 sec: 2.00869 ( -0.05677  0.05717 ) ph/cm2/s
Energy fluence (15-150 keV)             : 1.18327e-05 ( -2.80768e-07  2.7954e-07 ) ergs/cm2
Band function
Time interval is from   -5.700 sec. to   82.040 sec.

Spectral model in the Band function:
------------------------------------------------------------
Parameters  : value       lower 90%   higher 90%
alpha       : -0.760586   ( -0.623939   3.81656 )
beta        : -1.87506    ( -0.0791856   0.0657468 )
Epeak [keV] : 43.0348      ( -17.7115 30.1977 )
Norm@50keV   : 6.16213E-02    ( -0.0388473   11.4061 )
------------------------------------------------------------
#Fit statistic : Chi-Squared =          54.73 using 59 PHA bins.
# Reduced chi-squared =         0.9951 for     55 degrees of freedom
# Null hypothesis probability =   4.849079e-01

Photon flux (15-150 keV)    in 87.74 sec:  (    ) ph/cm2/s
Energy fluence (15-150 keV)             : 1.1715e-05 ( -1.17144e-05  -2.77346e-07 ) ergs/cm2
Single BB

Spectral model blackbody:
------------------------------------------------------------
Parameters  : value    Lower 90%  Upper 90%
kT [keV]    : 14.4795  (  )
R^2/D10^2   : 0.227775  (   )
(R is the radius in km and D10 is the distance to the source in units of 10 kpc)
------------------------------------------------------------
#Fit statistic : Chi-Squared =         601.61 using 59 PHA bins.
# Reduced chi-squared =         10.555 for     57 degrees of freedom
# Null hypothesis probability =   6.271901e-92

Energy  Fluence     90% Error
[keV]   [erg/cm2]   [erg/cm2]
15- 25  8.818e-07   3.703e-08
25- 50  3.389e-06   1.005e-07
50-150  4.758e-06   1.768e-07
15-150  9.028e-06   1.974e-07
Thermal bremsstrahlung (OTTB)

Spectral model: thermal bremsstrahlung
------------------------------------------------------------
Parameters  : value         Lower 90%    Upper 90%
kT [keV]    : 119.976       (      )
Norm        : 8.45140       (-0.320667     0.238209)
------------------------------------------------------------
#Fit statistic : Chi-Squared =          71.23 using 59 PHA bins.
# Reduced chi-squared =          1.250 for     57 degrees of freedom
# Null hypothesis probability =   9.738264e-02

Energy  Fluence     90% Error
[keV]   [erg/cm2]   [erg/cm2]
15- 25  1.871e-06   9.169e-08
25- 50  3.384e-06   1.290e-07
50-150  6.228e-06   1.280e-06
15-150  1.148e-05   1.347e-06
Double BB

Spectral model: bbodyrad<1> + bbodyrad<2>
------------------------------------------------------------
Parameters  : value         Lower 90%    Upper 90%
kT1 [keV]   : 7.77384        (-0.539722      0.559988)
R1^2/D10^2  : 1.63879        (-0.346123      0.472456)
kT2 [keV]   : 27.9589        (-2.47359      3.16035)
R2^2/D10^2  : 1.50147E-02    (-0.0048447   0.00631617)
------------------------------------------------------------
#Fit statistic : Chi-Squared =          72.80 using 59 PHA bins.
# Reduced chi-squared =          1.324 for     55 degrees of freedom
# Null hypothesis probability =   5.428641e-02

Energy  Fluence     90% Error
[keV]   [erg/cm2]   [erg/cm2]
15- 25  1.705e-06   1.070e-07
25- 50  3.564e-06   1.220e-07
50-150  6.300e-06   3.659e-07
15-150  1.157e-05   5.221e-07
Peak spectrum fit
Power-law model

Time interval is from    0.556 sec. to    1.556 sec.

Spectral model in power-law:
------------------------------------------------------------
Parameters  : value       lower 90%   higher 90%
Photon index: 1.71209     ( -0.0524164   0.0526716 )
Norm@50keV  : 0.176559    ( -0.0051899   0.00518523 )
------------------------------------------------------------
#Fit statistic : Chi-Squared =          61.17 using 59 PHA bins.
# Reduced chi-squared =          1.073 for     57 degrees of freedom
# Null hypothesis probability =   3.287060e-01

Photon flux (15-150 keV)    in 1 sec: 23.5490 ( -0.750213  0.752176 ) ph/cm2/s
Energy fluence (15-150 keV)             : 1.63323e-06 ( -4.94555e-08  4.95075e-08 ) ergs/cm2
Cutoff power-law model

Time interval is from    0.556 sec. to    1.556 sec.
Spectral model in the cutoff power-law:
------------------------------------------------------------
Parameters  : value       lower 90%   higher 90%
Photon index: 1.45680     ( -0.21342   0.203606 )
Epeak [keV] : 111.325      ( -28.638 201.123 )
Norm@50keV  : 0.234637    ( -0.0464723   0.0613897 )
------------------------------------------------------------
#Fit statistic : Chi-Squared =          56.53 using 59 PHA bins.
# Reduced chi-squared =          1.010 for     56 degrees of freedom
# Null hypothesis probability =   4.549127e-01

Photon flux (15-150 keV)    in 1 sec: 23.1667 ( -0.8017  0.8047 ) ph/cm2/s
Energy fluence (15-150 keV)             : 1.60862e-06 ( 0  0 ) ergs/cm2
Band function

Time interval is from    0.556 sec. to    1.556 sec.

Spectral model in the Band function:
------------------------------------------------------------
Parameters  : value       lower 90%   higher 90%
alpha       : -0.231612   ( -1.14856   3.28821 )
beta        : -1.83276    ( -0.0949074   0.0830454 )
Epeak [keV] : 41.0295      ( -9.40175 11.1854 )
Norm@50keV   : 1.45134    ( -2.76147   420.152 )
------------------------------------------------------------
#Fit statistic : Chi-Squared =          47.20 using 59 PHA bins.
# Reduced chi-squared =         0.8582 for     55 degrees of freedom
# Null hypothesis probability =   7.634719e-01

Photon flux (15-150 keV)    in 1 sec:  (    ) ph/cm2/s
Energy fluence (15-150 keV)             : 1.59073e-06 ( 0  0 ) ergs/cm2
Single BB
Spectral model blackbody:
------------------------------------------------------------
Parameters  : value    Lower 90%  Upper 90%
kT [keV]    : 14.0303  (  )
R^2/D10^2   : 3.14373  (   )
(R is the radius in km and D10 is the distance to the source in units of 10 kpc)
------------------------------------------------------------
#Fit statistic : Chi-Squared =         337.35 using 59 PHA bins.
# Reduced chi-squared =         5.9184 for     57 degrees of freedom
# Null hypothesis probability =   2.028766e-41

Energy  Fluence     90% Error
[keV]   [erg/cm2]   [erg/cm2]
15- 25  1.307e-07   8.200e-09
25- 50  4.871e-07   1.920e-08
50-150  6.321e-07   3.805e-08
15-150  1.250e-06   3.950e-08
Thermal bremsstrahlung (OTTB)

Spectral model: thermal bremsstrahlung
------------------------------------------------------------
Parameters  : value         Lower 90%    Upper 90%
kT [keV]    : 143.567       (      )
Norm        : 96.3254       (-3.48289     4.28578)
------------------------------------------------------------
#Fit statistic : Chi-Squared =          57.92 using 59 PHA bins.
# Reduced chi-squared =          1.016 for     57 degrees of freedom
# Null hypothesis probability =   4.412885e-01

Energy  Fluence     90% Error
[keV]   [erg/cm2]   [erg/cm2]
15- 25  2.462e-07   1.450e-08
25- 50  4.545e-07   2.320e-08
50-150  8.869e-07   2.034e-07
15-150  1.588e-06   2.150e-07
Double BB

Spectral model: bbodyrad<1> + bbodyrad<2>
------------------------------------------------------------
Parameters  : value         Lower 90%    Upper 90%
kT1 [keV]   : 8.12816        (-0.681605      0.703886)
R1^2/D10^2  : 16.7883        (-3.98907      5.68874)
kT2 [keV]   : 30.7208        (-3.7974      5.36797)
R2^2/D10^2  : 0.132142    (-0.056437   0.08268)
------------------------------------------------------------
#Fit statistic : Chi-Squared =          50.92 using 59 PHA bins.
# Reduced chi-squared =         0.9258 for     55 degrees of freedom
# Null hypothesis probability =   6.312147e-01

Energy  Fluence     90% Error
[keV]   [erg/cm2]   [erg/cm2]
15- 25  2.221e-07   1.960e-08
25- 50  4.847e-07   2.395e-08
50-150  8.916e-07   1.007e-07
15-150  1.598e-06   1.320e-07
Pre-slew spectrum (Pre-slew PHA with pre-slew DRM)
Power-law model

Spectral model in power-law:
------------------------------------------------------------
Parameters  : value       lower 90%   higher 90%
Photon index: 1.79738     ( -0.0393692   0.0394351 )
Norm@50keV  : 1.48505E-02    ( -0.000294644   0.0002946 )
------------------------------------------------------------
#Fit statistic : Chi-Squared =          64.97 using 59 PHA bins.
# Reduced chi-squared =          1.140 for     57 degrees of freedom
# Null hypothesis probability =   2.188500e-01

Photon flux (15-150 keV)    in 87.74 sec: 2.04429 ( -0.0489042  0.0491518 ) ph/cm2/s
Energy fluence (15-150 keV)             : 1.19964e-05 ( -2.40015e-07  2.40087e-07 ) ergs/cm2
Cutoff power-law model

Spectral model in the cutoff power-law:
------------------------------------------------------------
Parameters  : value       lower 90%   higher 90%
Photon index: 1.61632     ( -0.162889   0.157111 )
Epeak [keV] : 113.714      ( -29.9013 317.506 )
Norm@50keV  : 1.80114E-02    ( -0.00271027   0.00332512 )
------------------------------------------------------------
#Fit statistic : Chi-Squared =          61.10 using 59 PHA bins.
# Reduced chi-squared =          1.091 for     56 degrees of freedom
# Null hypothesis probability =   2.977420e-01

Photon flux (15-150 keV)    in 87.74 sec: 2.00869 ( -0.05677  0.05717 ) ph/cm2/s
Energy fluence (15-150 keV)             : 1.18327e-05 ( -2.80768e-07  2.7954e-07 ) ergs/cm2
Band function

Spectral model in the Band function:
------------------------------------------------------------
Parameters  : value       lower 90%   higher 90%
alpha       : -0.760586   ( -0.623939   3.81656 )
beta        : -1.87506    ( -0.0791856   0.0657468 )
Epeak [keV] : 43.0348      ( -17.7115 30.1977 )
Norm@50keV   : 6.16213E-02    ( -0.0388473   11.4061 )
------------------------------------------------------------
#Fit statistic : Chi-Squared =          54.73 using 59 PHA bins.
# Reduced chi-squared =         0.9951 for     55 degrees of freedom
# Null hypothesis probability =   4.849079e-01

Photon flux (15-150 keV)    in 87.74 sec:  (    ) ph/cm2/s
Energy fluence (15-150 keV)             : 1.1715e-05 ( -1.17144e-05  -2.77346e-07 ) ergs/cm2
S(25-50 keV) vs. S(50-100 keV) plot

S(25-50 keV)  = 3.37e-06
S(50-100 keV) = 3.88e-06
T90 vs. Hardness ratio plot
T90                                   = 59.9319999217987 sec.
Hardness ratio (energy fluence ratio) = 1.15134
Color vs. Color plot

Count Ratio  (25-50 keV) / (15-25 keV) = 1.23436
Count Ratio (50-100 keV) / (15-25 keV) = 0.747834
Mask shadow pattern

IMX = -1.164643576975149E-01, IMY = -4.384465034381541E-01
TIME vs. PHA plot around the trigger time

Blue+Cyan dotted lines: Time interval of the scaled map
From 0.000000 to 1.024000
TIME vs. DetID plot around the trigger time

Blue+Cyan dotted lines: Time interval of the scaled map
From 0.000000 to 1.024000
100 us light curve (15-350 keV)
Blue+Cyan dotted lines: Time interval of the scaled map
From 0.000000 to 1.024000
Spacecraft aspect plot

Bright source in the pre-burst/pre-slew/post-slew images
Pre-burst image of 15-350 keV band
Time interval of the image:
-67.275410 -5.700000

# RAcent  DECcent POSerr Theta    Phi  PeakCts   SNR AngSep     Name
#  [deg]    [deg]    ['] [deg]  [deg]                   [']
170.2920 -60.5724   43.1  46.0  133.4  -0.1200  -0.3    3.1	Cen X-3
187.0775 -62.7620    4.7  44.8  144.9   0.6957   2.4   11.6	GX 301-2
264.6981 -44.3630    4.1  53.5 -153.6   0.9115   2.8    5.6	4U 1735-44
101.2932 -53.6004    3.0  39.1   79.4   1.5036   3.9 ------	UNKNOWN
 44.1437 -64.2920    2.5  13.5   37.9   0.4294   4.6 ------	UNKNOWN
 34.8569 -34.1087    2.7  39.8   -3.3   0.5682   4.3 ------	UNKNOWN
Pre-slew background subtracted image of 15-350 keV band
Time interval of the image:
-5.700000 82.040000

# RAcent  DECcent POSerr Theta    Phi  PeakCts   SNR AngSep     Name
#  [deg]    [deg]    ['] [deg]  [deg]                   [']
169.8898 -60.5712    2.8  46.0  133.2  -5.9212  -4.1   12.9	Cen X-3
187.1001 -62.7527    4.0  44.8  144.9  -2.5718  -2.9   12.2	GX 301-2
264.7387 -44.4239    7.0  53.5 -153.6  -1.4305  -1.7    1.6	4U 1735-44
 65.4830 -40.2176    2.2  40.6   35.9   2.9792   5.3 ------	UNKNOWN
105.1675 -73.1361    0.2  24.4  104.9  21.0124  55.5 ------	UNKNOWN
 47.1374 -25.5373    2.8  50.2    9.2   2.7854   4.1 ------	UNKNOWN
341.0924 -51.4534    3.2  25.4  -83.0   1.0097   3.6 ------	UNKNOWN
Post-slew image of 15-350 keV band
Time interval of the image:
924.924600 962.620100

# RAcent  DECcent POSerr Theta    Phi  PeakCts   SNR AngSep     Name
#  [deg]    [deg]    ['] [deg]  [deg]                   [']
299.5115  35.2281    3.3  48.8  -39.5   0.7498   3.5    4.2	Cyg X-1
308.3125  40.9237    8.7  40.2  -43.2   0.1663   1.3    9.3	Cyg X-3
326.2731  38.3697   17.4  34.9  -64.6   0.0824   0.7    5.6	Cyg X-2
281.3119  32.6784    1.7  58.9  -25.2   2.9379   6.6 ------	UNKNOWN
Plot creation:
Mon Jun  8 22:38:16 EDT 2015