Click here for the BAT GCN circular template
Image
Pre-slew 15.0-350.0 keV image (Event data)
#   RAcent    DECcent   POSerr    Theta     Phi              Peak Cts       SNR   Name
   30.6491    33.4730   0.0058    25.1962   152.4356         1.6941248     33.359 TRIG_00590206

Foreground time interval of the image:
 -3.820  13.492 (delta_t =  17.312 [sec])
Background time interval of the image:
-119.816  -3.820 (delta_t = 115.996 [sec])
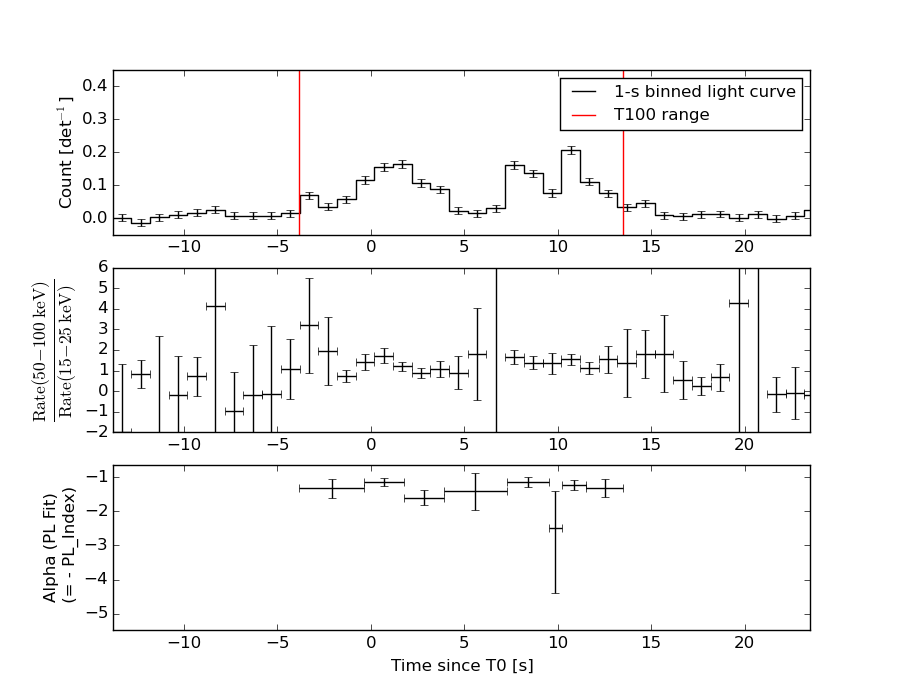
Lightcurves
Notes:
- 1) The mask-weighted light curves are using the flight position.
- 2) Multiple plots of different time binning/intervals are shown to cover all scenarios of short/long GRBs, rate/image triggers, and real/false positives.
- 3) For all the mask-weighted lightcurves, the y-axis units are counts/sec/det where a det is 0.4 x 0.4 = 0.16 sq cm.
- 4) The verticle lines correspond to following: green dotted lines are T50 interval, black dotted lines are T90 interval, blue solid line(s) is a spacecraft slew start time, and orange solid line(s) is a spacecraft slew end time.
- 5) Time of each bin is in the middle of the bin.
1 s binning
From T0-310 s to T0+310 s

From T100_start - 20 s to T100_end + 30 s
Full time interval

64 ms binning
Full time interval

From T100_start to T100_end

From T0-5 sec to T0+5 sec
16 ms binning
From T100_start-5 s to T100_start+5 s
Blue+Cyan dotted lines: Time interval of the scaled map
From 0.000000 to 1.024000
8 ms binning
From T100_start-3 s to T100_start+3 s

Blue+Cyan dotted lines: Time interval of the scaled map
From 0.000000 to 1.024000
2 ms binning
From T100_start-1 s to T100_start+1 s
Blue+Cyan dotted lines: Time interval of the scaled map
From 0.000000 to 1.024000
SN=5 or 10 sec. binning (whichever binning is satisfied first)

SN=5 or 10 sec. binning (T < 200 sec)

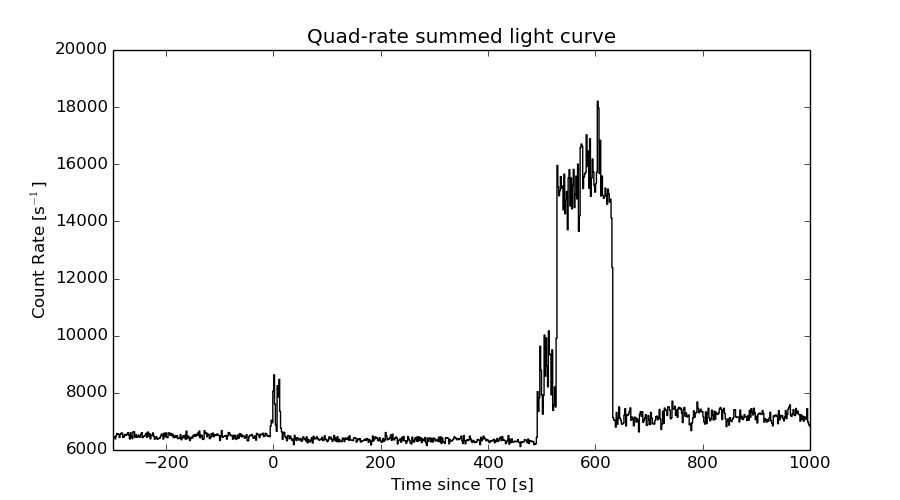
Quad-rate summed light curves (from T0-300s to T0+1000s)
Spectral Evolution
Spectra
Notes:
- 1) The fitting includes the systematic errors.
- 2) When the burst includes telescope slew time periods, the fitting uses an average response file made from multiple 5-s response files through out the slew time plus single time preiod for the non-slew times, and weighted by the total counts in the corresponding time period using addrmf. An average response file is needed becuase a spectral fit using the pre-slew DRM will introduce some errors in both a spectral shape and a normalization if the PHA file contains a lot of the slew/post-slew time interval.
- 3) For fits to more complicated models (e.g. a power-law over a cutoff power-law), the BAT team has decided to require a chi-square improvement of more than 6 for each extra dof.
Time averaged spectrum fit using the average DRM
Power-law model

Time interval is from   -3.820 sec. to   13.492 sec.

Spectral model in power-law:
------------------------------------------------------------
Parameters  : value       lower 90%   higher 90%
Photon index: 1.29945     ( -0.0811009   0.0806595 )
Norm@50keV  : 6.59113E-03    ( -0.000304275   0.000304275 )
------------------------------------------------------------
#Fit statistic : Chi-Squared =          60.75 using 59 PHA bins.
# Reduced chi-squared =          1.066 for     57 degrees of freedom
# Null hypothesis probability =   3.422755e-01

Photon flux (15-150 keV)    in 17.31 sec: 0.786260 ( -0.0380404  0.0381027 ) ph/cm2/s
Energy fluence (15-150 keV)             : 1.12759e-06 ( -5.66246e-08  5.68002e-08 ) ergs/cm2
Cutoff power-law model

Time interval is from   -3.820 sec. to   13.492 sec.
Spectral model in the cutoff power-law:
------------------------------------------------------------
Parameters  : value       lower 90%   higher 90%
Photon index: 0.846811     ( -0.344958   0.319226 )
Epeak [keV] : 136.898      ( -37.3651 180.945 )
Norm@50keV  : 1.07936E-02    ( -0.00309843   0.0047431 )
------------------------------------------------------------
#Fit statistic : Chi-Squared =          54.70 using 59 PHA bins.
# Reduced chi-squared =         0.9767 for     56 degrees of freedom
# Null hypothesis probability =   5.243072e-01

Photon flux (15-150 keV)    in 17.31 sec: 0.768997 ( -0.039854  0.039878 ) ph/cm2/s
Energy fluence (15-150 keV)             : 1.0962e-06 ( -6.17413e-08  6.14263e-08 ) ergs/cm2
Band function
Time interval is from   -3.820 sec. to   13.492 sec.

Spectral model in the Band function:
------------------------------------------------------------
Parameters  : value       lower 90%   higher 90%
alpha       : -0.846685   ( -0.261801   0.207975 )
beta        : -10.0000    ( 10   3.55271e-15 )
Epeak [keV] : 136.859      ( -22.9185 180.875 )
Norm@50keV   : 1.07943E-02    ( -0.00309988   0.00474299 )
------------------------------------------------------------
#Fit statistic : Chi-Squared =          54.70 using 59 PHA bins.
# Reduced chi-squared =         0.9945 for     55 degrees of freedom
# Null hypothesis probability =   4.861774e-01

Photon flux (15-150 keV)    in 17.31 sec: 0.772786 (    ) ph/cm2/s
Energy fluence (15-150 keV)             : 0 ( 0  0 ) ergs/cm2
Single BB

Spectral model blackbody:
------------------------------------------------------------
Parameters  : value    Lower 90%  Upper 90%
kT [keV]    : 17.8386  (  )
R^2/D10^2   : 5.13051E-02  (   )
(R is the radius in km and D10 is the distance to the source in units of 10 kpc)
------------------------------------------------------------
#Fit statistic : Chi-Squared =         131.27 using 59 PHA bins.
# Reduced chi-squared =         2.3030 for     57 degrees of freedom
# Null hypothesis probability =   8.620008e-08

Energy  Fluence     90% Error
[keV]   [erg/cm2]   [erg/cm2]
15- 25  5.674e-08   5.617e-09
25- 50  2.607e-07   1.662e-08
50-150  6.006e-07   4.959e-08
15-150  9.181e-07   5.453e-08
Thermal bremsstrahlung (OTTB)
Spectral model: thermal bremsstrahlung
------------------------------------------------------------
Parameters  : value         Lower 90%    Upper 90%
kT [keV]    : 200.000       (      )
Norm        : 3.29173       (-0.153421     0.153387)
------------------------------------------------------------
#Fit statistic : Chi-Squared =          83.88 using 59 PHA bins.
# Reduced chi-squared =          1.472 for     57 degrees of freedom
# Null hypothesis probability =   1.176797e-02

Energy  Fluence     90% Error
[keV]   [erg/cm2]   [erg/cm2]
15- 25  1.419e-07   7.357e-09
25- 50  2.730e-07   1.437e-08
50-150  5.988e-07   3.159e-08
15-150  1.014e-06   5.357e-08
Double BB

Spectral model: bbodyrad<1> + bbodyrad<2>
------------------------------------------------------------
Parameters  : value         Lower 90%    Upper 90%
kT1 [keV]   : 8.30649        (-1.43661      1.60482)
R1^2/D10^2  : 0.389333        (-0.156929      0.313081)
kT2 [keV]   : 29.8764        (-4.63095      7.81836)
R2^2/D10^2  : 7.24197E-03    (-0.00395925   0.00605902)
------------------------------------------------------------
#Fit statistic : Chi-Squared =          52.81 using 59 PHA bins.
# Reduced chi-squared =         0.9603 for     55 degrees of freedom
# Null hypothesis probability =   5.586101e-01

Energy  Fluence     90% Error
[keV]   [erg/cm2]   [erg/cm2]
15- 25  1.039e-07   2.079e-08
25- 50  2.692e-07   4.137e-08
50-150  7.303e-07   1.689e-07
15-150  1.103e-06   2.042e-07
Peak spectrum fit
Power-law model

Time interval is from   10.224 sec. to   11.224 sec.

Spectral model in power-law:
------------------------------------------------------------
Parameters  : value       lower 90%   higher 90%
Photon index: 1.24562     ( -0.159683   0.158425 )
Norm@50keV  : 1.40582E-02    ( -0.00135001   0.00134911 )
------------------------------------------------------------
#Fit statistic : Chi-Squared =          49.05 using 59 PHA bins.
# Reduced chi-squared =         0.8605 for     57 degrees of freedom
# Null hypothesis probability =   7.640455e-01

Photon flux (15-150 keV)    in 1 sec: 1.66153 ( -0.162471  0.162638 ) ph/cm2/s
Energy fluence (15-150 keV)             : 1.40857e-07 ( -1.50153e-08  1.51141e-08 ) ergs/cm2
Cutoff power-law model
Time interval is from   10.224 sec. to   11.224 sec.
Spectral model in the cutoff power-law:
------------------------------------------------------------
Parameters  : value       lower 90%   higher 90%
Photon index: 0.791383     ( -0.668277   0.523309 )
Epeak [keV] : 139.661      ( -55.5801 -139.661 )
Norm@50keV  : 2.34854E-02    ( -0.0101382   0.025281 )
------------------------------------------------------------
#Fit statistic : Chi-Squared =          47.27 using 59 PHA bins.
# Reduced chi-squared =         0.8442 for     56 degrees of freedom
# Null hypothesis probability =   7.903997e-01

Photon flux (15-150 keV)    in 1 sec: 1.63828 ( -0.16542  0.16538 ) ph/cm2/s
Energy fluence (15-150 keV)             : 1.37209e-07 ( -1.6154e-08  1.6005e-08 ) ergs/cm2
Band function
Time interval is from   10.224 sec. to   11.224 sec.

Spectral model in the Band function:
------------------------------------------------------------
Parameters  : value       lower 90%   higher 90%
alpha       : 4.94439   ( -14.2123   -4.94439 )
beta        : -1.44273    ( -0.255386   0.204893 )
Epeak [keV] : 30.9181      ( -6.81503 4.97214 )
Norm@50keV   : 326.542    ( -31.0172   1202.34 )
------------------------------------------------------------
#Fit statistic : Chi-Squared =          43.87 using 59 PHA bins.
# Reduced chi-squared =         0.7977 for     55 degrees of freedom
# Null hypothesis probability =   8.594345e-01

Photon flux (15-150 keV)    in 1 sec: 1.63225 ( 5.36775  -0.16282 ) ph/cm2/s
Energy fluence (15-150 keV)             : 0 ( 0  0 ) ergs/cm2
Single BB
Spectral model blackbody:
------------------------------------------------------------
Parameters  : value    Lower 90%  Upper 90%
kT [keV]    : 17.6828  (-2.22992  2.62515)
R^2/D10^2   : 0.114788  (-0.0424506   0.0657531)
(R is the radius in km and D10 is the distance to the source in units of 10 kpc)
------------------------------------------------------------
#Fit statistic : Chi-Squared =          68.42 using 59 PHA bins.
# Reduced chi-squared =          1.200 for     57 degrees of freedom
# Null hypothesis probability =   1.430084e-01

Energy  Fluence     90% Error
[keV]   [erg/cm2]   [erg/cm2]
15- 25  7.227e-09   1.336e-09
25- 50  3.297e-08   5.030e-09
50-150  7.449e-08   1.412e-08
15-150  1.147e-07   1.579e-08
Thermal bremsstrahlung (OTTB)

Spectral model: thermal bremsstrahlung
------------------------------------------------------------
Parameters  : value         Lower 90%    Upper 90%
kT [keV]    : 200.000       (      )
Norm        : 6.85832       (-0.666706     0.666675)
------------------------------------------------------------
#Fit statistic : Chi-Squared =          57.32 using 59 PHA bins.
# Reduced chi-squared =          1.006 for     57 degrees of freedom
# Null hypothesis probability =   4.631918e-01

Energy  Fluence     90% Error
[keV]   [erg/cm2]   [erg/cm2]
15- 25  1.707e-08   7.586e-09
25- 50  3.285e-08   1.716e-08
50-150  7.204e-08   3.873e-08
15-150  1.220e-07   6.548e-08
Double BB

Spectral model: bbodyrad<1> + bbodyrad<2>
------------------------------------------------------------
Parameters  : value         Lower 90%    Upper 90%
kT1 [keV]   : 8.11326        (-2.00203      2.60123)
R1^2/D10^2  : 0.926169        (-0.521874      1.35437)
kT2 [keV]   : 31.2584        (-7.61524      18.4378)
R2^2/D10^2  : 1.39087E-02    (-0.0106064   0.015981)
------------------------------------------------------------
#Fit statistic : Chi-Squared =          44.25 using 59 PHA bins.
# Reduced chi-squared =         0.8046 for     55 degrees of freedom
# Null hypothesis probability =   8.497526e-01

Energy  Fluence     90% Error
[keV]   [erg/cm2]   [erg/cm2]
15- 25  1.321e-08   6.442e-09
25- 50  3.297e-08   1.383e-08
50-150  9.366e-08   4.688e-08
15-150  1.398e-07   5.620e-08
Pre-slew spectrum (Pre-slew PHA with pre-slew DRM)
Power-law model
Spectral model in power-law:
------------------------------------------------------------
Parameters  : value       lower 90%   higher 90%
Photon index: 1.29945     ( -0.0811009   0.0806595 )
Norm@50keV  : 6.59113E-03    ( -0.000304275   0.000304275 )
------------------------------------------------------------
#Fit statistic : Chi-Squared =          60.75 using 59 PHA bins.
# Reduced chi-squared =          1.066 for     57 degrees of freedom
# Null hypothesis probability =   3.422755e-01

Photon flux (15-150 keV)    in 17.31 sec: 0.786260 ( -0.0380404  0.0381027 ) ph/cm2/s
Energy fluence (15-150 keV)             : 1.12759e-06 ( -5.66246e-08  5.68002e-08 ) ergs/cm2
Cutoff power-law model

Spectral model in the cutoff power-law:
------------------------------------------------------------
Parameters  : value       lower 90%   higher 90%
Photon index: 0.846811     ( -0.344958   0.319226 )
Epeak [keV] : 136.898      ( -37.3651 180.945 )
Norm@50keV  : 1.07936E-02    ( -0.00309843   0.0047431 )
------------------------------------------------------------
#Fit statistic : Chi-Squared =          54.70 using 59 PHA bins.
# Reduced chi-squared =         0.9767 for     56 degrees of freedom
# Null hypothesis probability =   5.243072e-01

Photon flux (15-150 keV)    in 17.31 sec: 0.768997 ( -0.039854  0.039878 ) ph/cm2/s
Energy fluence (15-150 keV)             : 1.0962e-06 ( -6.17413e-08  6.14263e-08 ) ergs/cm2
Band function

Spectral model in the Band function:
------------------------------------------------------------
Parameters  : value       lower 90%   higher 90%
alpha       : -0.846685   ( -0.261801   0.207975 )
beta        : -10.0000    ( 10   20 )
Epeak [keV] : 136.859      ( -22.9185 180.875 )
Norm@50keV   : 1.07943E-02    ( -0.00309988   0.00474299 )
------------------------------------------------------------
#Fit statistic : Chi-Squared =          54.70 using 59 PHA bins.
# Reduced chi-squared =         0.9945 for     55 degrees of freedom
# Null hypothesis probability =   4.861774e-01

Photon flux (15-150 keV)    in 17.31 sec: 0.772786 (    ) ph/cm2/s
Energy fluence (15-150 keV)             : 0 ( 0  0 ) ergs/cm2
S(25-50 keV) vs. S(50-100 keV) plot

S(25-50 keV)  = 2.51e-07
S(50-100 keV) = 4.08e-07
T90 vs. Hardness ratio plot
T90                                   = 14.7839999198914 sec.
Hardness ratio (energy fluence ratio) = 1.6255
Color vs. Color plot

Count Ratio  (25-50 keV) / (15-25 keV) = 1.51429
Count Ratio (50-100 keV) / (15-25 keV) = 1.39195
Mask shadow pattern

IMX = -4.170783172532118E-01, IMY = -2.177135988342982E-01
TIME vs. PHA plot around the trigger time

Blue+Cyan dotted lines: Time interval of the scaled map
From 0.000000 to 1.024000
TIME vs. DetID plot around the trigger time
Blue+Cyan dotted lines: Time interval of the scaled map
From 0.000000 to 1.024000
100 us light curve (15-350 keV)

Blue+Cyan dotted lines: Time interval of the scaled map
From 0.000000 to 1.024000
Spacecraft aspect plot

Bright source in the pre-burst/pre-slew/post-slew images
Pre-burst image of 15-350 keV band
Time interval of the image:
-119.816000 -3.820000

# RAcent  DECcent POSerr Theta    Phi  PeakCts   SNR AngSep     Name
#  [deg]    [deg]    ['] [deg]  [deg]                   [']
299.5864  35.2025    1.3  47.3  -17.1   1.8870   9.0    0.2	Cyg X-1
308.1225  40.9790    1.6  39.1  -12.5   1.1014   7.2    1.7	Cyg X-3
326.3378  38.1911   10.6  26.1  -24.1  -0.1163  -1.1   11.1	Cyg X-2
 55.2040  23.2542    2.7  49.0  150.4   1.8952   4.3 ------	UNKNOWN
318.5668  46.3530    2.8  30.7   -5.4   0.4913   4.1 ------	UNKNOWN
 41.6895  -2.8697    3.2  57.1 -174.1   1.9427   3.6 ------	UNKNOWN
 37.3055  -8.3893    2.6  59.1 -166.2   3.3871   4.4 ------	UNKNOWN
 32.0074 -11.1343    2.8  58.8 -159.3   3.3998   4.1 ------	UNKNOWN
Pre-slew background subtracted image of 15-350 keV band
Time interval of the image:
-3.820000 13.492000

# RAcent  DECcent POSerr Theta    Phi  PeakCts   SNR AngSep     Name
#  [deg]    [deg]    ['] [deg]  [deg]                   [']
299.5114  35.0953   15.9  47.4  -17.2   0.0648   0.7    7.5	Cyg X-1
308.2926  41.0696    9.2  38.9  -12.5  -0.0778  -1.3   10.8	Cyg X-3
326.0115  38.4900    0.0  26.3  -23.3   0.0406   0.8   12.6	Cyg X-2
 30.6498  33.4736    0.3  25.2  152.4   1.7066  33.6 ------	UNKNOWN
323.1658  29.1119    1.9  31.9  -39.5   0.3153   5.9 ------	UNKNOWN
333.3550  10.2330    2.1  37.7  -75.6   0.5732   5.6 ------	UNKNOWN
Post-slew image of 15-350 keV band
Time interval of the image:
61.684590 302.271600
420.184000 962.258400
978.184000 1468.239900

# RAcent  DECcent POSerr Theta    Phi  PeakCts   SNR AngSep     Name
#  [deg]    [deg]    ['] [deg]  [deg]                   [']
326.1274  38.4296 2700.0  51.4  -30.7  -0.0048  -0.0    6.8	Cyg X-2
 73.4175   2.6121    3.4  50.5  152.5   9.4296   3.4 ------	UNKNOWN
310.6781  58.6469    3.9  56.8   -3.6   9.5237   3.0 ------	UNKNOWN
 49.4268 -22.7812    3.8  59.1 -166.1  13.2254   3.0 ------	UNKNOWN
 17.8493 -12.8961    2.3  48.0 -129.0  14.9175   4.9 ------	UNKNOWN
Plot creation:
Sat May 30 14:09:03 EDT 2015