Special notes of this burst
Image
Pre-slew 15.0-350.0 keV image (Event data)
#   RAcent    DECcent   POSerr    Theta     Phi              Peak Cts       SNR   Name
  344.4988    15.4522   0.0147    27.6869   -84.1181         1.0316665     13.150 TRIG_00590446

Foreground time interval of the image:
 -1.124  22.764 (delta_t =  23.888 [sec])
Background time interval of the image:
-71.083  -1.124 (delta_t =  69.959 [sec])
Lightcurves
Notes:
- 1) The mask-weighted light curves are using the flight position.
- 2) Multiple plots of different time binning/intervals are shown to cover all scenarios of short/long GRBs, rate/image triggers, and real/false positives.
- 3) For all the mask-weighted lightcurves, the y-axis units are counts/sec/det where a det is 0.4 x 0.4 = 0.16 sq cm.
- 4) The verticle lines correspond to following: green dotted lines are T50 interval, black dotted lines are T90 interval, blue solid line(s) is a spacecraft slew start time, and orange solid line(s) is a spacecraft slew end time.
- 5) Time of each bin is in the middle of the bin.
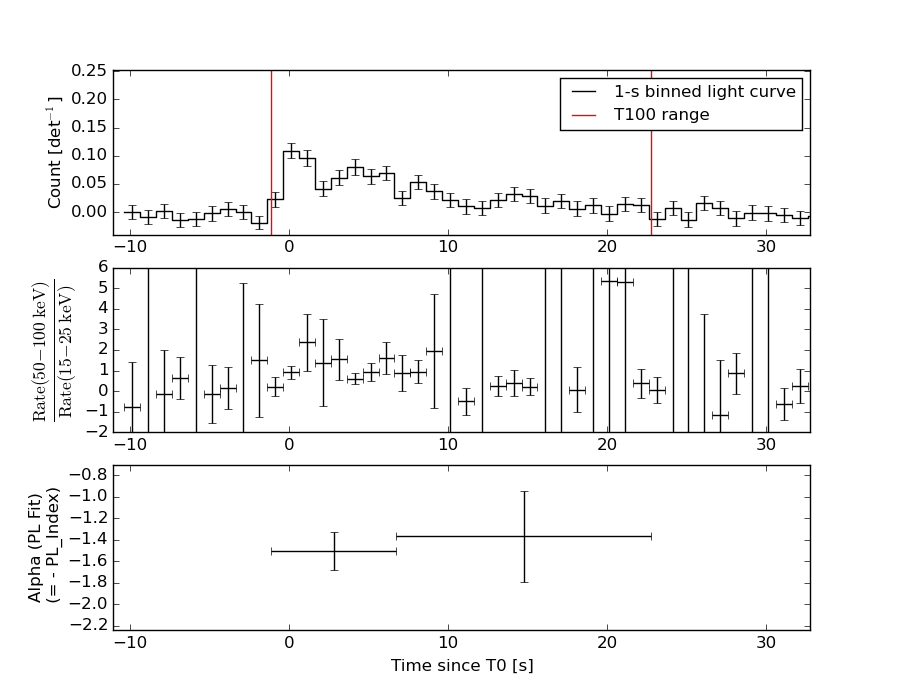
1 s binning
From T0-310 s to T0+310 s
From T100_start - 20 s to T100_end + 30 s
Full time interval
64 ms binning
Full time interval
From T100_start to T100_end
From T0-5 sec to T0+5 sec
16 ms binning
From T100_start-5 s to T100_start+5 s
Blue+Cyan dotted lines: Time interval of the scaled map
From 0.000000 to 1.024000
8 ms binning
From T100_start-3 s to T100_start+3 s
Blue+Cyan dotted lines: Time interval of the scaled map
From 0.000000 to 1.024000
2 ms binning
From T100_start-1 s to T100_start+1 s
Blue+Cyan dotted lines: Time interval of the scaled map
From 0.000000 to 1.024000
SN=5 or 10 sec. binning (whichever binning is satisfied first)
SN=5 or 10 sec. binning (T < 200 sec)
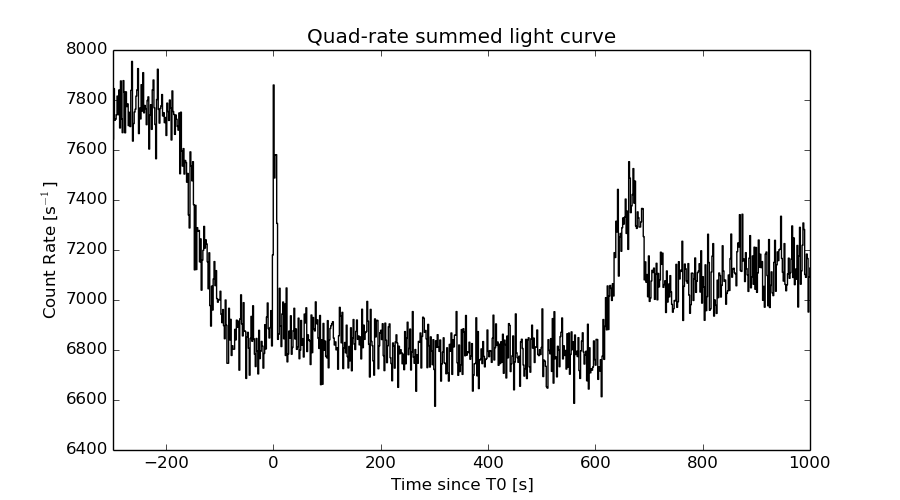
Quad-rate summed light curves (from T0-300s to T0+1000s)
Spectral Evolution
Spectra
Notes:
- 1) The fitting includes the systematic errors.
- 2) When the burst includes telescope slew time periods, the fitting uses an average response file made from multiple 5-s response files through out the slew time plus single time preiod for the non-slew times, and weighted by the total counts in the corresponding time period using addrmf. An average response file is needed becuase a spectral fit using the pre-slew DRM will introduce some errors in both a spectral shape and a normalization if the PHA file contains a lot of the slew/post-slew time interval.
- 3) For fits to more complicated models (e.g. a power-law over a cutoff power-law), the BAT team has decided to require a chi-square improvement of more than 6 for each extra dof.
Time averaged spectrum fit using the average DRM
Power-law model
Time interval is from   -1.124 sec. to   22.764 sec.

Spectral model in power-law:
------------------------------------------------------------
Parameters  : value       lower 90%   higher 90%
Photon index: 1.44586     ( -0.18863   0.189966 )
Norm@50keV  : 2.46282E-03    ( -0.000285215   0.000284238 )
------------------------------------------------------------
#Fit statistic : Chi-Squared =          71.59 using 59 PHA bins.
# Reduced chi-squared =          1.256 for     57 degrees of freedom
# Null hypothesis probability =   9.242037e-02

Photon flux (15-150 keV)    in 23.89 sec: 0.303198 ( -0.0351771  0.0352388 ) ph/cm2/s
Energy fluence (15-150 keV)             : 5.6346e-07 ( -7.10962e-08  7.18203e-08 ) ergs/cm2
Cutoff power-law model

Time interval is from   -1.124 sec. to   22.764 sec.
Spectral model in the cutoff power-law:
------------------------------------------------------------
Parameters  : value       lower 90%   higher 90%
Photon index: 0.301185     ( -1.10673   0.874225 )
Epeak [keV] : 75.0362      ( -16.2701 76.5671 )
Norm@50keV  : 9.13492E-03    ( -0.00569968   0.0221184 )
------------------------------------------------------------
#Fit statistic : Chi-Squared =          66.33 using 59 PHA bins.
# Reduced chi-squared =          1.184 for     56 degrees of freedom
# Null hypothesis probability =   1.625325e-01

Photon flux (15-150 keV)    in 23.89 sec: 0.289068 ( -0.037133  0.036922 ) ph/cm2/s
Energy fluence (15-150 keV)             : 5.23031e-07 ( -7.65006e-08  7.82397e-08 ) ergs/cm2
Band function
Time interval is from   -1.124 sec. to   22.764 sec.

Spectral model in the Band function:
------------------------------------------------------------
Parameters  : value       lower 90%   higher 90%
alpha       : -0.289652   ( -0.81658   0.898789 )
beta        : -9.37167    ( 9.37167   19.3717 )
Epeak [keV] : 75.6891      ( -14.6796 75.5659 )
Norm@50keV   : 9.12547E-03    ( -0.00509386   0.154676 )
------------------------------------------------------------
#Fit statistic : Chi-Squared =          66.34 using 59 PHA bins.
# Reduced chi-squared =          1.206 for     55 degrees of freedom
# Null hypothesis probability =   1.406526e-01

Photon flux (15-150 keV)    in 23.89 sec: 0.291295 (    ) ph/cm2/s
Energy fluence (15-150 keV)             : 5.22931e-07 ( 0  0 ) ergs/cm2
Single BB
Spectral model blackbody:
------------------------------------------------------------
Parameters  : value    Lower 90%  Upper 90%
kT [keV]    : 15.5067  (-1.8536  2.17459)
R^2/D10^2   : 3.21419E-02  (-0.0119289   0.0181869)
(R is the radius in km and D10 is the distance to the source in units of 10 kpc)
------------------------------------------------------------
#Fit statistic : Chi-Squared =          72.32 using 59 PHA bins.
# Reduced chi-squared =          1.269 for     57 degrees of freedom
# Null hypothesis probability =   8.308423e-02

Energy  Fluence     90% Error
[keV]   [erg/cm2]   [erg/cm2]
15- 25  3.843e-08   8.123e-09
25- 50  1.573e-07   2.421e-08
50-150  2.612e-07   5.710e-08
15-150  4.570e-07   6.880e-08
Thermal bremsstrahlung (OTTB)
Spectral model: thermal bremsstrahlung
------------------------------------------------------------
Parameters  : value         Lower 90%    Upper 90%
kT [keV]    : 200.000       (      )
Norm        : 1.25493       (-0.14194     0.141933)
------------------------------------------------------------
#Fit statistic : Chi-Squared =          70.02 using 59 PHA bins.
# Reduced chi-squared =          1.228 for     57 degrees of freedom
# Null hypothesis probability =   1.153243e-01

Energy  Fluence     90% Error
[keV]   [erg/cm2]   [erg/cm2]
15- 25  7.467e-08   4.192e-08
25- 50  1.436e-07   7.860e-08
50-150  3.150e-07   1.733e-07
15-150  5.333e-07   2.910e-07
Double BB
Spectral model: bbodyrad<1> + bbodyrad<2>
------------------------------------------------------------
Parameters  : value         Lower 90%    Upper 90%
kT1 [keV]   : 3.16108        (-2.13258      40.7875)
R1^2/D10^2  : 4.94091        (-4.89613      34445)
kT2 [keV]   : 17.1452        (-2.48008      39.5887)
R2^2/D10^2  : 2.15160E-02    (-0.0213222   0.0197948)
------------------------------------------------------------
#Fit statistic : Chi-Squared =          66.17 using 59 PHA bins.
# Reduced chi-squared =          1.203 for     55 degrees of freedom
# Null hypothesis probability =   1.439374e-01

Energy  Fluence     90% Error
[keV]   [erg/cm2]   [erg/cm2]
15- 25  6.102e-08   2.246e-08
25- 50  1.420e-07   3.779e-08
50-150  2.878e-07   8.262e-08
15-150  4.909e-07   1.074e-07
Peak spectrum fit
Power-law model
Time interval is from    0.180 sec. to    1.180 sec.

Spectral model in power-law:
------------------------------------------------------------
Parameters  : value       lower 90%   higher 90%
Photon index: 1.49210     ( -0.269605   0.275046 )
Norm@50keV  : 7.94052E-03    ( -0.00152389   0.0015131 )
------------------------------------------------------------
#Fit statistic : Chi-Squared =          68.64 using 59 PHA bins.
# Reduced chi-squared =          1.204 for     57 degrees of freedom
# Null hypothesis probability =   1.389875e-01

Photon flux (15-150 keV)    in 1 sec: 0.989200 ( -0.182583  0.18283 ) ph/cm2/s
Energy fluence (15-150 keV)             : 7.54133e-08 ( -1.54865e-08  1.58318e-08 ) ergs/cm2
Cutoff power-law model
Time interval is from    0.180 sec. to    1.180 sec.
Spectral model in the cutoff power-law:
------------------------------------------------------------
Parameters  : value       lower 90%   higher 90%
Photon index: -1.17627     ( -2.51841   1.59224 )
Epeak [keV] : 51.1974      ( -10.1608 19.1375 )
Norm@50keV  : 0.251432    ( -0.257254   8.18075 )
------------------------------------------------------------
#Fit statistic : Chi-Squared =          58.36 using 59 PHA bins.
# Reduced chi-squared =          1.042 for     56 degrees of freedom
# Null hypothesis probability =   3.885843e-01

Photon flux (15-150 keV)    in 1 sec: 0.935159 ( -0.178697  0.182081 ) ph/cm2/s
Energy fluence (15-150 keV)             : 6.14969e-08 ( -1.47289e-08  1.68052e-08 ) ergs/cm2
Band function

Time interval is from    0.180 sec. to    1.180 sec.

Spectral model in the Band function:
------------------------------------------------------------
Parameters  : value       lower 90%   higher 90%
alpha       : 1.15582   ( -1.19973   1.01059 )
beta        : -9.99999    ( 9.99999   1.34419e-05 )
Epeak [keV] : 51.4263      ( -8.97629 10.7985 )
Norm@50keV   : 0.243266    ( -0.0420899   8.29844 )
------------------------------------------------------------
#Fit statistic : Chi-Squared =          58.36 using 59 PHA bins.
# Reduced chi-squared =          1.061 for     55 degrees of freedom
# Null hypothesis probability =   3.528221e-01

Photon flux (15-150 keV)    in 1 sec:  (    ) ph/cm2/s
Energy fluence (15-150 keV)             : 6.86691e-08 ( -6.86621e-08  -1.54333e-08 ) ergs/cm2
Single BB
Spectral model blackbody:
------------------------------------------------------------
Parameters  : value    Lower 90%  Upper 90%
kT [keV]    : 12.8422  (-2.14234  2.66507)
R^2/D10^2   : 0.215320  (-0.106502   0.197912)
(R is the radius in km and D10 is the distance to the source in units of 10 kpc)
------------------------------------------------------------
#Fit statistic : Chi-Squared =          58.78 using 59 PHA bins.
# Reduced chi-squared =          1.031 for     57 degrees of freedom
# Null hypothesis probability =   4.100161e-01

Energy  Fluence     90% Error
[keV]   [erg/cm2]   [erg/cm2]
15- 25  7.532e-09   2.588e-09
25- 50  2.560e-08   6.680e-09
50-150  2.650e-08   9.935e-09
15-150  5.963e-08   1.554e-08
Thermal bremsstrahlung (OTTB)
Spectral model: thermal bremsstrahlung
------------------------------------------------------------
Parameters  : value         Lower 90%    Upper 90%
kT [keV]    : 183.718       (-93.5698      -178.186)
Norm        : 4.13399       (-0.764547     0.885819)
------------------------------------------------------------
#Fit statistic : Chi-Squared =          66.03 using 59 PHA bins.
# Reduced chi-squared =          1.158 for     57 degrees of freedom
# Null hypothesis probability =   1.931251e-01

Energy  Fluence     90% Error
[keV]   [erg/cm2]   [erg/cm2]
15- 25  1.040e-08   5.875e-09
25- 50  1.981e-08   1.116e-08
50-150  4.225e-08   2.414e-08
15-150  7.246e-08   4.172e-08
Double BB
------------------------------------------------------------
Parameters  : value         Lower 90%    Upper 90%
kT1 [keV]   : 10.0606        (      )
R1^2/D10^2  : 0.343821        (-0.342753      -0.342753)
kT2 [keV]   : 21.0116        (-21.7493      -21.7493)
R2^2/D10^2  : 1.63564E-02    (-0.0131559   0.351174)
------------------------------------------------------------
#Fit statistic : Chi-Squared =          58.78 using 59 PHA bins.
#Fit statistic : Chi-Squared =          57.83 using 59 PHA bins.
# Reduced chi-squared =          1.069 for     55 degrees of freedom
# Reduced chi-squared =          1.052 for     55 degrees of freedom
# Null hypothesis probability =   3.387430e-01
# Null hypothesis probability =   3.710932e-01

Energy  Fluence     90% Error
[keV]   [erg/cm2]   [erg/cm2]
15- 25  0.000e+00   0.000e+00
25- 50  0.000e+00   0.000e+00
50-150  0.000e+00   0.000e+00
15-150  0.000e+00   0.000e+00
Pre-slew spectrum (Pre-slew PHA with pre-slew DRM)
Power-law model

Spectral model in power-law:
------------------------------------------------------------
Parameters  : value       lower 90%   higher 90%
Photon index: 1.44586     ( -0.18863   0.189966 )
Norm@50keV  : 2.46282E-03    ( -0.000285215   0.000284238 )
------------------------------------------------------------
#Fit statistic : Chi-Squared =          71.59 using 59 PHA bins.
# Reduced chi-squared =          1.256 for     57 degrees of freedom
# Null hypothesis probability =   9.242037e-02

Photon flux (15-150 keV)    in 23.89 sec: 0.303198 ( -0.0351771  0.0352388 ) ph/cm2/s
Energy fluence (15-150 keV)             : 5.6346e-07 ( -7.10962e-08  7.18203e-08 ) ergs/cm2
Cutoff power-law model
Spectral model in the cutoff power-law:
------------------------------------------------------------
Parameters  : value       lower 90%   higher 90%
Photon index: 0.301185     ( -1.10673   0.874225 )
Epeak [keV] : 75.0362      ( -16.2701 76.5671 )
Norm@50keV  : 9.13492E-03    ( -0.00569968   0.0221184 )
------------------------------------------------------------
#Fit statistic : Chi-Squared =          66.33 using 59 PHA bins.
# Reduced chi-squared =          1.184 for     56 degrees of freedom
# Null hypothesis probability =   1.625325e-01

Photon flux (15-150 keV)    in 23.89 sec: 0.289068 ( -0.037133  0.036922 ) ph/cm2/s
Energy fluence (15-150 keV)             : 5.23031e-07 ( -7.65006e-08  7.82397e-08 ) ergs/cm2
Band function

Spectral model in the Band function:
------------------------------------------------------------
Parameters  : value       lower 90%   higher 90%
alpha       : -0.289652   ( -0.81658   0.898789 )
beta        : -9.37167    ( 9.37167   19.3717 )
Epeak [keV] : 75.6891      ( -14.6796 75.5659 )
Norm@50keV   : 9.12547E-03    ( -0.00509387   0.154681 )
------------------------------------------------------------
#Fit statistic : Chi-Squared =          66.34 using 59 PHA bins.
# Reduced chi-squared =          1.206 for     55 degrees of freedom
# Null hypothesis probability =   1.406526e-01

Photon flux (15-150 keV)    in 23.89 sec: 0.291295 (    ) ph/cm2/s
Energy fluence (15-150 keV)             : 5.22931e-07 ( 0  0 ) ergs/cm2
S(25-50 keV) vs. S(50-100 keV) plot
S(25-50 keV)  = 1.36e-07
S(50-100 keV) = 1.99e-07
T90 vs. Hardness ratio plot
T90                                   = 20.3039999604225 sec.
Hardness ratio (energy fluence ratio) = 1.46324
Color vs. Color plot
Count Ratio  (25-50 keV) / (15-25 keV) = 1.63981
Count Ratio (50-100 keV) / (15-25 keV) = 1.19036
Mask shadow pattern
IMX = 5.377245253927346E-02, IMY = 5.219584705870727E-01
TIME vs. PHA plot around the trigger time
Blue+Cyan dotted lines: Time interval of the scaled map
From 0.000000 to 1.024000
TIME vs. DetID plot around the trigger time
Blue+Cyan dotted lines: Time interval of the scaled map
From 0.000000 to 1.024000
100 us light curve (15-350 keV)
Blue+Cyan dotted lines: Time interval of the scaled map
From 0.000000 to 1.024000
Spacecraft aspect plot
Bright source in the pre-burst/pre-slew/post-slew images
Pre-burst image of 15-350 keV band
Time interval of the image:
-71.083400 -1.124000

# RAcent  DECcent POSerr Theta    Phi  PeakCts   SNR AngSep     Name
#  [deg]    [deg]    ['] [deg]  [deg]                   [']
299.5993  35.2076    1.8  47.3  -13.1   0.8792   6.3    0.6	Cyg X-1
308.0818  40.9766    2.0  39.1   -8.5   0.5964   5.7    1.9	Cyg X-3
326.2078  38.2859    7.6  26.2  -19.8   0.1238   1.5    2.7	Cyg X-2
 57.7432  21.8669    3.3  51.7  154.2   1.4029   3.6 ------	UNKNOWN
333.1098  54.5968    3.5  23.5   20.9   0.2708   3.3 ------	UNKNOWN
292.5864  45.0099    2.2  48.7    1.8   0.8992   5.2 ------	UNKNOWN
Pre-slew background subtracted image of 15-350 keV band
Time interval of the image:
-1.124000 22.764000

# RAcent  DECcent POSerr Theta    Phi  PeakCts   SNR AngSep     Name
#  [deg]    [deg]    ['] [deg]  [deg]                   [']
299.6969  35.3148    8.7  47.2  -13.0  -0.1251  -1.3    8.6	Cyg X-1
308.1107  41.0703   13.4  39.0   -8.4  -0.0609  -0.9    7.1	Cyg X-3
326.3348  38.2543    6.2  26.1  -19.9  -0.0972  -1.9    8.7	Cyg X-2
344.4988  15.4522    0.9  27.7  -84.1   1.0317  13.2 ------	UNKNOWN
 11.3056  -2.5821    2.1  43.4 -134.4   0.6537   5.4 ------	UNKNOWN
323.8006   9.4264    2.1  44.1  -61.0   1.1995   5.4 ------	UNKNOWN
Post-slew image of 15-350 keV band
Time interval of the image:
708.016580 962.620200

# RAcent  DECcent POSerr Theta    Phi  PeakCts   SNR AngSep     Name
#  [deg]    [deg]    ['] [deg]  [deg]                   [']
 83.6381  22.0255    0.3  30.8  -97.1  10.7544  34.6    0.7	Crab
133.4505 -16.7993    2.6  40.3  137.9   1.9672   4.4 ------	UNKNOWN
Plot creation:
Sat May 30 14:07:07 EDT 2015