Special notes of this burst
Image
Pre-slew 15.0-50.0 keV image (Event data)
#RAcent DECcent POSerr Theta  Phi  Peak_Cts  SNR Name
209.301 0.612 0.000 40.828 56.049 1.630 7.923 TRIG_00591390

Image time interval: 0.000 to 64.000 [sec]
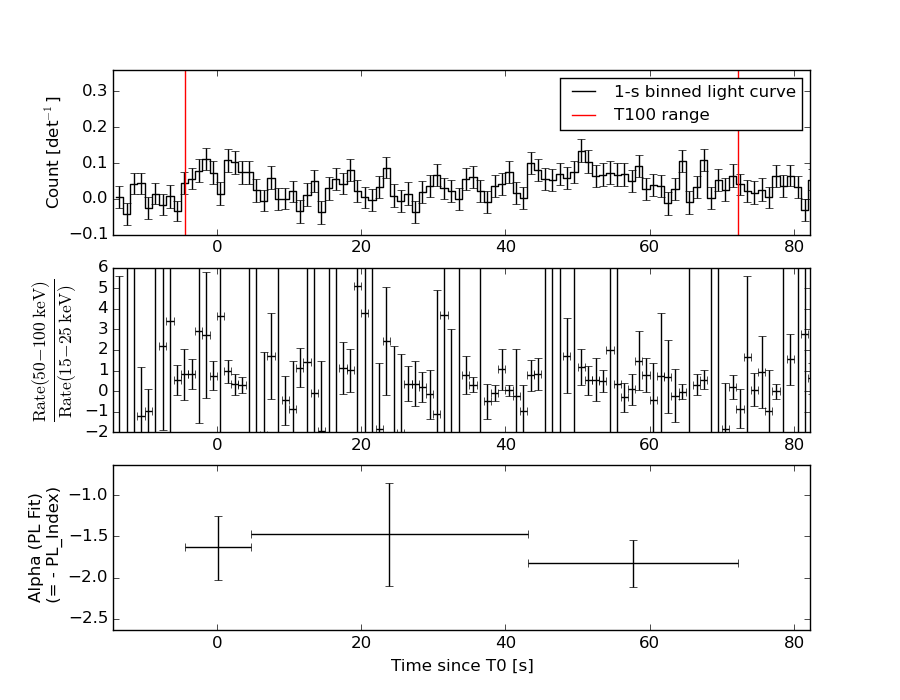
Lightcurves
Notes:
- 1) The mask-weighted light curves are using the flight position.
- 2) Multiple plots of different time binning/intervals are shown to cover all scenarios of short/long GRBs, rate/image triggers, and real/false positives.
- 3) For all the mask-weighted lightcurves, the y-axis units are counts/sec/det where a det is 0.4 x 0.4 = 0.16 sq cm.
- 4) The verticle lines correspond to following: green dotted lines are T50 interval, black dotted lines are T90 interval, blue solid line(s) is a spacecraft slew start time, and orange solid line(s) is a spacecraft slew end time.
- 5) Time of each bin is in the middle of the bin.
1 s binning
From T0-310 s to T0+310 s
From T100_start - 20 s to T100_end + 30 s
Full time interval
64 ms binning
Full time interval
From T100_start to T100_end
From T0-5 sec to T0+5 sec
16 ms binning
From T100_start-5 s to T100_start+5 s
Blue+Cyan dotted lines: Time interval of the scaled map
From 0.000000 to 64.000000
8 ms binning
From T100_start-3 s to T100_start+3 s
Blue+Cyan dotted lines: Time interval of the scaled map
From 0.000000 to 64.000000
2 ms binning
From T100_start-1 s to T100_start+1 s
Blue+Cyan dotted lines: Time interval of the scaled map
From 0.000000 to 64.000000
SN=5 or 10 sec. binning (whichever binning is satisfied first)
SN=5 or 10 sec. binning (T < 200 sec)
Quad-rate summed light curves (from T0-300s to T0+1000s)
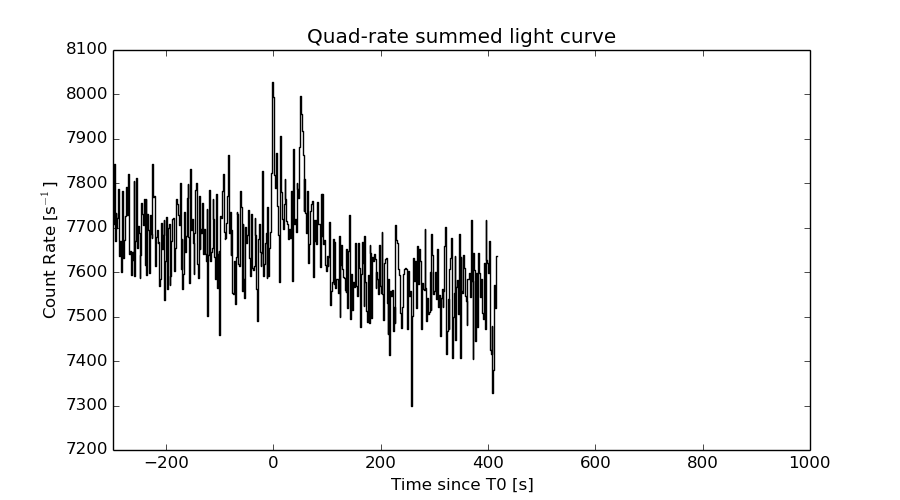
The mask-weighted light curves based on cleaned DPHs

Spectral Evolution
Spectra
Notes:
- 1) The fitting includes the systematic errors.
- 2) When the burst includes telescope slew time periods, the fitting uses an average response file made from multiple 5-s response files through out the slew time plus single time preiod for the non-slew times, and weighted by the total counts in the corresponding time period using addrmf. An average response file is needed becuase a spectral fit using the pre-slew DRM will introduce some errors in both a spectral shape and a normalization if the PHA file contains a lot of the slew/post-slew time interval.
- 3) For fits to more complicated models (e.g. a power-law over a cutoff power-law), the BAT team has decided to require a chi-square improvement of more than 6 for each extra dof.
Time averaged spectrum fit using the average DRM
Power-law model
Time interval is from   -4.456 sec. to   72.216 sec.

Spectral model in power-law:
------------------------------------------------------------
Parameters  : value       lower 90%   higher 90%
Photon index: 1.69699     ( -0.232181   0.238552 )
Norm@50keV  : 2.95234E-03    ( -0.000409829   0.00040336 )
------------------------------------------------------------
#Fit statistic : Chi-Squared =          57.40 using 59 PHA bins.
# Reduced chi-squared =          1.007 for     57 degrees of freedom
# Null hypothesis probability =   4.601691e-01

Photon flux (15-150 keV)    in 76.67 sec: 0.391692 ( -0.0515828  0.0517645 ) ph/cm2/s
Energy fluence (15-150 keV)             : 2.09629e-06 ( -3.02406e-07  3.06665e-07 ) ergs/cm2
Cutoff power-law model
Time interval is from   -4.456 sec. to   72.216 sec.
Spectral model in the cutoff power-law:
------------------------------------------------------------
Parameters  : value       lower 90%   higher 90%
Photon index: 1.48441     ( -1.06342   0.443377 )
Epeak [keV] : 116.352      ( -116.356 -116.356 )
Norm@50keV  : 3.81406E-03    (     )
------------------------------------------------------------
#Fit statistic : Chi-Squared =          57.24 using 59 PHA bins.
# Reduced chi-squared =          1.022 for     56 degrees of freedom
# Null hypothesis probability =   4.287148e-01

Photon flux (15-150 keV)    in 76.67 sec: 0.387644 ( -0.054467  0.053995 ) ph/cm2/s
Energy fluence (15-150 keV)             : 2.05999e-06 ( -3.4273e-07  3.3435e-07 ) ergs/cm2
Band function
Time interval is from   -4.456 sec. to   72.216 sec.

Spectral model in the Band function:
------------------------------------------------------------
Parameters  : value       lower 90%   higher 90%
alpha       : -1.32610   ( 1.37012   6.35983 )
beta        : -1.87713    ( 1.86339   0.388893 )
Epeak [keV] : 80.6202      ( -85.0783 -85.0783 )
Norm@50keV   : 4.70034E-03    ( -0.00183363   0 )
------------------------------------------------------------
#Fit statistic : Chi-Squared =          57.19 using 59 PHA bins.
# Reduced chi-squared =          1.040 for     55 degrees of freedom
# Null hypothesis probability =   3.937597e-01

Photon flux (15-150 keV)    in 76.67 sec:  (    ) ph/cm2/s
Energy fluence (15-150 keV)             : 0 ( 0  0 ) ergs/cm2
Single BB
Spectral model blackbody:
------------------------------------------------------------
Parameters  : value    Lower 90%  Upper 90%
kT [keV]    : 13.2211  (-2.01488  2.42122)
R^2/D10^2   : 6.58903E-02  (-0.0302394   0.0548619)
(R is the radius in km and D10 is the distance to the source in units of 10 kpc)
------------------------------------------------------------
#Fit statistic : Chi-Squared =          71.18 using 59 PHA bins.
# Reduced chi-squared =          1.249 for     57 degrees of freedom
# Null hypothesis probability =   9.802424e-02

Energy  Fluence     90% Error
[keV]   [erg/cm2]   [erg/cm2]
15- 25  1.872e-07   5.436e-08
25- 50  6.565e-07   1.338e-07
50-150  7.326e-07   2.026e-07
15-150  1.576e-06   2.917e-07
Thermal bremsstrahlung (OTTB)
Spectral model: thermal bremsstrahlung
------------------------------------------------------------
Parameters  : value         Lower 90%    Upper 90%
kT [keV]    : 144.994       (-62.2526      -141.018)
Norm        : 1.59880       (-0.235041     0.332607)
------------------------------------------------------------
#Fit statistic : Chi-Squared =          57.42 using 59 PHA bins.
# Reduced chi-squared =          1.007 for     57 degrees of freedom
# Null hypothesis probability =   4.595998e-01

Energy  Fluence     90% Error
[keV]   [erg/cm2]   [erg/cm2]
15- 25  3.157e-07   1.429e-07
25- 50  5.823e-07   3.114e-07
50-150  1.133e-06   6.774e-07
15-150  2.031e-06   1.159e-06
Double BB
Spectral model: bbodyrad<1> + bbodyrad<2>
------------------------------------------------------------
Parameters  : value         Lower 90%    Upper 90%
kT1 [keV]   : 5.43481        (-2.36395      4.29996)
R1^2/D10^2  : 1.04671        (-0.652011      12.0244)
kT2 [keV]   : 20.2069        (-5.45652      31.8248)
R2^2/D10^2  : 1.15292E-02    (-0.0109465   0.0276003)
------------------------------------------------------------
#Fit statistic : Chi-Squared =          58.36 using 59 PHA bins.
# Reduced chi-squared =          1.061 for     55 degrees of freedom
# Null hypothesis probability =   3.530264e-01

Energy  Fluence     90% Error
[keV]   [erg/cm2]   [erg/cm2]
15- 25  3.387e-07   1.917e-07
25- 50  5.624e-07   2.729e-07
50-150  1.066e-06   5.963e-07
15-150  1.967e-06   9.250e-07
Peak spectrum fit
Power-law model
Time interval is from   -2.404 sec. to   -1.404 sec.

Spectral model in power-law:
------------------------------------------------------------
Parameters  : value       lower 90%   higher 90%
Photon index: 1.72763     ( -0.59838   0.663056 )
Norm@50keV  : 9.55920E-03    ( -0.00362942   0.00345212 )
------------------------------------------------------------
#Fit statistic : Chi-Squared =          48.61 using 59 PHA bins.
# Reduced chi-squared =         0.8528 for     57 degrees of freedom
# Null hypothesis probability =   7.777975e-01

Photon flux (15-150 keV)    in 1 sec: 1.28207 ( -0.448293  0.451267 ) ph/cm2/s
Energy fluence (15-150 keV)             : 8.83287e-08 ( -3.31377e-08  3.403e-08 ) ergs/cm2
Cutoff power-law model
Time interval is from   -2.404 sec. to   -1.404 sec.
Spectral model in the cutoff power-law:
------------------------------------------------------------
Parameters  : value       lower 90%   higher 90%
Photon index: 1.24242     ( -4.19839   0.900151 )
Epeak [keV] : 75.6073      ( -75.6303 -75.6303 )
Norm@50keV  : 1.71344E-02    ( -0.0171254   1.83893 )
------------------------------------------------------------
#Fit statistic : Chi-Squared =          48.52 using 59 PHA bins.
# Reduced chi-squared =         0.8664 for     56 degrees of freedom
# Null hypothesis probability =   7.509897e-01

Photon flux (15-150 keV)    in 1 sec: 1.25898 ( -0.475923  0.46357 ) ph/cm2/s
Energy fluence (15-150 keV)             : 8.56862e-08 ( -3.4841e-08  3.61048e-08 ) ergs/cm2
Band function
Time interval is from   -2.404 sec. to   -1.404 sec.

Spectral model in the Band function:
------------------------------------------------------------
Parameters  : value       lower 90%   higher 90%
alpha       : 1.99285   ( -1.98684   -1.98684 )
beta        : -1.79421    ( 1.79269   0.652699 )
Epeak [keV] : 25.3275      ( -25.1711 184.58 )
Norm@50keV   : 6.85024    ( -6.96139   1306.29 )
------------------------------------------------------------
#Fit statistic : Chi-Squared =          48.54 using 59 PHA bins.
# Reduced chi-squared =         0.8825 for     55 degrees of freedom
# Null hypothesis probability =   7.184031e-01

Photon flux (15-150 keV)    in 1 sec:  (    ) ph/cm2/s
Energy fluence (15-150 keV)             : 0 ( 0  0 ) ergs/cm2
Single BB
Spectral model blackbody:
------------------------------------------------------------
Parameters  : value    Lower 90%  Upper 90%
kT [keV]    : 13.8145  (-4.48122  6.65875)
R^2/D10^2   : 0.191090  (-0.190964   0.591894)
(R is the radius in km and D10 is the distance to the source in units of 10 kpc)
------------------------------------------------------------
#Fit statistic : Chi-Squared =          49.96 using 59 PHA bins.
# Reduced chi-squared =         0.8765 for     57 degrees of freedom
# Null hypothesis probability =   7.342274e-01

Energy  Fluence     90% Error
[keV]   [erg/cm2]   [erg/cm2]
15- 25  7.712e-09   5.165e-09
25- 50  2.830e-08   1.757e-08
50-150  3.532e-08   2.449e-08
15-150  7.134e-08   4.461e-08
Thermal bremsstrahlung (OTTB)
Spectral model: thermal bremsstrahlung
------------------------------------------------------------
Parameters  : value         Lower 90%    Upper 90%
kT [keV]    : 131.422       (-88.8877      -129.167)
Norm        : 5.36058       (-1.99612     3.52301)
------------------------------------------------------------
#Fit statistic : Chi-Squared =          48.52 using 59 PHA bins.
# Reduced chi-squared =         0.8513 for     57 degrees of freedom
# Null hypothesis probability =   7.804829e-01

Energy  Fluence     90% Error
[keV]   [erg/cm2]   [erg/cm2]
15- 25  1.390e-08   8.255e-09
25- 50  2.525e-08   1.515e-08
50-150  4.705e-08   3.291e-08
15-150  8.619e-08   5.580e-08
Double BB
Spectral model: bbodyrad<1> + bbodyrad<2>
------------------------------------------------------------
Parameters  : value         Lower 90%    Upper 90%
kT1 [keV]   : 4.08800        (-4.08      -4.08)
R1^2/D10^2  : 10.5789        (-10.5962      -10.5962)
kT2 [keV]   : 17.1357        (-6.32227      -17.1311)
R2^2/D10^2  : 7.51424E-02    (-0.0752414   0.367706)
------------------------------------------------------------
#Fit statistic : Chi-Squared =          48.06 using 59 PHA bins.
# Reduced chi-squared =         0.8737 for     55 degrees of freedom
# Null hypothesis probability =   7.349842e-01

Energy  Fluence     90% Error
[keV]   [erg/cm2]   [erg/cm2]
15- 25  1.516e-08   9.250e-09
25- 50  2.407e-08   1.361e-08
50-150  4.202e-08   2.711e-08
15-150  8.125e-08   4.560e-08
Pre-slew spectrum (Pre-slew PHA with pre-slew DRM)
Power-law model

Spectral model in power-law:
------------------------------------------------------------
Parameters  : value       lower 90%   higher 90%
Photon index: 1.69699     ( -0.232181   0.238552 )
Norm@50keV  : 2.95234E-03    ( -0.000409829   0.00040336 )
------------------------------------------------------------
#Fit statistic : Chi-Squared =          57.40 using 59 PHA bins.
# Reduced chi-squared =          1.007 for     57 degrees of freedom
# Null hypothesis probability =   4.601691e-01

Photon flux (15-150 keV)    in 76.67 sec: 0.391692 ( -0.0515828  0.0517645 ) ph/cm2/s
Energy fluence (15-150 keV)             : 2.09629e-06 ( -3.02406e-07  3.06665e-07 ) ergs/cm2
Cutoff power-law model
Spectral model in the cutoff power-law:
------------------------------------------------------------
Parameters  : value       lower 90%   higher 90%
Photon index: 1.48441     ( -1.06342   0.443377 )
Epeak [keV] : 116.352      ( -116.356 -116.356 )
Norm@50keV  : 3.81406E-03    (     )
------------------------------------------------------------
#Fit statistic : Chi-Squared =          57.24 using 59 PHA bins.
# Reduced chi-squared =          1.022 for     56 degrees of freedom
# Null hypothesis probability =   4.287148e-01

Photon flux (15-150 keV)    in 76.67 sec: 0.387644 ( -0.054467  0.053995 ) ph/cm2/s
Energy fluence (15-150 keV)             : 2.05999e-06 ( -3.4273e-07  3.3435e-07 ) ergs/cm2
Band function

Spectral model in the Band function:
------------------------------------------------------------
Parameters  : value       lower 90%   higher 90%
alpha       : -1.32610   ( 1.37012   6.35987 )
beta        : -1.87713    ( 1.86339   0.388893 )
Epeak [keV] : 80.6202      ( -85.0783 -85.0783 )
Norm@50keV   : 4.70034E-03    ( -0.00183363   0 )
------------------------------------------------------------
#Fit statistic : Chi-Squared =          57.19 using 59 PHA bins.
# Reduced chi-squared =          1.040 for     55 degrees of freedom
# Null hypothesis probability =   3.937597e-01

Photon flux (15-150 keV)    in 76.67 sec:  (    ) ph/cm2/s
Energy fluence (15-150 keV)             : 0 ( 0  0 ) ergs/cm2
S(25-50 keV) vs. S(50-100 keV) plot
S(25-50 keV)  = 5.67e-07
S(50-100 keV) = 6.99e-07
T90 vs. Hardness ratio plot
T90                                   = 70.4800000190735 sec.
Hardness ratio (energy fluence ratio) = 1.2328
Color vs. Color plot
Count Ratio  (25-50 keV) / (15-25 keV) = 1.30551
Count Ratio (50-100 keV) / (15-25 keV) = 0.966735
Mask shadow pattern
IMX = 0.482544112951, IMY = -0.716713783314
TIME vs. PHA plot around the trigger time
Blue+Cyan dotted lines: Time interval of the scaled map
From 0.000000 to 64.000000
TIME vs. DetID plot around the trigger time
Blue+Cyan dotted lines: Time interval of the scaled map
From 0.000000 to 64.000000
100 us light curve (15-350 keV)
Blue+Cyan dotted lines: Time interval of the scaled map
From 0.000000 to 64.000000
Spacecraft aspect plot
Bright source in the pre-burst/pre-slew/post-slew images
Pre-burst image of 15-350 keV band
Time interval of the image:
-15.699400 -4.456000

# RAcent  DECcent POSerr Theta    Phi  PeakCts   SNR AngSep     Name
#  [deg]    [deg]    ['] [deg]  [deg]                   [']
244.9351 -15.6474    1.3  48.0    0.3   0.5889   8.8    2.6	Sco X-1
254.6386  35.4886    0.0  15.0  -98.6   0.0432   1.3   12.5	Her X-1
268.2622  -1.4466   13.2  44.4  -37.1   0.0580   0.9    6.4	SW J1753.5-0127
Pre-slew background subtracted image of 15-350 keV band
Time interval of the image:
-4.456000 72.216000

# RAcent  DECcent POSerr Theta    Phi  PeakCts   SNR AngSep     Name
#  [deg]    [deg]    ['] [deg]  [deg]                   [']
245.0838 -15.6334    4.7  48.1    0.1   1.1505   2.4    6.0	Sco X-1
254.6385  35.4886    0.0  15.0  -98.6  -0.2796  -1.2   12.5	Her X-1
268.3792  -1.4459    7.3  44.5  -37.3  -0.7389  -1.6    0.8	SW J1753.5-0127
212.5762  -8.4142    1.7  46.6   44.9   6.7447   6.7 ------	UNKNOWN
287.9903  64.1218    2.4  44.9 -141.0   2.3880   4.8 ------	UNKNOWN
Post-slew image of 15-350 keV band
Time interval of the image:
-239.000000 422.998900

# RAcent  DECcent POSerr Theta    Phi  PeakCts   SNR AngSep     Name
#  [deg]    [deg]    ['] [deg]  [deg]                   [']
244.9824 -15.6402    0.4  48.0    0.3  26.0241  29.9    0.2	Sco X-1
254.5036  35.1977   10.4  14.8  -97.5  -0.4496  -1.1    9.0	Her X-1
268.4084  -1.3274   10.4  44.4  -37.4  -0.8748  -1.1    7.9	SW J1753.5-0127
183.2516  39.3644    2.7  43.8  126.0   7.5978   4.3 ------	UNKNOWN
226.3399  17.8856    3.2  17.0   48.1   1.4208   3.6 ------	UNKNOWN
157.7450  80.5137    4.0  56.9  179.2   8.7155   2.9 ------	UNKNOWN
244.5215 -15.6377    0.7  48.0    0.9  14.0946  16.9 ------	UNKNOWN
248.6741 -20.2972    2.2  53.3   -3.1   5.4568   5.2 ------	UNKNOWN
Plot creation:
Thu Oct  8 20:10:35 EDT 2015