Special notes of this burst
Image
Pre-slew 15.0-350.0 keV image (Event data)

#   RAcent    DECcent   POSerr    Theta     Phi              Peak Cts       SNR   Name
  252.2833    52.7249   0.0193    23.5981  -146.4034         0.1066251      9.957 TRIG_00591392

Foreground time interval of the image:
  0.000   1.024 (delta_t =   1.024 [sec])
Background time interval of the image:
Lightcurves
Notes:
- 1) The mask-weighted light curves are using the flight position.
- 2) Multiple plots of different time binning/intervals are shown to cover all scenarios of short/long GRBs, rate/image triggers, and real/false positives.
- 3) For all the mask-weighted lightcurves, the y-axis units are counts/sec/det where a det is 0.4 x 0.4 = 0.16 sq cm.
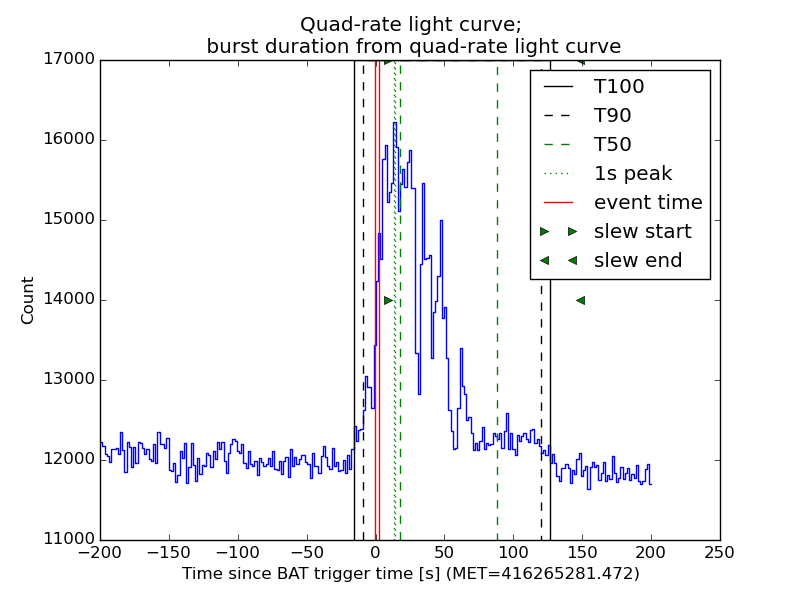
- 4) The verticle lines correspond to following: green dotted lines are T50 interval, black dotted lines are T90 interval, blue solid line(s) is a spacecraft slew start time, and orange solid line(s) is a spacecraft slew end time.
- 5) Time of each bin is in the middle of the bin.
Best duration plot
1 s binning
From T0-310 s to T0+310 s

From T100_start - 20 s to T100_end + 30 s
Full time interval

64 ms binning
Full time interval

From T100_start to T100_end
From T0-5 sec to T0+5 sec

16 ms binning
From T100_start-5 s to T100_start+5 s

8 ms binning
From T100_start-3 s to T100_start+3 s

2 ms binning
From T100_start-1 s to T100_start+1 s

SN=5 or 10 sec. binning (whichever binning is satisfied first)
SN=5 or 10 sec. binning (T < 200 sec)

Quad-rate summed light curves (from T0-300s to T0+1000s)
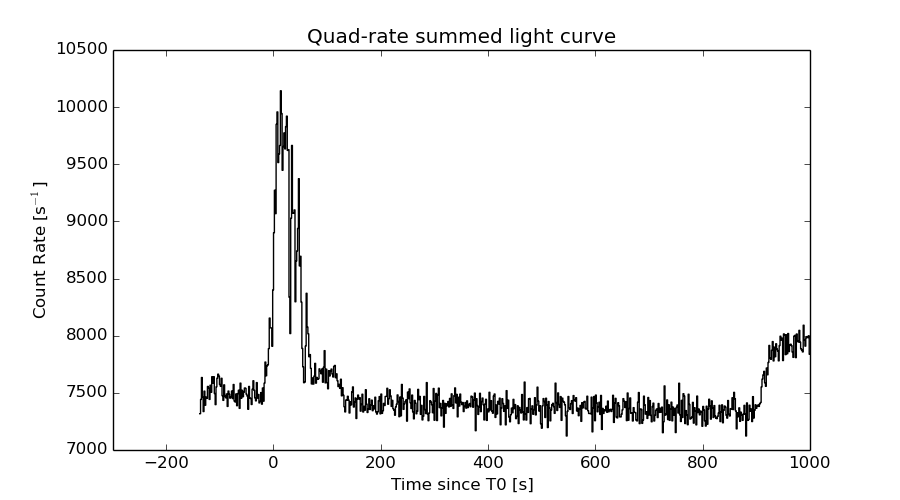
The mask-weighted light curves based on cleaned DPHs

Spectral Evolution

Spectra
Notes:
- 1) The fitting includes the systematic errors.
- 2) When the burst includes telescope slew time periods, the fitting uses an average response file made from multiple 5-s response files through out the slew time plus single time preiod for the non-slew times, and weighted by the total counts in the corresponding time period using addrmf. An average response file is needed becuase a spectral fit using the pre-slew DRM will introduce some errors in both a spectral shape and a normalization if the PHA file contains a lot of the slew/post-slew time interval.
- 3) For fits to more complicated models (e.g. a power-law over a cutoff power-law), the BAT team has decided to require a chi-square improvement of more than 6 for each extra dof.
Time averaged spectrum fit using the average DRM
Power-law model

Time interval is from   -0.472 sec. to    2.593 sec.

Spectral model in power-law:
------------------------------------------------------------
Parameters  : value       lower 90%   higher 90%
Photon index: 1.27231     ( -0.153406   0.151807 )
Norm@50keV  : 7.25603E-03    ( -0.000646427   0.000646162 )
------------------------------------------------------------
#Fit statistic : Chi-Squared =          56.42 using 59 PHA bins.
# Reduced chi-squared =         0.9898 for     57 degrees of freedom
# Null hypothesis probability =   4.968274e-01

Photon flux (15-150 keV)    in 3.065 sec: 0.861410 ( -0.078392  0.07851 ) ph/cm2/s
Energy fluence (15-150 keV)             : 2.2132e-07 ( -2.18991e-08  2.2108e-08 ) ergs/cm2
Cutoff power-law model

Time interval is from   -0.472 sec. to    2.593 sec.
Spectral model in the cutoff power-law:
------------------------------------------------------------
Parameters  : value       lower 90%   higher 90%
Photon index: 0.763803     ( -0.668288   0.562836 )
Epeak [keV] : 124.450      ( -44.8248 -124.45 )
Norm@50keV  : 1.29732E-02    ( -0.00596355   0.0141461 )
------------------------------------------------------------
#Fit statistic : Chi-Squared =          54.21 using 59 PHA bins.
# Reduced chi-squared =         0.9680 for     56 degrees of freedom
# Null hypothesis probability =   5.429880e-01

Photon flux (15-150 keV)    in 3.065 sec: 0.843164 ( -0.081272  0.081244 ) ph/cm2/s
Energy fluence (15-150 keV)             : 2.12662e-07 ( -2.43839e-08  2.43225e-08 ) ergs/cm2
Band function

Time interval is from   -0.472 sec. to    2.593 sec.

Spectral model in the Band function:
------------------------------------------------------------
Parameters  : value       lower 90%   higher 90%
alpha       : 4.98370   ( -4.71719   -4.9837 )
beta        : -1.49757    ( -0.247805   0.201751 )
Epeak [keV] : 31.4571      ( -5.75941 4.46757 )
Norm@50keV   : 164.978    ( -14.5075   389.58 )
------------------------------------------------------------
#Fit statistic : Chi-Squared =          49.23 using 59 PHA bins.
# Reduced chi-squared =         0.8951 for     55 degrees of freedom
# Null hypothesis probability =   6.936845e-01

Photon flux (15-150 keV)    in 3.065 sec:  (    ) ph/cm2/s
Energy fluence (15-150 keV)             : 0 ( 0  0 ) ergs/cm2
Single BB

Spectral model blackbody:
------------------------------------------------------------
Parameters  : value    Lower 90%  Upper 90%
kT [keV]    : 17.1856  (-1.97714  2.28704)
R^2/D10^2   : 6.42318E-02  (-0.0220572   0.0329981)
(R is the radius in km and D10 is the distance to the source in units of 10 kpc)
------------------------------------------------------------
#Fit statistic : Chi-Squared =          75.54 using 59 PHA bins.
# Reduced chi-squared =          1.325 for     57 degrees of freedom
# Null hypothesis probability =   5.070192e-02

Energy  Fluence     90% Error
[keV]   [erg/cm2]   [erg/cm2]
15- 25  1.181e-08   2.139e-09
25- 50  5.269e-08   6.651e-09
50-150  1.115e-07   1.985e-08
15-150  1.760e-07   2.175e-08
Thermal bremsstrahlung (OTTB)

Spectral model: thermal bremsstrahlung
------------------------------------------------------------
Parameters  : value         Lower 90%    Upper 90%
kT [keV]    : 200.000       (-27.9154      -200)
Norm        : 3.56761       (-0.320291     0.320291)
------------------------------------------------------------
#Fit statistic : Chi-Squared =          63.34 using 59 PHA bins.
# Reduced chi-squared =          1.111 for     57 degrees of freedom
# Null hypothesis probability =   2.626994e-01

Energy  Fluence     90% Error
[keV]   [erg/cm2]   [erg/cm2]
15- 25  2.723e-08   7.094e-09
25- 50  5.239e-08   2.012e-08
50-150  1.149e-07   4.803e-08
15-150  1.945e-07   7.000e-08
Double BB

Spectral model: bbodyrad<1> + bbodyrad<2>
------------------------------------------------------------
Parameters  : value         Lower 90%    Upper 90%
kT1 [keV]   : 7.92913        (-1.85591      2.49783)
R1^2/D10^2  : 0.515280        (-0.285787      0.687202)
kT2 [keV]   : 29.4515        (-6.90836      17.7943)
R2^2/D10^2  : 8.46261E-03    (-0.00654086   0.0132303)
------------------------------------------------------------
#Fit statistic : Chi-Squared =          50.85 using 59 PHA bins.
# Reduced chi-squared =         0.9246 for     55 degrees of freedom
# Null hypothesis probability =   6.336860e-01

Energy  Fluence     90% Error
[keV]   [erg/cm2]   [erg/cm2]
15- 25  2.140e-08   9.814e-09
25- 50  5.253e-08   1.918e-08
50-150  1.423e-07   7.218e-08
15-150  2.162e-07   9.279e-08
Pre-slew spectrum (Pre-slew PHA with pre-slew DRM)
Power-law model

Spectral model in power-law:
------------------------------------------------------------
Parameters  : value       lower 90%   higher 90%
Photon index: 1.37873     ( -0.300797   0.29983 )
Norm@50keV  : 6.75496E-03    ( -0.00111034   0.00110158 )
------------------------------------------------------------
#Fit statistic : Chi-Squared =          36.73 using 59 PHA bins.
# Reduced chi-squared =         0.6444 for     57 degrees of freedom
# Null hypothesis probability =   9.830465e-01

Photon flux (15-150 keV)    in 1.024 sec: 0.818744 ( -0.133613  0.133907 ) ph/cm2/s
Energy fluence (15-150 keV)             : 6.71347e-08 ( -1.24015e-08  1.26372e-08 ) ergs/cm2
Cutoff power-law model

Spectral model in the cutoff power-law:
------------------------------------------------------------
Parameters  : value       lower 90%   higher 90%
Photon index: 1.36957     ( -0.525108   0.303693 )
Epeak [keV] : 9999.28      ( -9999.36 -9999.36 )
Norm@50keV  : 6.77807E-03    ( -0.00110733   0.0115503 )
------------------------------------------------------------
#Fit statistic : Chi-Squared =          36.74 using 59 PHA bins.
# Reduced chi-squared =         0.6561 for     56 degrees of freedom
# Null hypothesis probability =   9.782575e-01

Photon flux (15-150 keV)    in 1.024 sec: 0.819552 ( -0.134645  0.132895 ) ph/cm2/s
Energy fluence (15-150 keV)             : 6.69821e-08 ( -1.24933e-08  1.28173e-08 ) ergs/cm2
Band function

Spectral model in the Band function:
------------------------------------------------------------
Parameters  : value       lower 90%   higher 90%
alpha       : -9.71193   ( 14.3898   9.71193 )
beta        : -1.37873    ( -0.29934   0.3008 )
Epeak [keV] : 78.3045      ( -78.3045 -78.3045 )
Norm@50keV   : 0.918094    ( -0.150921   0.149722 )
------------------------------------------------------------
#Fit statistic : Chi-Squared =          36.73 using 59 PHA bins.
# Reduced chi-squared =         0.6679 for     55 degrees of freedom
# Null hypothesis probability =   9.724390e-01

Photon flux (15-150 keV)    in 1.024 sec:  (    ) ph/cm2/s
Energy fluence (15-150 keV)             : 0 ( 0  0 ) ergs/cm2
S(25-50 keV) vs. S(50-100 keV) plot

S(25-50 keV)  = 4.85e-08
S(50-100 keV) = 8.03e-08
T90 vs. Hardness ratio plot
T90                                   = 129.600000023842 sec.
Hardness ratio (energy fluence ratio) = 1.65567
Color vs. Color plot

Count Ratio  (25-50 keV) / (15-25 keV) = 1.56221
Count Ratio (50-100 keV) / (15-25 keV) = 1.29242
Mask shadow pattern

IMX = -3.638750795471890E-01, IMY = 2.417269354991673E-01
TIME vs. PHA plot around the trigger time

TIME vs. DetID plot around the trigger time

100 us light curve (15-350 keV)

Spacecraft aspect plot

Bright source in the pre-burst/pre-slew/post-slew images
Pre-burst image of 15-350 keV band
Time interval of the image:
Pre-slew background subtracted image of 15-350 keV band
Time interval of the image:
0.000000 1.024000

# RAcent  DECcent POSerr Theta    Phi  PeakCts   SNR AngSep     Name
#  [deg]    [deg]    ['] [deg]  [deg]                   [']
244.8766 -15.6321    2.5  48.0    0.4   0.0972   4.6    6.0	Sco X-1
254.4691  35.3366   70.6  14.8  -98.1  -0.0016  -0.2    0.7	Her X-1
268.2753  -1.5922    4.2  44.5  -37.0  -0.0587  -2.7   10.1	SW J1753.5-0127
182.9248  52.0473    2.5  43.9  144.3   0.1197   4.6 ------	UNKNOWN
208.8994  34.6085    3.3  23.7  114.8   0.0450   3.5 ------	UNKNOWN
252.2833  52.7249    1.2  23.6 -146.4   0.1066  10.0 ------	UNKNOWN
Post-slew image of 15-350 keV band
Time interval of the image:
Plot creation:
Wed Jan 13 11:50:09 EST 2016