Click here for the BAT GCN circular template
Image
Pre-slew 15.0-350.0 keV image (Event data)
#   RAcent    DECcent   POSerr    Theta     Phi              Peak Cts       SNR   Name
  184.0500    20.2252   0.0184    28.4810   125.5736         0.4459840     10.437 TRIG_00592204

Foreground time interval of the image:
  2.244  11.676 (delta_t =   9.432 [sec])
Background time interval of the image:
-239.744   2.244 (delta_t = 241.988 [sec])
Lightcurves
Notes:
- 1) The mask-weighted light curves are using the flight position.
- 2) Multiple plots of different time binning/intervals are shown to cover all scenarios of short/long GRBs, rate/image triggers, and real/false positives.
- 3) For all the mask-weighted lightcurves, the y-axis units are counts/sec/det where a det is 0.4 x 0.4 = 0.16 sq cm.
- 4) The verticle lines correspond to following: green dotted lines are T50 interval, black dotted lines are T90 interval, blue solid line(s) is a spacecraft slew start time, and orange solid line(s) is a spacecraft slew end time.
- 5) Time of each bin is in the middle of the bin.
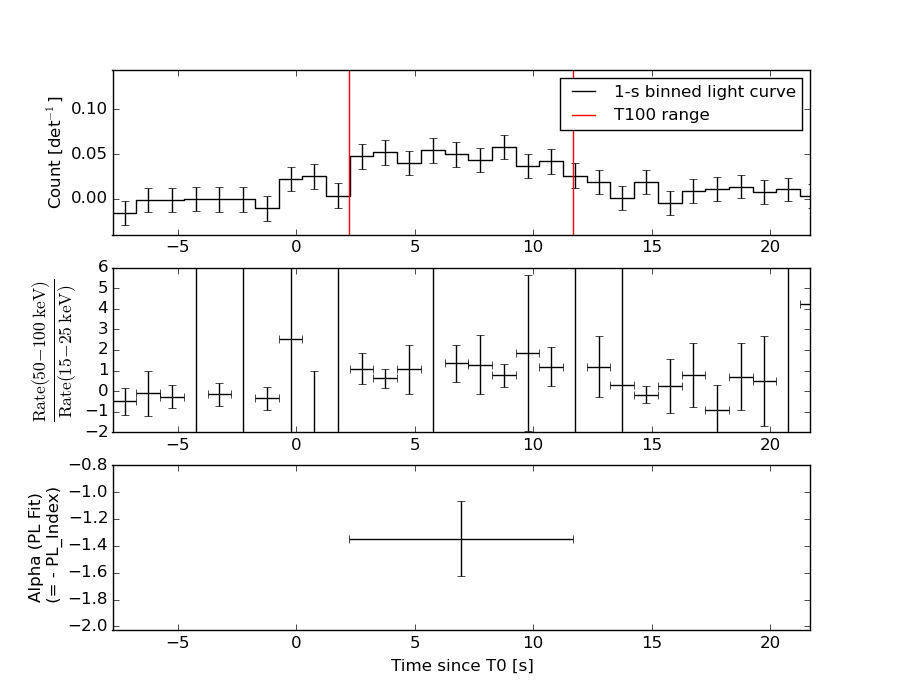
1 s binning
From T0-310 s to T0+310 s
From T100_start - 20 s to T100_end + 30 s
Full time interval

64 ms binning
Full time interval
From T100_start to T100_end
From T0-5 sec to T0+5 sec
16 ms binning
From T100_start-5 s to T100_start+5 s
Blue+Cyan dotted lines: Time interval of the scaled map
From 0.000000 to 12.160000
8 ms binning
From T100_start-3 s to T100_start+3 s
Blue+Cyan dotted lines: Time interval of the scaled map
From 0.000000 to 12.160000
2 ms binning
From T100_start-1 s to T100_start+1 s
Blue+Cyan dotted lines: Time interval of the scaled map
From 0.000000 to 12.160000
SN=5 or 10 sec. binning (whichever binning is satisfied first)

SN=5 or 10 sec. binning (T < 200 sec)
Quad-rate summed light curves (from T0-300s to T0+1000s)
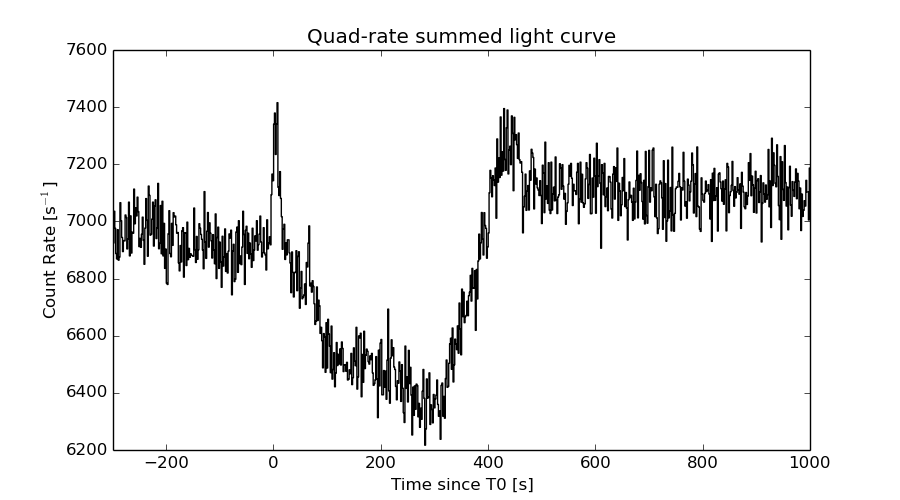
The mask-weighted light curves based on cleaned DPHs

Spectral Evolution
Spectra
Notes:
- 1) The fitting includes the systematic errors.
- 2) When the burst includes telescope slew time periods, the fitting uses an average response file made from multiple 5-s response files through out the slew time plus single time preiod for the non-slew times, and weighted by the total counts in the corresponding time period using addrmf. An average response file is needed becuase a spectral fit using the pre-slew DRM will introduce some errors in both a spectral shape and a normalization if the PHA file contains a lot of the slew/post-slew time interval.
- 3) For fits to more complicated models (e.g. a power-law over a cutoff power-law), the BAT team has decided to require a chi-square improvement of more than 6 for each extra dof.
Time averaged spectrum fit using the average DRM
Power-law model

Time interval is from    2.244 sec. to   11.676 sec.

Spectral model in power-law:
------------------------------------------------------------
Parameters  : value       lower 90%   higher 90%
Photon index: 1.34592     ( -0.279583   0.275889 )
Norm@50keV  : 3.09471E-03    ( -0.00048326   0.000482605 )
------------------------------------------------------------
#Fit statistic : Chi-Squared =          54.96 using 59 PHA bins.
# Reduced chi-squared =         0.9642 for     57 degrees of freedom
# Null hypothesis probability =   5.519712e-01

Photon flux (15-150 keV)    in 9.432 sec: 0.372512 ( -0.0598418  0.060068 ) ph/cm2/s
Energy fluence (15-150 keV)             : 2.85347e-07 ( -4.89791e-08  4.96445e-08 ) ergs/cm2
Cutoff power-law model

Time interval is from    2.244 sec. to   11.676 sec.
Spectral model in the cutoff power-law:
------------------------------------------------------------
Parameters  : value       lower 90%   higher 90%
Photon index: 1.08584     ( -1.23954   1.57593 )
Epeak [keV] : 180.841      ( -180.868 -180.868 )
Norm@50keV  : 4.16066E-03    ( -0.00151764   0.0122224 )
------------------------------------------------------------
#Fit statistic : Chi-Squared =          54.78 using 59 PHA bins.
# Reduced chi-squared =         0.9782 for     56 degrees of freedom
# Null hypothesis probability =   5.211698e-01

Photon flux (15-150 keV)    in 9.432 sec: 0.367990 ( -0.062592  0.062479 ) ph/cm2/s
Energy fluence (15-150 keV)             : 2.7977e-07 ( -5.4948e-08  5.34898e-08 ) ergs/cm2
Band function
Time interval is from    2.244 sec. to   11.676 sec.

Spectral model in the Band function:
------------------------------------------------------------
Parameters  : value       lower 90%   higher 90%
alpha       : 1.15580   ( -4.48025   -4.48025 )
beta        : -1.52488    ( -0.401036   0.352094 )
Epeak [keV] : 40.7365      ( -46.2755 57.7162 )
Norm@50keV   : 0.127710    ( -0.129551   38.5598 )
------------------------------------------------------------
#Fit statistic : Chi-Squared =          54.07 using 59 PHA bins.
# Reduced chi-squared =         0.9831 for     55 degrees of freedom
# Null hypothesis probability =   5.100968e-01

Photon flux (15-150 keV)    in 9.432 sec:  (    ) ph/cm2/s
Energy fluence (15-150 keV)             : 0 ( 0  0 ) ergs/cm2
Single BB

Spectral model blackbody:
------------------------------------------------------------
Parameters  : value    Lower 90%  Upper 90%
kT [keV]    : 16.6738  (-3.31681  4.32439)
R^2/D10^2   : 2.98190E-02  (-0.0161774   0.0342882)
(R is the radius in km and D10 is the distance to the source in units of 10 kpc)
------------------------------------------------------------
#Fit statistic : Chi-Squared =          63.45 using 59 PHA bins.
# Reduced chi-squared =          1.113 for     57 degrees of freedom
# Null hypothesis probability =   2.596931e-01

Energy  Fluence     90% Error
[keV]   [erg/cm2]   [erg/cm2]
15- 25  1.601e-08   5.340e-09
25- 50  6.973e-08   1.992e-08
50-150  1.375e-07   4.243e-08
15-150  2.233e-07   5.810e-08
Thermal bremsstrahlung (OTTB)
Spectral model: thermal bremsstrahlung
------------------------------------------------------------
Parameters  : value         Lower 90%    Upper 90%
kT [keV]    : 200.000       (      )
Norm        : 1.54597       (-0.241777     0.241754)
------------------------------------------------------------
#Fit statistic : Chi-Squared =          56.30 using 59 PHA bins.
# Reduced chi-squared =         0.9877 for     57 degrees of freedom
# Null hypothesis probability =   5.014124e-01

Energy  Fluence     90% Error
[keV]   [erg/cm2]   [erg/cm2]
15- 25  3.631e-08   2.092e-08
25- 50  6.985e-08   3.923e-08
50-150  1.532e-07   8.531e-08
15-150  2.594e-07   1.472e-07
Double BB

Spectral model: bbodyrad<1> + bbodyrad<2>
------------------------------------------------------------
Parameters  : value         Lower 90%    Upper 90%
kT1 [keV]   : 8.01170        (-3.05423      4.88153)
R1^2/D10^2  : 0.235453        (-0.175818      0.374159)
kT2 [keV]   : 31.4851        (-11.986      -31.6715)
R2^2/D10^2  : 2.75382E-03    (-0.00270183   0.00746913)
------------------------------------------------------------
#Fit statistic : Chi-Squared =          54.01 using 59 PHA bins.
# Reduced chi-squared =         0.9820 for     55 degrees of freedom
# Null hypothesis probability =   5.124188e-01

Energy  Fluence     90% Error
[keV]   [erg/cm2]   [erg/cm2]
15- 25  2.971e-08   1.758e-08
25- 50  6.986e-08   3.857e-08
50-150  1.806e-07   1.019e-07
15-150  2.801e-07   1.448e-07
Peak spectrum fit
Power-law model

Time interval is from    5.480 sec. to    6.480 sec.

Spectral model in power-law:
------------------------------------------------------------
Parameters  : value       lower 90%   higher 90%
Photon index: 1.00886     ( -0.604807   0.514144 )
Norm@50keV  : 4.65914E-03    ( -0.0015134   0.00146615 )
------------------------------------------------------------
#Fit statistic : Chi-Squared =          87.56 using 59 PHA bins.
# Reduced chi-squared =          1.536 for     57 degrees of freedom
# Null hypothesis probability =   5.733856e-03

Photon flux (15-150 keV)    in 1 sec: 0.535533 ( -0.172249  0.177499 ) ph/cm2/s
Energy fluence (15-150 keV)             : 5.02238e-08 ( -1.58007e-08  1.59888e-08 ) ergs/cm2
Cutoff power-law model
Time interval is from    5.480 sec. to    6.480 sec.
Spectral model in the cutoff power-law:
------------------------------------------------------------
Parameters  : value       lower 90%   higher 90%
Photon index: 0.619272     ( -2.666   -0.634507 )
Epeak [keV] : 187.722      ( -192.874 -192.874 )
Norm@50keV  : 7.20588E-03    ( -0.00384588   0.159319 )
------------------------------------------------------------
#Fit statistic : Chi-Squared =          87.44 using 59 PHA bins.
# Reduced chi-squared =          1.561 for     56 degrees of freedom
# Null hypothesis probability =   4.564631e-03

Photon flux (15-150 keV)    in 1 sec: 0.530709 ( -0.174074  0.17864 ) ph/cm2/s
Energy fluence (15-150 keV)             : 4.89721e-08 ( -1.8294e-08  1.69038e-08 ) ergs/cm2
Band function
Time interval is from    5.480 sec. to    6.480 sec.

Spectral model in the Band function:
------------------------------------------------------------
Parameters  : value       lower 90%   higher 90%
alpha       : 4.95747   ( -4.95747   -4.95747 )
beta        : -1.48445    ( -1.21353   0.773161 )
Epeak [keV] : 38.0813      ( -38.0813 38.4237 )
Norm@50keV   : 32.7530    ( -9.51484   833511 )
------------------------------------------------------------
#Fit statistic : Chi-Squared =          84.98 using 59 PHA bins.
# Reduced chi-squared =          1.545 for     55 degrees of freedom
# Null hypothesis probability =   5.853914e-03

Photon flux (15-150 keV)    in 1 sec:  (    ) ph/cm2/s
Energy fluence (15-150 keV)             : 0 ( 0  0 ) ergs/cm2
Single BB

Spectral model blackbody:
------------------------------------------------------------
Parameters  : value    Lower 90%  Upper 90%
kT [keV]    : 19.4271  (-7.58471  16.9033)
R^2/D10^2   : 2.79783E-02  (-0.027665   0.120033)
(R is the radius in km and D10 is the distance to the source in units of 10 kpc)
------------------------------------------------------------
#Fit statistic : Chi-Squared =          89.52 using 59 PHA bins.
# Reduced chi-squared =          1.571 for     57 degrees of freedom
# Null hypothesis probability =   3.841080e-03

Energy  Fluence     90% Error
[keV]   [erg/cm2]   [erg/cm2]
15- 25  2.059e-09   1.326e-09
25- 50  1.005e-08   6.285e-09
50-150  2.801e-08   1.820e-08
15-150  4.012e-08   2.421e-08
Thermal bremsstrahlung (OTTB)
Spectral model: thermal bremsstrahlung
------------------------------------------------------------
Parameters  : value         Lower 90%    Upper 90%
kT [keV]    : 199.363       (-99.6773      -199.363)
Norm        : 2.29245       (-0.728923     0.728922)
------------------------------------------------------------
#Fit statistic : Chi-Squared =          90.28 using 59 PHA bins.
# Reduced chi-squared =          1.584 for     57 degrees of freedom
# Null hypothesis probability =   3.280977e-03

Energy  Fluence     90% Error
[keV]   [erg/cm2]   [erg/cm2]
15- 25  5.708e-09   3.622e-09
25- 50  1.098e-08   6.605e-09
50-150  2.408e-08   1.479e-08
15-150  4.077e-08   2.571e-08
Double BB
------------------------------------------------------------
#Fit statistic : Chi-Squared =          89.52 using 59 PHA bins.
#Fit statistic : Chi-Squared =          85.27 using 59 PHA bins.
#Fit statistic : Chi-Squared =          85.25 using 59 PHA bins.
#Fit statistic : Chi-Squared =          85.21 using 59 PHA bins.
# Reduced chi-squared =          1.628 for     55 degrees of freedom
# Reduced chi-squared =          1.550 for     55 degrees of freedom
# Reduced chi-squared =          1.550 for     55 degrees of freedom
# Reduced chi-squared =          1.549 for     55 degrees of freedom
# Null hypothesis probability =   2.249944e-03
# Null hypothesis probability =   5.518267e-03
# Null hypothesis probability =   5.540766e-03
# Null hypothesis probability =   5.583155e-03

Energy  Fluence     90% Error
[keV]   [erg/cm2]   [erg/cm2]
15- 25  0.000e+00   0.000e+00
25- 50  0.000e+00   0.000e+00
50-150  0.000e+00   0.000e+00
15-150  0.000e+00   0.000e+00
Pre-slew spectrum (Pre-slew PHA with pre-slew DRM)
Power-law model

Spectral model in power-law:
------------------------------------------------------------
Parameters  : value       lower 90%   higher 90%
Photon index: 1.34592     ( -0.279583   0.275889 )
Norm@50keV  : 3.09471E-03    ( -0.00048326   0.000482605 )
------------------------------------------------------------
#Fit statistic : Chi-Squared =          54.96 using 59 PHA bins.
# Reduced chi-squared =         0.9642 for     57 degrees of freedom
# Null hypothesis probability =   5.519712e-01

Photon flux (15-150 keV)    in 9.432 sec: 0.372512 ( -0.0598418  0.060068 ) ph/cm2/s
Energy fluence (15-150 keV)             : 2.85347e-07 ( -4.89791e-08  4.96445e-08 ) ergs/cm2
Cutoff power-law model

Spectral model in the cutoff power-law:
------------------------------------------------------------
Parameters  : value       lower 90%   higher 90%
Photon index: 1.08584     ( -1.23954   1.57593 )
Epeak [keV] : 180.841      ( -180.868 -180.868 )
Norm@50keV  : 4.16066E-03    ( -0.00151764   0.0122224 )
------------------------------------------------------------
#Fit statistic : Chi-Squared =          54.78 using 59 PHA bins.
# Reduced chi-squared =         0.9782 for     56 degrees of freedom
# Null hypothesis probability =   5.211698e-01

Photon flux (15-150 keV)    in 9.432 sec: 0.367990 ( -0.062592  0.062479 ) ph/cm2/s
Energy fluence (15-150 keV)             : 2.7977e-07 ( -5.4948e-08  5.34898e-08 ) ergs/cm2
Band function

Spectral model in the Band function:
------------------------------------------------------------
Parameters  : value       lower 90%   higher 90%
alpha       : 1.15580   ( -4.48025   -4.48025 )
beta        : -1.52488    ( -0.401036   0.352094 )
Epeak [keV] : 40.7365      ( -46.2755 57.7162 )
Norm@50keV   : 0.127710    ( -0.129551   38.5532 )
------------------------------------------------------------
#Fit statistic : Chi-Squared =          54.07 using 59 PHA bins.
# Reduced chi-squared =         0.9831 for     55 degrees of freedom
# Null hypothesis probability =   5.100968e-01

Photon flux (15-150 keV)    in 9.432 sec:  (    ) ph/cm2/s
Energy fluence (15-150 keV)             : 0 ( 0  0 ) ergs/cm2
S(25-50 keV) vs. S(50-100 keV) plot

S(25-50 keV)  = 6.52e-08
S(50-100 keV) = 1.03e-07
T90 vs. Hardness ratio plot

T90                                   = 7.6039999127388 sec.
Hardness ratio (energy fluence ratio) = 1.57975
Color vs. Color plot

Count Ratio  (25-50 keV) / (15-25 keV) = 1.73417
Count Ratio (50-100 keV) / (15-25 keV) = 1.3373
Mask shadow pattern

IMX = -3.156132590397236E-01, IMY = -4.412741659074138E-01
TIME vs. PHA plot around the trigger time
Blue+Cyan dotted lines: Time interval of the scaled map
From 0.000000 to 12.160000
TIME vs. DetID plot around the trigger time
Blue+Cyan dotted lines: Time interval of the scaled map
From 0.000000 to 12.160000
100 us light curve (15-350 keV)

Blue+Cyan dotted lines: Time interval of the scaled map
From 0.000000 to 12.160000
Spacecraft aspect plot
Bright source in the pre-burst/pre-slew/post-slew images
Pre-burst image of 15-350 keV band
Time interval of the image:
-239.744000 2.244000

# RAcent  DECcent POSerr Theta    Phi  PeakCts   SNR AngSep     Name
#  [deg]    [deg]    ['] [deg]  [deg]                   [']
244.9761 -15.6424    0.3  50.4   -0.1  19.1982  38.7    0.2	Sco X-1
254.6136  35.4387   21.7  35.9  -77.2   0.3152   0.5    9.6	Her X-1
168.5806  15.7407    2.5  43.9  126.0   3.5909   4.5 ------	UNKNOWN
Pre-slew background subtracted image of 15-350 keV band
Time interval of the image:
2.244000 11.676000

# RAcent  DECcent POSerr Theta    Phi  PeakCts   SNR AngSep     Name
#  [deg]    [deg]    ['] [deg]  [deg]                   [']
245.0505 -15.5720    7.4  50.4   -0.2  -0.1150  -1.6    5.8	Sco X-1
254.3658  35.2148    6.8  35.6  -76.8   0.1058   1.7    8.9	Her X-1
214.5084 -15.0494    2.1  40.2   39.3   0.3433   5.5 ------	UNKNOWN
184.0500  20.2252    1.1  28.5  125.6   0.4460  10.4 ------	UNKNOWN
148.8855  65.8535    2.3  57.3 -167.1   0.6685   5.1 ------	UNKNOWN
Post-slew image of 15-350 keV band
Time interval of the image:
113.356600 303.756630

# RAcent  DECcent POSerr Theta    Phi  PeakCts   SNR AngSep     Name
#  [deg]    [deg]    ['] [deg]  [deg]                   [']
149.1948  -7.0848    2.7  43.8  126.0   2.7197   4.3 ------	UNKNOWN
177.0434  17.8846    2.6   7.0  142.8   0.5963   4.4 ------	UNKNOWN
203.7684  10.1449    2.8  21.5    6.1   0.5617   4.2 ------	UNKNOWN
122.0316  25.7163    3.7  56.9  179.2   3.0381   3.2 ------	UNKNOWN
119.7489  30.1534    4.1  58.3 -175.3   2.7915   2.8 ------	UNKNOWN
119.2978  32.6269    2.7  58.5 -172.4   4.1924   4.3 ------	UNKNOWN
Plot creation:
Sat May 30 14:01:43 EDT 2015