Click here for the BAT GCN circular template
Image
Pre-slew 15.0-350.0 keV image (Event data)
#   RAcent    DECcent   POSerr    Theta     Phi              Peak Cts       SNR   Name
  281.8358   -11.1920   0.0237    26.8111  -172.8743         0.0793030      8.111 TRIG_00592544

Foreground time interval of the image:
 -0.176   0.464 (delta_t =   0.640 [sec])
Background time interval of the image:
-239.728  -0.176 (delta_t = 239.552 [sec])
Lightcurves
Notes:
- 1) The mask-weighted light curves are using the flight position.
- 2) Multiple plots of different time binning/intervals are shown to cover all scenarios of short/long GRBs, rate/image triggers, and real/false positives.
- 3) For all the mask-weighted lightcurves, the y-axis units are counts/sec/det where a det is 0.4 x 0.4 = 0.16 sq cm.
- 4) The verticle lines correspond to following: green dotted lines are T50 interval, black dotted lines are T90 interval, blue solid line(s) is a spacecraft slew start time, and orange solid line(s) is a spacecraft slew end time.
- 5) Time of each bin is in the middle of the bin.
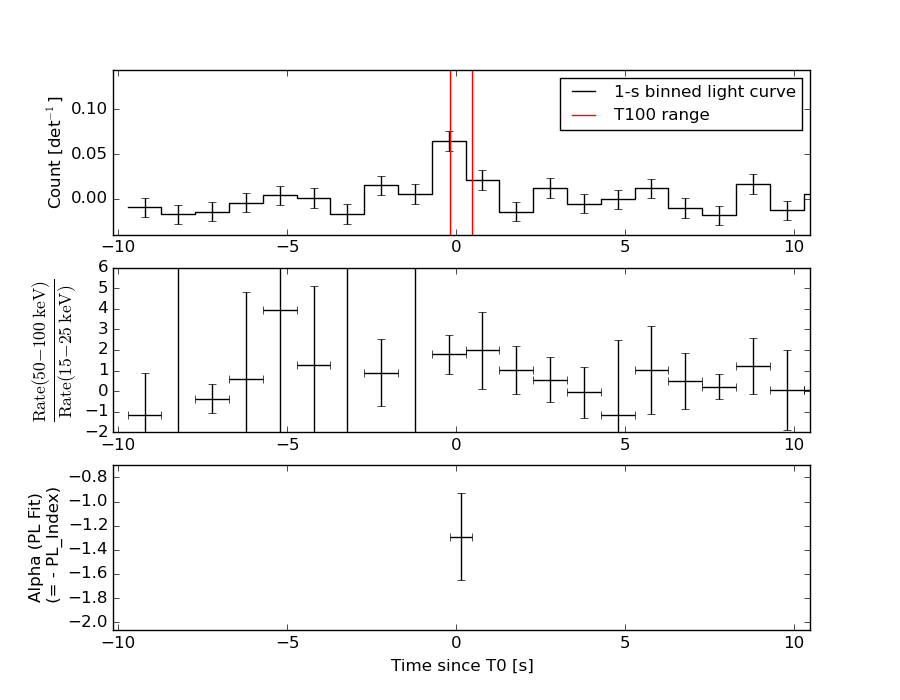
1 s binning
From T0-310 s to T0+310 s

From T100_start - 20 s to T100_end + 30 s

Full time interval

64 ms binning
Full time interval
From T100_start to T100_end
From T0-5 sec to T0+5 sec
16 ms binning
From T100_start-5 s to T100_start+5 s
Blue+Cyan dotted lines: Time interval of the scaled map
From 0.000000 to 0.256000
8 ms binning
From T100_start-3 s to T100_start+3 s
Blue+Cyan dotted lines: Time interval of the scaled map
From 0.000000 to 0.256000
2 ms binning
From T100_start-1 s to T100_start+1 s
Blue+Cyan dotted lines: Time interval of the scaled map
From 0.000000 to 0.256000
SN=5 or 10 sec. binning (whichever binning is satisfied first)
SN=5 or 10 sec. binning (T < 200 sec)
Quad-rate summed light curves (from T0-300s to T0+1000s)
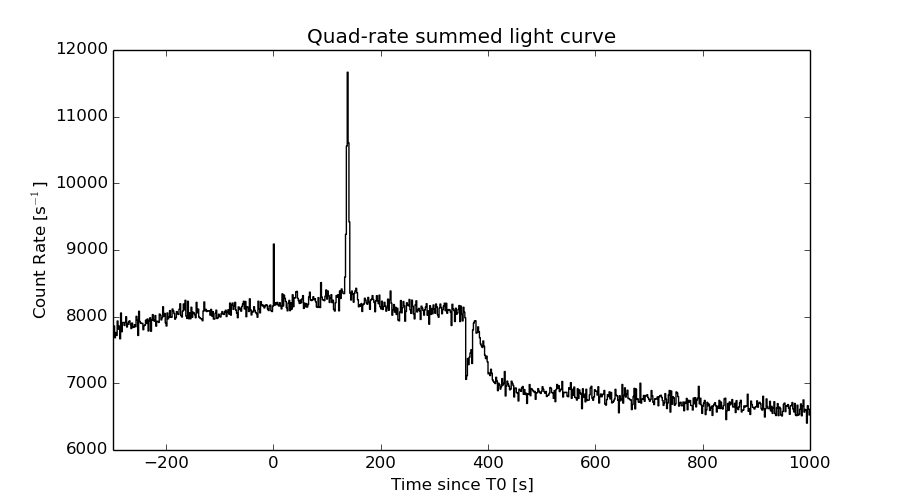
The mask-weighted light curves based on cleaned DPHs

Spectral Evolution
Spectra
Notes:
- 1) The fitting includes the systematic errors.
- 2) When the burst includes telescope slew time periods, the fitting uses an average response file made from multiple 5-s response files through out the slew time plus single time preiod for the non-slew times, and weighted by the total counts in the corresponding time period using addrmf. An average response file is needed becuase a spectral fit using the pre-slew DRM will introduce some errors in both a spectral shape and a normalization if the PHA file contains a lot of the slew/post-slew time interval.
- 3) For fits to more complicated models (e.g. a power-law over a cutoff power-law), the BAT team has decided to require a chi-square improvement of more than 6 for each extra dof.
Time averaged spectrum fit using the average DRM
Power-law model
Time interval is from   -0.176 sec. to    0.464 sec.

Spectral model in power-law:
------------------------------------------------------------
Parameters  : value       lower 90%   higher 90%
Photon index: 1.29291     ( -0.359623   0.358754 )
Norm@50keV  : 8.27767E-03    ( -0.00157527   0.00157456 )
------------------------------------------------------------
#Fit statistic : Chi-Squared =          69.13 using 59 PHA bins.
# Reduced chi-squared =          1.213 for     57 degrees of freedom
# Null hypothesis probability =   1.302202e-01

Photon flux (15-150 keV)    in 0.64 sec: 0.986266 ( -0.194608  0.195852 ) ph/cm2/s
Energy fluence (15-150 keV)             : 5.24422e-08 ( -1.10778e-08  1.12214e-08 ) ergs/cm2
Cutoff power-law model
Time interval is from   -0.176 sec. to    0.464 sec.
Spectral model in the cutoff power-law:
------------------------------------------------------------
Parameters  : value       lower 90%   higher 90%
Photon index: 2.51875     (     )
Epeak [keV] : 168.789      (   )
Norm@50keV  : 1.82924E-03    (     )
------------------------------------------------------------
#Fit statistic : Chi-Squared =          68.72 using 59 PHA bins.
# Reduced chi-squared =          1.227 for     56 degrees of freedom
# Null hypothesis probability =   1.182902e-01

Photon flux (15-150 keV)    in 0.64 sec: 0.984840 ( -0.205631  0.19558 ) ph/cm2/s
Energy fluence (15-150 keV)             : 5.25007e-08 ( -1.13782e-08  1.11488e-08 ) ergs/cm2
Band function

Time interval is from   -0.176 sec. to    0.464 sec.

Spectral model in the Band function:
------------------------------------------------------------
Parameters  : value       lower 90%   higher 90%
alpha       : -2.50805   ( 1.64499   2.50805 )
beta        : -1.29288    ( -0.358955   0.359483 )
Epeak [keV] : 298.772      ( -298.772 -298.772 )
Norm@50keV   : 1.12505    ( -0.214131   0.214008 )
------------------------------------------------------------
#Fit statistic : Chi-Squared =          69.13 using 59 PHA bins.
# Reduced chi-squared =          1.257 for     55 degrees of freedom
# Null hypothesis probability =   9.533295e-02

Photon flux (15-150 keV)    in 0.64 sec:  (    ) ph/cm2/s
Energy fluence (15-150 keV)             : 0 ( 0  0 ) ergs/cm2
Single BB
Spectral model blackbody:
------------------------------------------------------------
Parameters  : value    Lower 90%  Upper 90%
kT [keV]    : 21.6917  (-5.03375  6.77998)
R^2/D10^2   : 3.37533E-02  (-0.0195003   0.0457144)
(R is the radius in km and D10 is the distance to the source in units of 10 kpc)
------------------------------------------------------------
#Fit statistic : Chi-Squared =          75.63 using 59 PHA bins.
# Reduced chi-squared =          1.327 for     57 degrees of freedom
# Null hypothesis probability =   4.995606e-02

Energy  Fluence     90% Error
[keV]   [erg/cm2]   [erg/cm2]
15- 25  1.893e-09   7.830e-10
25- 50  9.927e-09   4.460e-09
50-150  3.488e-08   1.314e-08
15-150  4.670e-08   1.681e-08
Thermal bremsstrahlung (OTTB)

Spectral model: thermal bremsstrahlung
------------------------------------------------------------
Parameters  : value         Lower 90%    Upper 90%
kT [keV]    : 200.000       (      )
Norm        : 4.08759       (-0.787778     0.787701)
------------------------------------------------------------
#Fit statistic : Chi-Squared =          71.12 using 59 PHA bins.
# Reduced chi-squared =          1.248 for     57 degrees of freedom
# Null hypothesis probability =   9.888279e-02

Energy  Fluence     90% Error
[keV]   [erg/cm2]   [erg/cm2]
15- 25  6.515e-09   3.901e-09
25- 50  1.253e-08   7.306e-09
50-150  2.748e-08   1.575e-08
15-150  4.653e-08   2.700e-08
Double BB
Spectral model: bbodyrad<1> + bbodyrad<2>
------------------------------------------------------------
Parameters  : value         Lower 90%    Upper 90%
kT1 [keV]   : 4.21951        (-2.68669      3.68377)
R1^2/D10^2  : 7.13204        (-6.64962      5801.82)
kT2 [keV]   : 26.6610        (-6.96048      13.0044)
R2^2/D10^2  : 1.61486E-02    (-0.0115028   0.0275423)
------------------------------------------------------------
#Fit statistic : Chi-Squared =          66.31 using 59 PHA bins.
# Reduced chi-squared =          1.206 for     55 degrees of freedom
# Null hypothesis probability =   1.412669e-01

Energy  Fluence     90% Error
[keV]   [erg/cm2]   [erg/cm2]
15- 25  6.578e-09   3.598e-09
25- 50  9.457e-09   4.318e-09
50-150  3.761e-08   2.265e-08
15-150  5.365e-08   2.697e-08
Peak spectrum fit
Power-law model
Time interval is from   -0.356 sec. to    0.644 sec.

Spectral model in power-law:
------------------------------------------------------------
Parameters  : value       lower 90%   higher 90%
Photon index: 1.29788     ( -0.467566   0.4682 )
Norm@50keV  : 5.20299E-03    ( -0.00121617   0.00121597 )
------------------------------------------------------------
#Fit statistic : Chi-Squared =          61.87 using 59 PHA bins.
# Reduced chi-squared =          1.085 for     57 degrees of freedom
# Null hypothesis probability =   3.064582e-01

Photon flux (15-150 keV)    in 1 sec: 0.620482 ( -0.152352  0.153583 ) ph/cm2/s
Energy fluence (15-150 keV)             : 5.1442e-08 ( -1.3293e-08  1.34683e-08 ) ergs/cm2
Cutoff power-law model

Time interval is from   -0.356 sec. to    0.644 sec.
Spectral model in the cutoff power-law:
------------------------------------------------------------
Parameters  : value       lower 90%   higher 90%
Photon index: 1.28685     ( -0.610855   0.474103 )
Epeak [keV] : 9999.32      ( -9999.36 -9999.36 )
Norm@50keV  : 5.21992E-03    ( -0.00122221   0.0176868 )
------------------------------------------------------------
#Fit statistic : Chi-Squared =          61.87 using 59 PHA bins.
# Reduced chi-squared =          1.105 for     56 degrees of freedom
# Null hypothesis probability =   2.744874e-01

Photon flux (15-150 keV)    in 1 sec: 0.622181 ( -0.157038  0.151443 ) ph/cm2/s
Energy fluence (15-150 keV)             : 5.14466e-08 ( -1.32768e-08  1.33715e-08 ) ergs/cm2
Band function

Time interval is from   -0.356 sec. to    0.644 sec.

Spectral model in the Band function:
------------------------------------------------------------
Parameters  : value       lower 90%   higher 90%
alpha       : -1.29877   ( -0.466976   1.72491 )
beta        : -9.33789    ( 6.1799   9.33789 )
Epeak [keV] : 9999.36      ( -9925.46 -9999.36 )
Norm@50keV   : 5.21441E-03    ( -0.00122155   0.0176972 )
------------------------------------------------------------
#Fit statistic : Chi-Squared =          61.87 using 59 PHA bins.
# Reduced chi-squared =          1.125 for     55 degrees of freedom
# Null hypothesis probability =   2.441720e-01

Photon flux (15-150 keV)    in 1 sec:  (    ) ph/cm2/s
Energy fluence (15-150 keV)             : 0 ( 0  0 ) ergs/cm2
Single BB
Spectral model blackbody:
------------------------------------------------------------
Parameters  : value    Lower 90%  Upper 90%
kT [keV]    : 23.0894  (-6.21994  9.38124)
R^2/D10^2   : 1.72765E-02  (-0.0112937   0.0302383)
(R is the radius in km and D10 is the distance to the source in units of 10 kpc)
------------------------------------------------------------
#Fit statistic : Chi-Squared =          66.25 using 59 PHA bins.
# Reduced chi-squared =          1.162 for     57 degrees of freedom
# Null hypothesis probability =   1.880430e-01

Energy  Fluence     90% Error
[keV]   [erg/cm2]   [erg/cm2]
15- 25  1.666e-09   1.008e-09
25- 50  9.059e-09   5.107e-09
50-150  3.607e-08   1.958e-08
15-150  4.679e-08   2.255e-08
Thermal bremsstrahlung (OTTB)
Spectral model: thermal bremsstrahlung
------------------------------------------------------------
Parameters  : value         Lower 90%    Upper 90%
kT [keV]    : 199.359       (-94.3809      -199.362)
Norm        : 2.57702       (-0.610729     0.612892)
------------------------------------------------------------
#Fit statistic : Chi-Squared =          63.37 using 59 PHA bins.
# Reduced chi-squared =          1.112 for     57 degrees of freedom
# Null hypothesis probability =   2.617681e-01

Energy  Fluence     90% Error
[keV]   [erg/cm2]   [erg/cm2]
15- 25  6.417e-09   3.907e-09
25- 50  1.234e-08   7.260e-09
50-150  2.707e-08   1.599e-08
15-150  4.583e-08   2.683e-08
Double BB
Spectral model: bbodyrad<1> + bbodyrad<2>
------------------------------------------------------------
Parameters  : value         Lower 90%    Upper 90%
kT1 [keV]   : 1.99573        (-1.22978      4.09951)
R1^2/D10^2  : 527.671        (-572.777      9721)
kT2 [keV]   : 25.4895        (-6.84934      13.1135)
R2^2/D10^2  : 1.22065E-02    (-0.00876511   0.0211077)
------------------------------------------------------------
#Fit statistic : Chi-Squared =          57.48 using 59 PHA bins.
# Reduced chi-squared =          1.045 for     55 degrees of freedom
# Null hypothesis probability =   3.834262e-01

Energy  Fluence     90% Error
[keV]   [erg/cm2]   [erg/cm2]
15- 25  6.122e-09   3.299e-09
25- 50  7.939e-09   4.498e-09
50-150  3.752e-08   2.286e-08
15-150  5.158e-08   2.641e-08
Pre-slew spectrum (Pre-slew PHA with pre-slew DRM)
Power-law model

Spectral model in power-law:
------------------------------------------------------------
Parameters  : value       lower 90%   higher 90%
Photon index: 1.29291     ( -0.359623   0.358754 )
Norm@50keV  : 8.27767E-03    ( -0.00157527   0.00157456 )
------------------------------------------------------------
#Fit statistic : Chi-Squared =          69.13 using 59 PHA bins.
# Reduced chi-squared =          1.213 for     57 degrees of freedom
# Null hypothesis probability =   1.302202e-01

Photon flux (15-150 keV)    in 0.64 sec: 0.986266 ( -0.194608  0.195852 ) ph/cm2/s
Energy fluence (15-150 keV)             : 5.24422e-08 ( -1.10778e-08  1.12214e-08 ) ergs/cm2
Cutoff power-law model

Spectral model in the cutoff power-law:
------------------------------------------------------------
Parameters  : value       lower 90%   higher 90%
Photon index: 2.51875     (     )
Epeak [keV] : 168.789      (   )
Norm@50keV  : 1.82924E-03    (     )
------------------------------------------------------------
#Fit statistic : Chi-Squared =          68.72 using 59 PHA bins.
# Reduced chi-squared =          1.227 for     56 degrees of freedom
# Null hypothesis probability =   1.182902e-01

Photon flux (15-150 keV)    in 0.64 sec: 0.984840 ( -0.205631  0.19558 ) ph/cm2/s
Energy fluence (15-150 keV)             : 5.25007e-08 ( -1.13782e-08  1.11488e-08 ) ergs/cm2
Band function

Spectral model in the Band function:
------------------------------------------------------------
Parameters  : value       lower 90%   higher 90%
alpha       : -2.50805   ( 1.64499   2.50805 )
beta        : -1.29288    ( -0.358955   0.359483 )
Epeak [keV] : 298.772      ( -298.772 -298.772 )
Norm@50keV   : 1.12505    ( -0.214131   0.214008 )
------------------------------------------------------------
#Fit statistic : Chi-Squared =          69.13 using 59 PHA bins.
# Reduced chi-squared =          1.257 for     55 degrees of freedom
# Null hypothesis probability =   9.533295e-02

Photon flux (15-150 keV)    in 0.64 sec:  (    ) ph/cm2/s
Energy fluence (15-150 keV)             : 0 ( 0  0 ) ergs/cm2
S(25-50 keV) vs. S(50-100 keV) plot

S(25-50 keV)  = 1.16e-08
S(50-100 keV) = 1.90e-08
T90 vs. Hardness ratio plot
T90                                   = 0.512000024318695 sec.
Hardness ratio (energy fluence ratio) = 1.63793
Color vs. Color plot
Count Ratio  (25-50 keV) / (15-25 keV) = 1.23972
Count Ratio (50-100 keV) / (15-25 keV) = 1.54379
Mask shadow pattern
IMX = -5.014766492289734E-01, IMY = 6.269090877061936E-02
TIME vs. PHA plot around the trigger time
Blue+Cyan dotted lines: Time interval of the scaled map
From 0.000000 to 0.256000
TIME vs. DetID plot around the trigger time
Blue+Cyan dotted lines: Time interval of the scaled map
From 0.000000 to 0.256000
100 us light curve (15-350 keV)
Blue+Cyan dotted lines: Time interval of the scaled map
From 0.000000 to 0.256000
Spacecraft aspect plot
Bright source in the pre-burst/pre-slew/post-slew images
Pre-burst image of 15-350 keV band
Time interval of the image:
-239.728000 -0.176000

# RAcent  DECcent POSerr Theta    Phi  PeakCts   SNR AngSep     Name
#  [deg]    [deg]    ['] [deg]  [deg]                   [']
244.9794 -15.6142    1.7  41.0  124.2   5.1467   6.7    1.6	Sco X-1
255.9859 -37.8389    1.2  22.2   93.6   2.4398   9.3    0.3	4U 1700-377
256.6092 -36.5397    5.4  21.9   97.3   0.5530   2.1   10.9	GX 349+2
263.1092 -24.7235    2.8  22.2  132.5   0.9315   4.0    5.6	GX 1+4
264.7363 -44.4958    4.6  16.0   71.7   0.5421   2.5    2.8	4U 1735-44
268.2579  -1.6215    0.0  39.1  166.5   0.4978   1.4   12.1	SW J1753.5-0127
270.1394 -25.0630    4.1  17.5  145.4   0.6157   2.8    7.9	GX 5-1
270.2569 -25.6985    4.3  17.0  144.3   0.5934   2.7    3.6	GRS 1758-258
274.1382 -13.9629    6.9  25.6  169.1   0.4334   1.7    8.9	GX 17+2
275.7844 -30.3922    3.4  10.2  147.1   0.6996   3.4    7.4	H1820-303
285.1201 -24.7541    7.2  13.2 -164.0   0.4094   1.6   11.0	HT1900.1-2455
288.8445  10.9255    1.5  49.0 -161.7   3.7926   7.6    3.0	GRS 1915+105
263.1231 -33.9086    3.0  17.5  109.1   0.8419   3.8    8.0	GX 354-0
265.6935 -27.7292    1.4  18.5  130.2   1.8750   8.5 ------	UNKNOWN
266.1202 -28.7476    0.3  17.6  128.3   7.3542  32.9 ------	UNKNOWN
270.0268 -13.9124    2.4  27.1  160.8   1.1986   4.9 ------	UNKNOWN
268.1997  15.8296    2.3  55.8  173.5   5.4807   5.0 ------	UNKNOWN
 15.9170 -59.3305    3.0  58.9  -24.3   7.7711   3.8 ------	UNKNOWN
331.0116 -25.9428    2.6  41.1  -80.7   5.4316   4.5 ------	UNKNOWN
Pre-slew background subtracted image of 15-350 keV band
Time interval of the image:
-0.176000 0.464000

# RAcent  DECcent POSerr Theta    Phi  PeakCts   SNR AngSep     Name
#  [deg]    [deg]    ['] [deg]  [deg]                   [']
244.9864 -15.5140    3.9  41.1  124.4  -0.0970  -3.0    7.6	Sco X-1
255.8064 -37.7599    4.0  22.3   93.8   0.0327   2.9    9.9	4U 1700-377
256.3203 -36.5557    4.7  22.1   97.1   0.0270   2.5    9.7	GX 349+2
263.0112 -24.7455 2700.0  22.3  132.3  -0.0000  -0.0    0.1	GX 1+4
264.8226 -44.3065  642.2  15.9   72.3   0.0002   0.0    9.3	4U 1735-44
268.4235  -1.2928    3.0  39.4  166.9   0.0546   3.8   10.2	SW J1753.5-0127
270.1747 -24.9411    4.7  17.6  145.7  -0.0216  -2.5   10.2	GX 5-1
270.1314 -25.6106    0.0  17.1  144.2   0.0274   3.1   12.2	GRS 1758-258
273.9053 -13.9758   10.0  25.6  168.6   0.0112   1.2    6.9	GX 17+2
275.9555 -30.2901    3.7  10.2  148.1   0.0265   3.1    4.9	H1820-303
285.0328 -24.9209  119.5  13.0 -164.3  -0.0009  -0.1    0.2	HT1900.1-2455
288.8159  11.0870   81.9  49.2 -161.8   0.0028   0.1    8.6	GRS 1915+105
263.1574 -33.9738   42.9  17.4  108.9  -0.0027  -0.3   11.8	GX 354-0
227.9640 -61.7033    2.6  41.5   48.7   0.1157   4.5 ------	UNKNOWN
281.8349 -11.1928    1.4  26.8 -172.9   0.0798   8.2 ------	UNKNOWN
347.4629 -69.2165    2.1  45.5  -14.2   0.0841   5.5 ------	UNKNOWN
Post-slew image of 15-350 keV band
Time interval of the image:
64.372600 288.572600

# RAcent  DECcent POSerr Theta    Phi  PeakCts   SNR AngSep     Name
#  [deg]    [deg]    ['] [deg]  [deg]                   [']
244.9643 -15.6628    1.4  36.1   81.1   4.7610   8.3    1.6	Sco X-1
256.0818 -37.8705    2.6  35.3   38.9   1.5203   4.5    4.8	4U 1700-377
256.4219 -36.5403   15.4  34.2   40.3   0.2601   0.7    7.1	GX 349+2
262.8525 -24.5886  420.2  22.5   53.2   0.0067   0.0   12.7	GX 1+4
264.6458 -44.3130    3.7  36.3   23.4   0.9334   3.1    9.2	4U 1735-44
268.2202  -1.4562    6.0  16.7  127.2  -0.4032  -1.9    8.9	SW J1753.5-0127
270.2528 -24.9714    9.1  17.6   39.4   0.2577   1.3    6.7	GX 5-1
270.3709 -25.7817    3.0  18.2   37.5   0.8046   3.9    4.4	GRS 1758-258
273.8507 -13.9890    4.1   8.3   71.8   0.5692   2.8    9.5	GX 17+2
275.7624 -30.2692    3.5  19.9   18.0   0.6849   3.2   10.3	H1820-303
285.1964 -24.9145    8.6  14.1  -10.2   0.2962   1.3    8.7	HT1900.1-2455
288.8027  10.9687    0.8  23.2 -160.1   3.4217  14.4    1.4	GRS 1915+105
299.5761  35.2152    1.5  49.3 -158.5   4.2461   7.9    1.1	Cyg X-1
308.2685  40.8244    9.3  57.5 -154.1  -1.8469  -1.3   10.5	Cyg X-3
262.9877 -33.7902    3.7  28.4   36.8   0.7955   3.2    2.7	GX 354-0
265.6420 -27.7410    1.7  22.5   42.7   1.5608   6.8 ------	UNKNOWN
266.1379 -28.7451    0.4  22.9   40.0   7.6896  32.7 ------	UNKNOWN
277.3813 -23.7814    2.2  13.3   20.5   1.0882   5.1 ------	UNKNOWN
294.9358 -10.9606    2.4  12.8  -87.3   1.0165   4.8 ------	UNKNOWN
315.9326 -45.8908    5.6  45.2  -31.0   0.8629   2.1 ------	UNKNOWN
321.4313   1.6304    3.4  41.4 -103.2   4.4118   3.4 ------	UNKNOWN
	UNKNOWN
Plot creation:
Sat May 30 14:00:09 EDT 2015