Click here for the BAT GCN circular template
Image
Pre-slew 15.0-350.0 keV image (Event data)
#   RAcent    DECcent   POSerr    Theta     Phi              Peak Cts       SNR   Name
  356.9636   -79.9134   0.0067    49.0687   159.1106         8.2755307     28.566 TRIG_00592916

Foreground time interval of the image:
-19.208  16.189 (delta_t =  35.397 [sec])
Background time interval of the image:
-385.011 -352.082 (delta_t =  32.929 [sec])
-239.712 -19.208 (delta_t = 220.504 [sec])
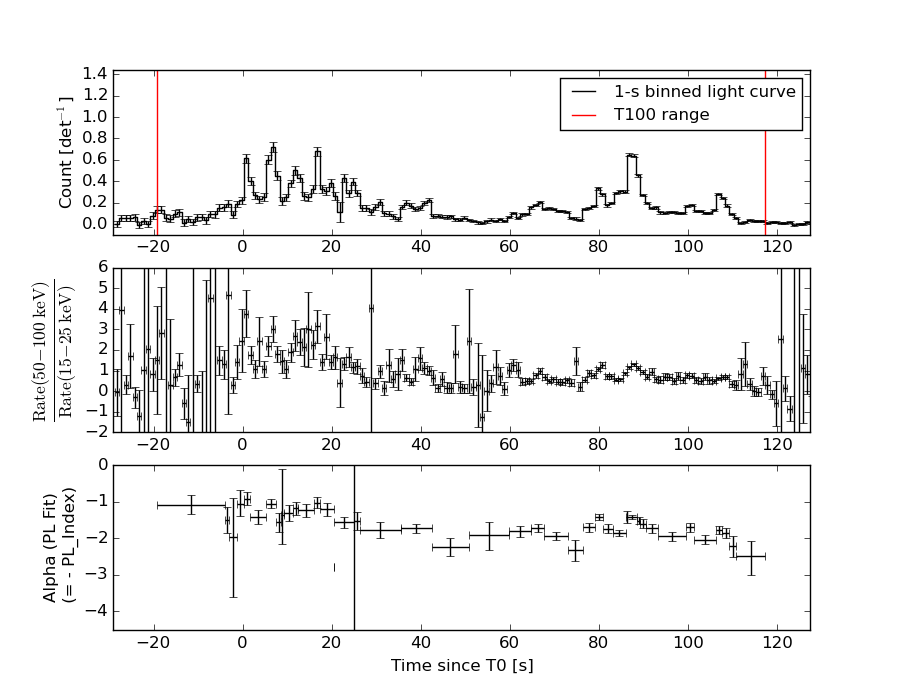
Lightcurves
Notes:
- 1) The mask-weighted light curves are using the flight position.
- 2) Multiple plots of different time binning/intervals are shown to cover all scenarios of short/long GRBs, rate/image triggers, and real/false positives.
- 3) For all the mask-weighted lightcurves, the y-axis units are counts/sec/det where a det is 0.4 x 0.4 = 0.16 sq cm.
- 4) The verticle lines correspond to following: green dotted lines are T50 interval, black dotted lines are T90 interval, blue solid line(s) is a spacecraft slew start time, and orange solid line(s) is a spacecraft slew end time.
- 5) Time of each bin is in the middle of the bin.
1 s binning
From T0-310 s to T0+310 s

From T100_start - 20 s to T100_end + 30 s

Full time interval

64 ms binning
Full time interval

From T100_start to T100_end
From T0-5 sec to T0+5 sec

16 ms binning
From T100_start-5 s to T100_start+5 s

Blue+Cyan dotted lines: Time interval of the scaled map
From 0.000000 to 1.024000
8 ms binning
From T100_start-3 s to T100_start+3 s

Blue+Cyan dotted lines: Time interval of the scaled map
From 0.000000 to 1.024000
2 ms binning
From T100_start-1 s to T100_start+1 s

Blue+Cyan dotted lines: Time interval of the scaled map
From 0.000000 to 1.024000
SN=5 or 10 sec. binning (whichever binning is satisfied first)

SN=5 or 10 sec. binning (T < 200 sec)

Quad-rate summed light curves (from T0-300s to T0+1000s)

The mask-weighted light curves based on cleaned DPHs

Spectral Evolution
Spectra
Notes:
- 1) The fitting includes the systematic errors.
- 2) When the burst includes telescope slew time periods, the fitting uses an average response file made from multiple 5-s response files through out the slew time plus single time preiod for the non-slew times, and weighted by the total counts in the corresponding time period using addrmf. An average response file is needed becuase a spectral fit using the pre-slew DRM will introduce some errors in both a spectral shape and a normalization if the PHA file contains a lot of the slew/post-slew time interval.
- 3) For fits to more complicated models (e.g. a power-law over a cutoff power-law), the BAT team has decided to require a chi-square improvement of more than 6 for each extra dof.
Time averaged spectrum fit using the average DRM
Power-law model

Multiple GTIs in the spectrum
tstart tstop
-19.208000 21.400100
22.288000 117.368000

Spectral model in power-law:
------------------------------------------------------------
Parameters  : value       lower 90%   higher 90%
Photon index: 1.50261     ( -0.042262   0.0422653 )
Norm@50keV  : 1.22210E-02    ( -0.000271842   0.000271828 )
------------------------------------------------------------
#Fit statistic : Chi-Squared =          52.00 using 59 PHA bins.
# Reduced chi-squared =         0.9123 for     57 degrees of freedom
# Null hypothesis probability =   6.626207e-01

Photon flux (15-150 keV)    in 135.7 sec: 1.52673 ( -0.0388102  0.0389456 ) ph/cm2/s
Energy fluence (15-150 keV)             : 1.57256e-05 ( -3.61102e-07  3.61342e-07 ) ergs/cm2
Cutoff power-law model

Multiple GTIs in the spectrum
tstart tstop
-19.208000 21.400100
22.288000 117.368000
Spectral model in the cutoff power-law:
------------------------------------------------------------
Parameters  : value       lower 90%   higher 90%
Photon index: 1.32410     ( -0.173199   0.163955 )
Epeak [keV] : 215.353      ( -78.1291 1535.19 )
Norm@50keV  : 1.46613E-02    ( -0.00216562   0.00275233 )
------------------------------------------------------------
#Fit statistic : Chi-Squared =          48.68 using 59 PHA bins.
# Reduced chi-squared =         0.8692 for     56 degrees of freedom
# Null hypothesis probability =   7.456440e-01

Photon flux (15-150 keV)    in 135.7 sec: 1.50485 ( -0.04325  0.04349 ) ph/cm2/s
Energy fluence (15-150 keV)             : 1.55694e-05 ( -3.94344e-07  3.92309e-07 ) ergs/cm2
Band function

Multiple GTIs in the spectrum
tstart tstop
-19.208000 21.400100
22.288000 117.368000

Spectral model in the Band function:
------------------------------------------------------------
Parameters  : value       lower 90%   higher 90%
alpha       : -0.969457   ( -0.432032   1.69734 )
beta        : -1.56950    ( 1.56945   0.0725153 )
Epeak [keV] : 79.4351      ( -46.0171 353.736 )
Norm@50keV   : 2.39673E-02    ( -0.0109647   0.125509 )
------------------------------------------------------------
#Fit statistic : Chi-Squared =          47.66 using 59 PHA bins.
# Reduced chi-squared =         0.8666 for     55 degrees of freedom
# Null hypothesis probability =   7.482089e-01

Photon flux (15-150 keV)    in 135.7 sec:  (    ) ph/cm2/s
Energy fluence (15-150 keV)             : 0 ( 0  0 ) ergs/cm2
Single BB

Spectral model blackbody:
------------------------------------------------------------
Parameters  : value    Lower 90%  Upper 90%
kT [keV]    : 17.3818  (  )
R^2/D10^2   : 9.97214E-02  (   )
(R is the radius in km and D10 is the distance to the source in units of 10 kpc)
------------------------------------------------------------
#Fit statistic : Chi-Squared =         460.42 using 59 PHA bins.
# Reduced chi-squared =         8.0775 for     57 degrees of freedom
# Null hypothesis probability =   1.887400e-64

Energy  Fluence     90% Error
[keV]   [erg/cm2]   [erg/cm2]
15- 25  8.274e-07   3.705e-08
25- 50  3.726e-06   1.215e-07
50-150  8.092e-06   3.304e-07
15-150  1.265e-05   3.257e-07
Thermal bremsstrahlung (OTTB)

Spectral model: thermal bremsstrahlung
------------------------------------------------------------
Parameters  : value         Lower 90%    Upper 90%
kT [keV]    : 200.000       (      )
Norm        : 6.27836       (-0.139657     0.139652)
------------------------------------------------------------
#Fit statistic : Chi-Squared =          63.88 using 59 PHA bins.
# Reduced chi-squared =          1.121 for     57 degrees of freedom
# Null hypothesis probability =   2.476395e-01

Energy  Fluence     90% Error
[keV]   [erg/cm2]   [erg/cm2]
15- 25  2.122e-06   5.360e-08
25- 50  4.081e-06   9.703e-08
50-150  8.951e-06   2.185e-07
15-150  1.515e-05   3.867e-07
Double BB
Spectral model: bbodyrad<1> + bbodyrad<2>
------------------------------------------------------------
Parameters  : value         Lower 90%    Upper 90%
kT1 [keV]   : 7.92588        (-0.66529      0.703454)
R1^2/D10^2  : 0.988835        (-0.242655      0.347798)
kT2 [keV]   : 29.6463        (-2.41771      3.09343)
R2^2/D10^2  : 1.24842E-02    (-0.0036964   0.00453364)
------------------------------------------------------------
#Fit statistic : Chi-Squared =          56.12 using 59 PHA bins.
# Reduced chi-squared =          1.020 for     55 degrees of freedom
# Null hypothesis probability =   4.325464e-01

Energy  Fluence     90% Error
[keV]   [erg/cm2]   [erg/cm2]
15- 25  1.748e-06   1.384e-07
25- 50  4.047e-06   1.832e-07
50-150  9.647e-06   5.869e-07
15-150  1.544e-05   8.278e-07
Peak spectrum fit
Power-law model
Time interval is from    6.420 sec. to    7.420 sec.

Spectral model in power-law:
------------------------------------------------------------
Parameters  : value       lower 90%   higher 90%
Photon index: 1.03015     ( -0.159704   0.155657 )
Norm@50keV  : 5.58294E-02    ( -0.0054997   0.00547322 )
------------------------------------------------------------
#Fit statistic : Chi-Squared =          55.49 using 59 PHA bins.
# Reduced chi-squared =         0.9735 for     57 degrees of freedom
# Null hypothesis probability =   5.319338e-01

Photon flux (15-150 keV)    in 1 sec: 6.43920 ( -0.650199  0.651943 ) ph/cm2/s
Energy fluence (15-150 keV)             : 5.97386e-07 ( -5.99763e-08  6.01004e-08 ) ergs/cm2
Cutoff power-law model

Time interval is from    6.420 sec. to    7.420 sec.
Spectral model in the cutoff power-law:
------------------------------------------------------------
Parameters  : value       lower 90%   higher 90%
Photon index: 0.288481     ( -0.826875   0.690829 )
Epeak [keV] : 137.367      ( -43.426 754.396 )
Norm@50keV  : 0.117050    ( -0.0575115   0.139533 )
------------------------------------------------------------
#Fit statistic : Chi-Squared =          52.13 using 59 PHA bins.
# Reduced chi-squared =         0.9309 for     56 degrees of freedom
# Null hypothesis probability =   6.221417e-01

Photon flux (15-150 keV)    in 1 sec: 6.30568 ( -0.66221  0.66478 ) ph/cm2/s
Energy fluence (15-150 keV)             : 5.88555e-07 ( -6.2718e-08  6.2093e-08 ) ergs/cm2
Band function
Time interval is from    6.420 sec. to    7.420 sec.

Spectral model in the Band function:
------------------------------------------------------------
Parameters  : value       lower 90%   higher 90%
alpha       : 4.99995   ( -4.99995   -4.99995 )
beta        : -1.19165    ( -0.364574   0.20245 )
Epeak [keV] : 36.9675      ( -36.9675 9.35329 )
Norm@50keV   : 411.116    ( -39.2773   1.13416e+07 )
------------------------------------------------------------
#Fit statistic : Chi-Squared =          55.39 using 59 PHA bins.
# Reduced chi-squared =          1.007 for     55 degrees of freedom
# Null hypothesis probability =   4.598737e-01

Photon flux (15-150 keV)    in 1 sec:  (    ) ph/cm2/s
Energy fluence (15-150 keV)             : 0 ( 0  0 ) ergs/cm2
Single BB

Spectral model blackbody:
------------------------------------------------------------
Parameters  : value    Lower 90%  Upper 90%
kT [keV]    : 21.9455  (-2.41472  2.87278)
R^2/D10^2   : 0.240242  (-0.0791865   0.11108)
(R is the radius in km and D10 is the distance to the source in units of 10 kpc)
------------------------------------------------------------
#Fit statistic : Chi-Squared =          61.51 using 59 PHA bins.
# Reduced chi-squared =          1.079 for     57 degrees of freedom
# Null hypothesis probability =   3.178565e-01

Energy  Fluence     90% Error
[keV]   [erg/cm2]   [erg/cm2]
15- 25  2.144e-08   4.250e-09
25- 50  1.132e-07   1.696e-08
50-150  4.073e-07   5.885e-08
15-150  5.419e-07   6.565e-08
Thermal bremsstrahlung (OTTB)

Spectral model: thermal bremsstrahlung
------------------------------------------------------------
Parameters  : value         Lower 90%    Upper 90%
kT [keV]    : 200.000       (      )
Norm        : 26.7886       (-2.69758     2.6973)
------------------------------------------------------------
#Fit statistic : Chi-Squared =          84.76 using 59 PHA bins.
# Reduced chi-squared =          1.487 for     57 degrees of freedom
# Null hypothesis probability =   9.948333e-03

Energy  Fluence     90% Error
[keV]   [erg/cm2]   [erg/cm2]
15- 25  6.672e-08   1.969e-08
25- 50  1.284e-07   5.721e-08
50-150  2.815e-07   1.529e-07
15-150  4.766e-07   1.847e-07
Double BB

R1^2/D10^2  : 9.07016E-03        (      )
kT2 [keV]   : 14.4275        (-9.90985      4.78438)
R2^2/D10^2  : 0.623711    (-0.339231   15.8761)
------------------------------------------------------------
#Fit statistic : Chi-Squared =          52.59 using 59 PHA bins.
#Fit statistic : Chi-Squared =          52.56 using 59 PHA bins.
#Fit statistic : Chi-Squared =          52.54 using 59 PHA bins.
# Reduced chi-squared =         0.9562 for     55 degrees of freedom
# Reduced chi-squared =         0.9556 for     55 degrees of freedom
# Reduced chi-squared =         0.9553 for     55 degrees of freedom
# Null hypothesis probability =   5.672677e-01
# Null hypothesis probability =   5.685694e-01
# Null hypothesis probability =   5.692135e-01

Energy  Fluence     90% Error
[keV]   [erg/cm2]   [erg/cm2]
15- 25  3.188e-08   1.770e-08
25- 50  1.247e-07   6.765e-08
50-150  4.303e-07   2.207e-07
15-150  5.868e-07   2.936e-07
Pre-slew spectrum (Pre-slew PHA with pre-slew DRM)
Power-law model

Spectral model in power-law:
------------------------------------------------------------
Parameters  : value       lower 90%   higher 90%
Photon index: 1.17254     ( -0.0725523   0.0717164 )
Norm@50keV  : 1.70997E-02    ( -0.000728854   0.000727104 )
------------------------------------------------------------
#Fit statistic : Chi-Squared =          66.93 using 59 PHA bins.
# Reduced chi-squared =          1.174 for     57 degrees of freedom
# Null hypothesis probability =   1.728904e-01

Photon flux (15-150 keV)    in 35.4 sec: 1.99975 ( -0.0912705  0.0915178 ) ph/cm2/s
Energy fluence (15-150 keV)             : 6.18997e-06 ( -2.64146e-07  2.64336e-07 ) ergs/cm2
Cutoff power-law model

Spectral model in the cutoff power-law:
------------------------------------------------------------
Parameters  : value       lower 90%   higher 90%
Photon index: 0.802878     ( -0.310213   0.289776 )
Epeak [keV] : 192.822      ( -61.2534 420.921 )
Norm@50keV  : 2.46767E-02    ( -0.00603153   0.00852955 )
------------------------------------------------------------
#Fit statistic : Chi-Squared =          62.12 using 59 PHA bins.
# Reduced chi-squared =          1.109 for     56 degrees of freedom
# Null hypothesis probability =   2.673368e-01

Photon flux (15-150 keV)    in 35.4 sec: 1.96537 ( -0.09466  0.09498 ) ph/cm2/s
Energy fluence (15-150 keV)             : 6.12615e-06 ( -2.72792e-07  2.71872e-07 ) ergs/cm2
Band function
Spectral model in the Band function:
------------------------------------------------------------
Parameters  : value       lower 90%   higher 90%
alpha       : -0.128322   ( -0.6999   4.81728 )
beta        : -1.31209    ( 1.32334   0.141591 )
Epeak [keV] : 76.0806      ( -44.2879 159.585 )
Norm@50keV   : 6.26600E-02    ( -0.0395989   253.6 )
------------------------------------------------------------
#Fit statistic : Chi-Squared =          60.96 using 59 PHA bins.
# Reduced chi-squared =          1.108 for     55 degrees of freedom
# Null hypothesis probability =   2.701352e-01

Photon flux (15-150 keV)    in 35.4 sec:  (    ) ph/cm2/s
Energy fluence (15-150 keV)             : 0 ( 0  0 ) ergs/cm2
S(25-50 keV) vs. S(50-100 keV) plot

S(25-50 keV)  = 3.89e-06
S(50-100 keV) = 5.50e-06
T90 vs. Hardness ratio plot

T90                                   = 106.487999975681 sec.
Hardness ratio (energy fluence ratio) = 1.41388
Color vs. Color plot

Count Ratio  (25-50 keV) / (15-25 keV) = 1.43237
Count Ratio (50-100 keV) / (15-25 keV) = 1.17796
Mask shadow pattern

IMX = -1.077361481201155E+00, IMY = -4.111765323249528E-01
TIME vs. PHA plot around the trigger time

Blue+Cyan dotted lines: Time interval of the scaled map
From 0.000000 to 1.024000
TIME vs. DetID plot around the trigger time

Blue+Cyan dotted lines: Time interval of the scaled map
From 0.000000 to 1.024000
100 us light curve (15-350 keV)

Blue+Cyan dotted lines: Time interval of the scaled map
From 0.000000 to 1.024000
Spacecraft aspect plot

Bright source in the pre-burst/pre-slew/post-slew images
Pre-burst image of 15-350 keV band
Time interval of the image:
-385.011410 -352.082000
-239.712000 -19.208000

# RAcent  DECcent POSerr Theta    Phi  PeakCts   SNR AngSep     Name
#  [deg]    [deg]    ['] [deg]  [deg]                   [']
 69.4509 -68.4331    2.8  39.1  132.6   1.8699   4.1 ------	UNKNOWN
 74.2462 -46.9914    2.2  30.4   97.4   1.7221   5.2 ------	UNKNOWN
 73.3815   9.6435    1.9  54.8   14.8   6.3846   6.1 ------	UNKNOWN
313.5589 -61.3271    4.4  58.3 -175.5   3.3159   2.6 ------	UNKNOWN
317.1692 -57.3009    3.5  57.4 -170.4   3.0585   3.3 ------	UNKNOWN
 46.8650   8.2331    2.4  42.7  -16.5   1.3091   4.8 ------	UNKNOWN
 44.2620  15.1972    2.4  49.2  -21.5   2.0734   4.9 ------	UNKNOWN
 42.8477  25.1050    3.6  58.9  -24.4   4.3178   3.2 ------	UNKNOWN
Pre-slew background subtracted image of 15-350 keV band
Time interval of the image:
-19.208000 16.188600

# RAcent  DECcent POSerr Theta    Phi  PeakCts   SNR AngSep     Name
#  [deg]    [deg]    ['] [deg]  [deg]                   [']
356.9636 -79.9134    0.4  49.1  159.1   8.2755  28.5 ------	UNKNOWN
 55.8340 -48.1599    2.3  19.8  113.0   0.4318   5.1 ------	UNKNOWN
 22.1404 -30.3756    1.9  13.7 -110.3   0.4189   5.9 ------	UNKNOWN
 57.2765  22.0116    1.9  58.6   -8.5   2.1693   6.0 ------	UNKNOWN
 15.8891 -25.3981    2.5  20.8 -102.2   0.3708   4.7 ------	UNKNOWN
Post-slew image of 15-350 keV band
Time interval of the image:
86.188600 823.088600

# RAcent  DECcent POSerr Theta    Phi  PeakCts   SNR AngSep     Name
#  [deg]    [deg]    ['] [deg]  [deg]                   [']
170.2401 -60.7677    5.4  39.2   79.4   3.7114   2.1    9.0	Cen X-3
186.6630 -62.6620    4.4  37.3   91.9   3.4062   2.6    6.5	GX 301-2
264.6210 -44.4360    5.7  46.8  162.7   2.2012   2.0    5.3	4U 1735-44
356.8801 -79.9100    0.8   0.0 -121.3   5.7304  14.6 ------	UNKNOWN
282.7545 -29.4182    4.7  58.3 -175.4   6.7270   2.5 ------	UNKNOWN
 55.9264 -59.1264    2.3  27.0  -19.5   1.9145   5.1 ------	UNKNOWN
  9.2582 -39.1706    2.5  41.0  -80.8   8.7317   4.6 ------	UNKNOWN
  3.6098 -39.1710    4.9  40.8  -87.5   5.2228   2.4 ------	UNKNOWN
Plot creation:
Sat May 30 13:58:23 EDT 2015