Special notes of this burst
Image
Pre-slew 15.0-50.0 keV image (Event data)
#RAcent DECcent POSerr Theta  Phi  Peak_Cts  SNR Name
134.845 2.707 0.000 9.049 48.365 1.052 7.490 TRIG_00594081

Image time interval: 0.000 to 320.000 [sec]
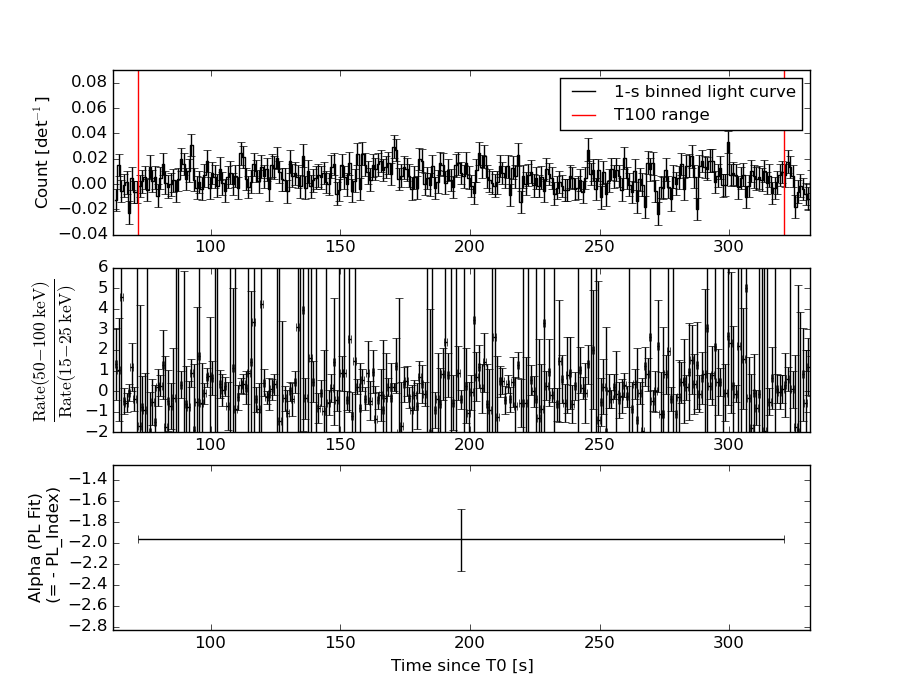
Lightcurves
Notes:
- 1) The mask-weighted light curves are using the flight position.
- 2) Multiple plots of different time binning/intervals are shown to cover all scenarios of short/long GRBs, rate/image triggers, and real/false positives.
- 3) For all the mask-weighted lightcurves, the y-axis units are counts/sec/det where a det is 0.4 x 0.4 = 0.16 sq cm.
- 4) The verticle lines correspond to following: green dotted lines are T50 interval, black dotted lines are T90 interval, blue solid line(s) is a spacecraft slew start time, and orange solid line(s) is a spacecraft slew end time.
- 5) Time of each bin is in the middle of the bin.
1 s binning
From T0-310 s to T0+310 s

From T100_start - 20 s to T100_end + 30 s
Full time interval

64 ms binning
Full time interval

From T100_start to T100_end
From T0-5 sec to T0+5 sec

16 ms binning
From T100_start-5 s to T100_start+5 s
8 ms binning
From T100_start-3 s to T100_start+3 s
2 ms binning
From T100_start-1 s to T100_start+1 s
SN=5 or 10 sec. binning (whichever binning is satisfied first)

SN=5 or 10 sec. binning (T < 200 sec)

Quad-rate summed light curves (from T0-300s to T0+1000s)

The mask-weighted light curves based on cleaned DPHs

Spectral Evolution
Spectra
Notes:
- 1) The fitting includes the systematic errors.
- 2) When the burst includes telescope slew time periods, the fitting uses an average response file made from multiple 5-s response files through out the slew time plus single time preiod for the non-slew times, and weighted by the total counts in the corresponding time period using addrmf. An average response file is needed becuase a spectral fit using the pre-slew DRM will introduce some errors in both a spectral shape and a normalization if the PHA file contains a lot of the slew/post-slew time interval.
- 3) For fits to more complicated models (e.g. a power-law over a cutoff power-law), the BAT team has decided to require a chi-square improvement of more than 6 for each extra dof.
Time averaged spectrum fit using the average DRM
Power-law model
Time interval is from   72.072 sec. to  321.168 sec.

Spectral model in power-law:
------------------------------------------------------------
Parameters  : value       lower 90%   higher 90%
Photon index: 1.96144     ( -0.280467   0.303713 )
Norm@50keV  : 3.10997E-04    ( -6.46295e-05   6.27232e-05 )
------------------------------------------------------------
#Fit statistic : Chi-Squared =          65.01 using 59 PHA bins.
# Reduced chi-squared =          1.140 for     57 degrees of freedom
# Null hypothesis probability =   2.178893e-01

Photon flux (15-150 keV)    in 249.1 sec: 4.58417E-02 ( -0.0070033  0.00700424 ) ph/cm2/s
Energy fluence (15-150 keV)             : 7.13196e-07 ( -1.3779e-07  1.44049e-07 ) ergs/cm2
Cutoff power-law model
Time interval is from   72.072 sec. to  321.168 sec.
Spectral model in the cutoff power-law:
------------------------------------------------------------
Parameters  : value       lower 90%   higher 90%
Photon index: 1.41786     ( -1.79486   0.898686 )
Epeak [keV] : 40.5986      (   )
Norm@50keV  : 6.74503E-04    (     )
------------------------------------------------------------
#Fit statistic : Chi-Squared =          64.42 using 59 PHA bins.
# Reduced chi-squared =          1.150 for     56 degrees of freedom
# Null hypothesis probability =   2.057665e-01

Photon flux (15-150 keV)    in 249.1 sec: 4.49658E-02 ( -0.0072295  0.0072498 ) ph/cm2/s
Energy fluence (15-150 keV)             : 6.59951e-07 ( -1.66616e-07  1.80886e-07 ) ergs/cm2
Band function

Time interval is from   72.072 sec. to  321.168 sec.

Spectral model in the Band function:
------------------------------------------------------------
Parameters  : value       lower 90%   higher 90%
alpha       : 4.40767   ( -12.5456   -4.40767 )
beta        : -2.33471    ( -0.59593   0.427005 )
Epeak [keV] : 25.3178      ( -5.33979 4.62494 )
Norm@50keV   : 17.9470    ( -2.7049   1149.24 )
------------------------------------------------------------
#Fit statistic : Chi-Squared =          62.09 using 59 PHA bins.
# Reduced chi-squared =          1.129 for     55 degrees of freedom
# Null hypothesis probability =   2.381836e-01

Photon flux (15-150 keV)    in 249.1 sec:  (    ) ph/cm2/s
Energy fluence (15-150 keV)             : 0 ( 0  0 ) ergs/cm2
Single BB

Spectral model blackbody:
------------------------------------------------------------
Parameters  : value    Lower 90%  Upper 90%
kT [keV]    : 8.45996  (-1.38087  1.74551)
R^2/D10^2   : 4.09364E-02  (-0.0211574   0.0410317)
(R is the radius in km and D10 is the distance to the source in units of 10 kpc)
------------------------------------------------------------
#Fit statistic : Chi-Squared =          69.98 using 59 PHA bins.
# Reduced chi-squared =          1.228 for     57 degrees of freedom
# Null hypothesis probability =   1.159868e-01

Energy  Fluence     90% Error
[keV]   [erg/cm2]   [erg/cm2]
15- 25  1.371e-07   4.080e-08
25- 50  2.639e-07   6.545e-08
50-150  8.301e-08   3.979e-08
15-150  4.840e-07   1.191e-07
Thermal bremsstrahlung (OTTB)
Spectral model: thermal bremsstrahlung
------------------------------------------------------------
Parameters  : value         Lower 90%    Upper 90%
kT [keV]    : 63.2589       (-24.5403      55.2772)
Norm        : 0.235705       (-0.0534057     0.0727263)
------------------------------------------------------------
#Fit statistic : Chi-Squared =          64.39 using 59 PHA bins.
# Reduced chi-squared =          1.130 for     57 degrees of freedom
# Null hypothesis probability =   2.338503e-01

Energy  Fluence     90% Error
[keV]   [erg/cm2]   [erg/cm2]
15- 25  1.488e-07   3.196e-08
25- 50  2.300e-07   4.556e-08
50-150  2.733e-07   1.323e-07
15-150  6.520e-07   1.719e-07
Double BB
Spectral model: bbodyrad<1> + bbodyrad<2>
------------------------------------------------------------
Parameters  : value         Lower 90%    Upper 90%
kT1 [keV]   : 6.42941        (-1.74296      1.8997)
R1^2/D10^2  : 9.59538E-02        (-0.0523349      0.161065)
kT2 [keV]   : 25.5258        (-13.9702      -28.2777)
R2^2/D10^2  : 3.54617E-04    (-0.000267662   0.00320841)
------------------------------------------------------------
#Fit statistic : Chi-Squared =          61.70 using 59 PHA bins.
# Reduced chi-squared =          1.122 for     55 degrees of freedom
# Null hypothesis probability =   2.491030e-01

Energy  Fluence     90% Error
[keV]   [erg/cm2]   [erg/cm2]
15- 25  1.539e-07   9.014e-08
25- 50  2.230e-07   1.198e-07
50-150  2.930e-07   1.973e-07
15-150  6.700e-07   3.585e-07
Peak spectrum fit
Power-law model

Time interval is from  188.524 sec. to  189.524 sec.

Spectral model in power-law:
------------------------------------------------------------
Parameters  : value       lower 90%   higher 90%
Photon index: 1.37838     ( -1.29892   0.982387 )
Norm@50keV  : 1.85625E-03    ( -0.000953493   0.000897327 )
------------------------------------------------------------
#Fit statistic : Chi-Squared =          61.57 using 59 PHA bins.
# Reduced chi-squared =          1.080 for     57 degrees of freedom
# Null hypothesis probability =   3.158105e-01

Photon flux (15-150 keV)    in 1 sec: 0.224971 ( -0.224971  0.108288 ) ph/cm2/s
Energy fluence (15-150 keV)             : 1.80176e-08 ( -9.68601e-09  1.057e-08 ) ergs/cm2
Cutoff power-law model
Time interval is from  188.524 sec. to  189.524 sec.
Spectral model in the cutoff power-law:
------------------------------------------------------------
Parameters  : value       lower 90%   higher 90%
Photon index: 2.23893     ( -1.33504   0.960065 )
Epeak [keV] : 83.9051      ( -9999.36 -9999.36 )
Norm@50keV  : 5.61405E-04    (     )
------------------------------------------------------------
#Fit statistic : Chi-Squared =          61.02 using 59 PHA bins.
# Reduced chi-squared =          1.090 for     56 degrees of freedom
# Null hypothesis probability =   3.004013e-01

Photon flux (15-150 keV)    in 1 sec: 0.225044 ( -0.107399  0.108038 ) ph/cm2/s
Energy fluence (15-150 keV)             : 1.55863e-16 ( 0  0 ) ergs/cm2
Band function
Time interval is from  188.524 sec. to  189.524 sec.

Spectral model in the Band function:
------------------------------------------------------------
Parameters  : value       lower 90%   higher 90%
alpha       : 4.89946   ( -4.89946   -4.89946 )
beta        : -2.48538    ( 2.48538   1.96499 )
Epeak [keV] : 31.8967      ( -31.8967 13.0848 )
Norm@50keV   : 48.9464    ( -22.1982   1.82858e+06 )
------------------------------------------------------------
#Fit statistic : Chi-Squared =          60.48 using 59 PHA bins.
# Reduced chi-squared =          1.100 for     55 degrees of freedom
# Null hypothesis probability =   2.844773e-01

Photon flux (15-150 keV)    in 1 sec:  (    ) ph/cm2/s
Energy fluence (15-150 keV)             : 0 ( 0  0 ) ergs/cm2
Single BB

Spectral model blackbody:
------------------------------------------------------------
Parameters  : value    Lower 90%  Upper 90%
kT [keV]    : 8.60854  (-2.82404  6.06692)
R^2/D10^2   : 0.192639  (-0.192711   0.686245)
(R is the radius in km and D10 is the distance to the source in units of 10 kpc)
------------------------------------------------------------
#Fit statistic : Chi-Squared =          61.99 using 59 PHA bins.
# Reduced chi-squared =          1.088 for     57 degrees of freedom
# Null hypothesis probability =   3.028554e-01

Energy  Fluence     90% Error
[keV]   [erg/cm2]   [erg/cm2]
15- 25  2.711e-09   1.733e-09
25- 50  5.368e-09   3.543e-09
50-150  1.784e-09   1.463e-09
15-150  9.864e-09   6.675e-09
Thermal bremsstrahlung (OTTB)
Spectral model: thermal bremsstrahlung
------------------------------------------------------------
Parameters  : value         Lower 90%    Upper 90%
kT [keV]    : 199.362       (-199.363      -199.363)
Norm        : 0.914504       (-0.439     0.439361)
------------------------------------------------------------
#Fit statistic : Chi-Squared =          61.90 using 59 PHA bins.
# Reduced chi-squared =          1.086 for     57 degrees of freedom
# Null hypothesis probability =   3.054898e-01

Energy  Fluence     90% Error
[keV]   [erg/cm2]   [erg/cm2]
15- 25  2.277e-09   1.522e-09
25- 50  4.380e-09   2.985e-09
50-150  9.607e-09   6.460e-09
15-150  1.627e-08   1.080e-08
Double BB
------------------------------------------------------------
Parameters  : value         Lower 90%    Upper 90%
kT1 [keV]   : 200.000        (-200      -200)
R1^2/D10^2  : 5.17196E-05        (-3.83234e-05      3.94855e-05)
kT2 [keV]   : 7.70898        (-2.68584      3.88252)
R2^2/D10^2  : 0.252795    (-0.177904   1.14609)
------------------------------------------------------------
#Fit statistic : Chi-Squared =          61.99 using 59 PHA bins.
#Fit statistic : Chi-Squared =          57.37 using 59 PHA bins.
# Reduced chi-squared =          1.127 for     55 degrees of freedom
# Reduced chi-squared =          1.043 for     55 degrees of freedom
# Null hypothesis probability =   2.410536e-01
# Null hypothesis probability =   3.872359e-01

Energy  Fluence     90% Error
[keV]   [erg/cm2]   [erg/cm2]
15- 25  2.712e-09   7.815e-01
25- 50  5.367e-09   7.735e+00
50-150  1.782e-09   1.732e+02
15-150  9.862e-09   1.786e+02
Pre-slew spectrum (Pre-slew PHA with pre-slew DRM)
Power-law model
Spectral model in power-law:
------------------------------------------------------------
Parameters  : value       lower 90%   higher 90%
Photon index: 1.96144     ( -0.280467   0.303713 )
Norm@50keV  : 3.10997E-04    ( -6.46295e-05   6.27232e-05 )
------------------------------------------------------------
#Fit statistic : Chi-Squared =          65.01 using 59 PHA bins.
# Reduced chi-squared =          1.140 for     57 degrees of freedom
# Null hypothesis probability =   2.178893e-01

Photon flux (15-150 keV)    in 249.1 sec: 4.58417E-02 ( -0.0070033  0.00700424 ) ph/cm2/s
Energy fluence (15-150 keV)             : 7.13196e-07 ( -1.3779e-07  1.44049e-07 ) ergs/cm2
Cutoff power-law model
Spectral model in the cutoff power-law:
------------------------------------------------------------
Parameters  : value       lower 90%   higher 90%
Photon index: 1.41786     ( -1.79486   0.898686 )
Epeak [keV] : 40.5986      (   )
Norm@50keV  : 6.74503E-04    (     )
------------------------------------------------------------
#Fit statistic : Chi-Squared =          64.42 using 59 PHA bins.
# Reduced chi-squared =          1.150 for     56 degrees of freedom
# Null hypothesis probability =   2.057665e-01

Photon flux (15-150 keV)    in 249.1 sec: 4.49658E-02 ( -0.0072295  0.0072498 ) ph/cm2/s
Energy fluence (15-150 keV)             : 6.59951e-07 ( -1.66616e-07  1.80886e-07 ) ergs/cm2
Band function
Spectral model in the Band function:
------------------------------------------------------------
Parameters  : value       lower 90%   higher 90%
alpha       : 4.40767   ( -13.0215   -4.40767 )
beta        : -2.33471    ( -0.59593   0.427005 )
Epeak [keV] : 25.3178      ( -5.33979 4.62494 )
Norm@50keV   : 17.9470    ( -2.7049   1149.24 )
------------------------------------------------------------
#Fit statistic : Chi-Squared =          62.09 using 59 PHA bins.
# Reduced chi-squared =          1.129 for     55 degrees of freedom
# Null hypothesis probability =   2.381836e-01

Photon flux (15-150 keV)    in 249.1 sec:  (    ) ph/cm2/s
Energy fluence (15-150 keV)             : 0 ( 0  0 ) ergs/cm2
S(25-50 keV) vs. S(50-100 keV) plot

S(25-50 keV)  = 2.12e-07
S(50-100 keV) = 2.18e-07
T90 vs. Hardness ratio plot
T90                                   = 209.655999958515 sec.
Hardness ratio (energy fluence ratio) = 1.0283
Color vs. Color plot

Count Ratio  (25-50 keV) / (15-25 keV) = 1.03136
Count Ratio (50-100 keV) / (15-25 keV) = 0.549526
Mask shadow pattern
IMX = 0.105812201967, IMY = -0.119034623563
TIME vs. PHA plot around the trigger time

TIME vs. DetID plot around the trigger time
100 us light curve (15-350 keV)

Spacecraft aspect plot
Bright source in the pre-burst/pre-slew/post-slew images
Pre-burst image of 15-350 keV band
Time interval of the image:
-10.899410 72.072000

# RAcent  DECcent POSerr Theta    Phi  PeakCts   SNR AngSep     Name
#  [deg]    [deg]    ['] [deg]  [deg]                   [']
135.6812 -40.5209    7.6  37.0  178.2   0.1896   1.5    7.2	Vela X-1
 86.9262  18.0486    3.0  46.9  -53.6   1.6012   3.9 ------	UNKNOWN
Pre-slew background subtracted image of 15-350 keV band
Time interval of the image:
72.072000 321.168000

# RAcent  DECcent POSerr Theta    Phi  PeakCts   SNR AngSep     Name
#  [deg]    [deg]    ['] [deg]  [deg]                   [']
135.7068 -40.6832   69.5  37.1  178.3   0.0667   0.2   11.2	Vela X-1
144.9291  -5.8283    2.2  16.1  103.8   1.5385   5.2 ------	UNKNOWN
134.8907   2.7534    2.0   9.1   48.4   1.6352   5.7 ------	UNKNOWN
102.0040  29.0213    2.2  42.0  -29.3   2.4399   5.2 ------	UNKNOWN
106.1504 -29.8722    2.4  33.6 -135.8   1.8173   4.9 ------	UNKNOWN
Post-slew image of 15-350 keV band
Time interval of the image:
372.900600 963.053700

# RAcent  DECcent POSerr Theta    Phi  PeakCts   SNR AngSep     Name
#  [deg]    [deg]    ['] [deg]  [deg]                   [']
135.4608 -40.5547    4.7  43.3  172.6   1.4395   2.4    3.1	Vela X-1
131.2307 -32.2488    2.9  35.1  178.6   1.7469   4.0 ------	UNKNOWN
118.6346   5.5043    2.1  16.4  -86.4   1.7534   5.3 ------	UNKNOWN
107.7163 -10.1459    2.7  29.9 -122.6   1.7677   4.3 ------	UNKNOWN
 94.5323  12.4708    2.2  41.1  -80.8   8.0827   5.3 ------	UNKNOWN
Plot creation:
Thu Oct  8 20:09:10 EDT 2015