Special notes of this burst
Image
Pre-slew 15.0-350.0 keV image (Event data)

#   RAcent    DECcent   POSerr    Theta     Phi              Peak Cts       SNR   Name
  144.9980   -65.8270   0.0129    16.2015    86.8548         1.3689639     14.817 TRIG_00595608

Foreground time interval of the image:
-31.632  16.368 (delta_t =  48.000 [sec])
Background time interval of the image:
-239.632 -31.632 (delta_t = 208.000 [sec])
Lightcurves
Notes:
- 1) The mask-weighted light curves are using the flight position.
- 2) Multiple plots of different time binning/intervals are shown to cover all scenarios of short/long GRBs, rate/image triggers, and real/false positives.
- 3) For all the mask-weighted lightcurves, the y-axis units are counts/sec/det where a det is 0.4 x 0.4 = 0.16 sq cm.
- 4) The verticle lines correspond to following: green dotted lines are T50 interval, black dotted lines are T90 interval, blue solid line(s) is a spacecraft slew start time, and orange solid line(s) is a spacecraft slew end time.
- 5) Time of each bin is in the middle of the bin.
1 s binning
From T0-310 s to T0+310 s
From T100_start - 20 s to T100_end + 30 s
Full time interval

64 ms binning
Full time interval

From T100_start to T100_end
From T0-5 sec to T0+5 sec
16 ms binning
From T100_start-5 s to T100_start+5 s

Blue+Cyan dotted lines: Time interval of the scaled map
From 0.000000 to 1.024000
8 ms binning
From T100_start-3 s to T100_start+3 s

Blue+Cyan dotted lines: Time interval of the scaled map
From 0.000000 to 1.024000
2 ms binning
From T100_start-1 s to T100_start+1 s

Blue+Cyan dotted lines: Time interval of the scaled map
From 0.000000 to 1.024000
SN=5 or 10 sec. binning (whichever binning is satisfied first)

SN=5 or 10 sec. binning (T < 200 sec)

Quad-rate summed light curves (from T0-300s to T0+1000s)
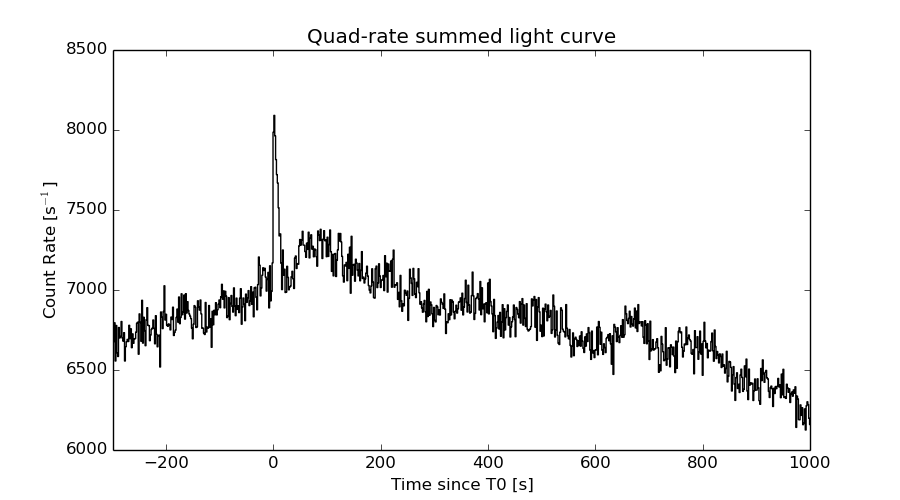
The mask-weighted light curves based on cleaned DPHs

Spectral Evolution

Spectra
Notes:
- 1) The fitting includes the systematic errors.
- 2) When the burst includes telescope slew time periods, the fitting uses an average response file made from multiple 5-s response files through out the slew time plus single time preiod for the non-slew times, and weighted by the total counts in the corresponding time period using addrmf. An average response file is needed becuase a spectral fit using the pre-slew DRM will introduce some errors in both a spectral shape and a normalization if the PHA file contains a lot of the slew/post-slew time interval.
- 3) For fits to more complicated models (e.g. a power-law over a cutoff power-law), the BAT team has decided to require a chi-square improvement of more than 6 for each extra dof.
Time averaged spectrum fit using the average DRM
Power-law model

Time interval is from  -31.632 sec. to   16.368 sec.

Spectral model in power-law:
------------------------------------------------------------
Parameters  : value       lower 90%   higher 90%
Photon index: 2.02873     ( -0.183636   0.192586 )
Norm@50keV  : 1.59922E-03    ( -0.000198339   0.000193558 )
------------------------------------------------------------
#Fit statistic : Chi-Squared =          36.25 using 59 PHA bins.
# Reduced chi-squared =         0.6359 for     57 degrees of freedom
# Null hypothesis probability =   9.854623e-01

Photon flux (15-150 keV)    in 48 sec: 0.243108 ( -0.0223996  0.0224053 ) ph/cm2/s
Energy fluence (15-150 keV)             : 7.09094e-07 ( -8.0375e-08  8.22504e-08 ) ergs/cm2
Cutoff power-law model
Time interval is from  -31.632 sec. to   16.368 sec.
Spectral model in the cutoff power-law:
------------------------------------------------------------
Parameters  : value       lower 90%   higher 90%
Photon index: 1.99884     (     )
Epeak [keV] : 5.18608      (   )
Norm@50keV  : 1.63517E-03    (     )
------------------------------------------------------------
#Fit statistic : Chi-Squared =          36.31 using 59 PHA bins.
# Reduced chi-squared =         0.6484 for     56 degrees of freedom
# Null hypothesis probability =   9.809344e-01

Photon flux (15-150 keV)    in 48 sec: 0.243105 ( -0.022513  0.022335 ) ph/cm2/s
Energy fluence (15-150 keV)             : 7.07371e-07 ( -8.80368e-08  8.24544e-08 ) ergs/cm2
Band function

Time interval is from  -31.632 sec. to   16.368 sec.

Spectral model in the Band function:
------------------------------------------------------------
Parameters  : value       lower 90%   higher 90%
alpha       : -1.39206   ( 1.39289   1.39289 )
beta        : -2.12948    ( 2.13061   0.272991 )
Epeak [keV] : 29.3464      ( -29.4121 33.1641 )
Norm@50keV   : 4.30533E-03    ( -0.00431348   1105.55 )
------------------------------------------------------------
#Fit statistic : Chi-Squared =          35.88 using 59 PHA bins.
# Reduced chi-squared =         0.6524 for     55 degrees of freedom
# Null hypothesis probability =   9.785846e-01

Photon flux (15-150 keV)    in 48 sec:  (    ) ph/cm2/s
Energy fluence (15-150 keV)             : 0 ( 0  0 ) ergs/cm2
Single BB

Spectral model blackbody:
------------------------------------------------------------
Parameters  : value    Lower 90%  Upper 90%
kT [keV]    : 8.86777  (-0.932803  1.06144)
R^2/D10^2   : 0.173857  (-0.062297   0.0957885)
(R is the radius in km and D10 is the distance to the source in units of 10 kpc)
------------------------------------------------------------
#Fit statistic : Chi-Squared =          61.89 using 59 PHA bins.
# Reduced chi-squared =          1.086 for     57 degrees of freedom
# Null hypothesis probability =   3.059746e-01

Energy  Fluence     90% Error
[keV]   [erg/cm2]   [erg/cm2]
15- 25  1.268e-07   1.939e-08
25- 50  2.632e-07   3.394e-08
50-150  9.595e-08   2.602e-08
15-150  4.860e-07   5.791e-08
Thermal bremsstrahlung (OTTB)

Spectral model: thermal bremsstrahlung
------------------------------------------------------------
Parameters  : value         Lower 90%    Upper 90%
kT [keV]    : 61.2434       (-16.516      26.9365)
Norm        : 1.24760       (-0.197907     0.236576)
------------------------------------------------------------
#Fit statistic : Chi-Squared =          39.58 using 59 PHA bins.
# Reduced chi-squared =         0.6944 for     57 degrees of freedom
# Null hypothesis probability =   9.617542e-01

Energy  Fluence     90% Error
[keV]   [erg/cm2]   [erg/cm2]
15- 25  1.510e-07   2.016e-08
25- 50  2.312e-07   2.362e-08
50-150  2.676e-07   6.427e-08
15-150  6.499e-07   8.880e-08
Double BB
Spectral model: bbodyrad<1> + bbodyrad<2>
------------------------------------------------------------
Parameters  : value         Lower 90%    Upper 90%
kT1 [keV]   : 7.37503        (-1.20046      1.11052)
R1^2/D10^2  : 0.324696        (-0.0795166      0.150664)
kT2 [keV]   : 72.1857        (-45.9192      -73.2094)
R2^2/D10^2  : 1.29818E-04    (-0.000108042   0.00152563)
------------------------------------------------------------
#Fit statistic : Chi-Squared =          33.90 using 59 PHA bins.
# Reduced chi-squared =         0.6163 for     55 degrees of freedom
# Null hypothesis probability =   9.887892e-01

Energy  Fluence     90% Error
[keV]   [erg/cm2]   [erg/cm2]
15- 25  1.459e-07   3.029e-08
25- 50  2.370e-07   4.812e-08
50-150  3.770e-07   1.999e-07
15-150  7.600e-07   2.419e-07
Peak spectrum fit
Power-law model
Time interval is from    7.868 sec. to    8.868 sec.

Spectral model in power-law:
------------------------------------------------------------
Parameters  : value       lower 90%   higher 90%
Photon index: 2.12821     ( -0.436474   0.509962 )
Norm@50keV  : 3.85864E-03    ( -0.00134956   0.00130482 )
------------------------------------------------------------
#Fit statistic : Chi-Squared =          47.97 using 59 PHA bins.
# Reduced chi-squared =         0.8416 for     57 degrees of freedom
# Null hypothesis probability =   7.972031e-01

Photon flux (15-150 keV)    in 1 sec: 0.615654 ( -0.149379  0.149444 ) ph/cm2/s
Energy fluence (15-150 keV)             : 3.59556e-08 ( -1.07715e-08  1.15255e-08 ) ergs/cm2
Cutoff power-law model

Time interval is from    7.868 sec. to    8.868 sec.
Spectral model in the cutoff power-law:
------------------------------------------------------------
Parameters  : value       lower 90%   higher 90%
Photon index: 0.432136     ( -4.2298   1.66972 )
Epeak [keV] : 33.6255      ( -33.6259 -33.6259 )
Norm@50keV  : 4.46847E-02    ( -0.044732   22.432 )
------------------------------------------------------------
#Fit statistic : Chi-Squared =          46.65 using 59 PHA bins.
# Reduced chi-squared =         0.8331 for     56 degrees of freedom
# Null hypothesis probability =   8.089062e-01

Photon flux (15-150 keV)    in 1 sec: 0.590946 ( -0.14992  0.15225 ) ph/cm2/s
Energy fluence (15-150 keV)             : 3.06608e-08 ( -9.3177e-09  1.35527e-08 ) ergs/cm2
Band function
Time interval is from    7.868 sec. to    8.868 sec.

Spectral model in the Band function:
------------------------------------------------------------
Parameters  : value       lower 90%   higher 90%
alpha       : 8.18682E-02   ( -0.298218   -0.298218 )
beta        : -3.28975    ( 3.34299   1.51934 )
Epeak [keV] : 32.9897      ( -33.0149 14.0852 )
Norm@50keV   : 9.85293E-02    ( -0.0950553   559.03 )
------------------------------------------------------------
#Fit statistic : Chi-Squared =          46.53 using 59 PHA bins.
# Reduced chi-squared =         0.8461 for     55 degrees of freedom
# Null hypothesis probability =   7.847203e-01

Photon flux (15-150 keV)    in 1 sec:  (    ) ph/cm2/s
Energy fluence (15-150 keV)             : 0 ( 0  0 ) ergs/cm2
Single BB

Spectral model blackbody:
------------------------------------------------------------
Parameters  : value    Lower 90%  Upper 90%
kT [keV]    : 8.72394  (-1.89403  2.4508)
R^2/D10^2   : 0.504584  (-0.315752   0.811748)
(R is the radius in km and D10 is the distance to the source in units of 10 kpc)
------------------------------------------------------------
#Fit statistic : Chi-Squared =          47.46 using 59 PHA bins.
# Reduced chi-squared =         0.8326 for     57 degrees of freedom
# Null hypothesis probability =   8.121532e-01

Energy  Fluence     90% Error
[keV]   [erg/cm2]   [erg/cm2]
15- 25  7.351e-09   3.955e-09
25- 50  1.487e-08   7.127e-09
50-150  5.153e-09   3.676e-09
15-150  2.737e-08   1.252e-08
Thermal bremsstrahlung (OTTB)

Spectral model: thermal bremsstrahlung
------------------------------------------------------------
Parameters  : value         Lower 90%    Upper 90%
kT [keV]    : 48.1398       (-22.0031      62.3938)
Norm        : 3.61294       (-1.24904     2.06182)
------------------------------------------------------------
#Fit statistic : Chi-Squared =          46.93 using 59 PHA bins.
# Reduced chi-squared =         0.8234 for     57 degrees of freedom
# Null hypothesis probability =   8.267753e-01

Energy  Fluence     90% Error
[keV]   [erg/cm2]   [erg/cm2]
15- 25  8.755e-09   3.135e-09
25- 50  1.240e-08   4.948e-09
50-150  1.161e-08   8.285e-09
15-150  3.277e-08   1.260e-08
Double BB
------------------------------------------------------------
Parameters  : value         Lower 90%    Upper 90%
kT1 [keV]   : 1.23478        (-1.63679      8.86188)
R1^2/D10^2  : 1.74596E+04        (      )
kT2 [keV]   : 9.29226        (-2.16796      -9.28486)
R2^2/D10^2  : 0.377944    (-0.38074   0.709405)
------------------------------------------------------------
#Fit statistic : Chi-Squared =          46.30 using 59 PHA bins.
#Fit statistic : Chi-Squared =          46.27 using 59 PHA bins.
# Reduced chi-squared =         0.8418 for     55 degrees of freedom
# Reduced chi-squared =         0.8413 for     55 degrees of freedom
# Null hypothesis probability =   7.919620e-01
# Null hypothesis probability =   7.929185e-01

Energy  Fluence     90% Error
[keV]   [erg/cm2]   [erg/cm2]
15- 25  7.608e-09   3.954e-09
25- 50  1.424e-08   8.505e-09
50-150  6.274e-09   4.234e-09
15-150  2.813e-08   1.620e-08
Pre-slew spectrum (Pre-slew PHA with pre-slew DRM)
Power-law model

Spectral model in power-law:
------------------------------------------------------------
Parameters  : value       lower 90%   higher 90%
Photon index: 2.02873     ( -0.183636   0.192586 )
Norm@50keV  : 1.59922E-03    ( -0.000198339   0.000193558 )
------------------------------------------------------------
#Fit statistic : Chi-Squared =          36.25 using 59 PHA bins.
# Reduced chi-squared =         0.6359 for     57 degrees of freedom
# Null hypothesis probability =   9.854623e-01

Photon flux (15-150 keV)    in 48 sec: 0.243108 ( -0.0223996  0.0224053 ) ph/cm2/s
Energy fluence (15-150 keV)             : 7.09094e-07 ( -8.0375e-08  8.22504e-08 ) ergs/cm2
Cutoff power-law model
Spectral model in the cutoff power-law:
------------------------------------------------------------
Parameters  : value       lower 90%   higher 90%
Photon index: 1.99884     (     )
Epeak [keV] : 5.18608      (   )
Norm@50keV  : 1.63517E-03    (     )
------------------------------------------------------------
#Fit statistic : Chi-Squared =          36.31 using 59 PHA bins.
# Reduced chi-squared =         0.6484 for     56 degrees of freedom
# Null hypothesis probability =   9.809344e-01

Photon flux (15-150 keV)    in 48 sec: 0.243105 ( -0.022513  0.022335 ) ph/cm2/s
Energy fluence (15-150 keV)             : 7.07371e-07 ( -8.80368e-08  8.24544e-08 ) ergs/cm2
Band function

Spectral model in the Band function:
------------------------------------------------------------
Parameters  : value       lower 90%   higher 90%
alpha       : -1.39206   ( 1.39289   1.39289 )
beta        : -2.12948    ( 2.13061   0.272991 )
Epeak [keV] : 29.3464      ( -29.4121 33.1641 )
Norm@50keV   : 4.30533E-03    ( -0.00431348   1105.55 )
------------------------------------------------------------
#Fit statistic : Chi-Squared =          35.88 using 59 PHA bins.
# Reduced chi-squared =         0.6524 for     55 degrees of freedom
# Null hypothesis probability =   9.785846e-01

Photon flux (15-150 keV)    in 48 sec:  (    ) ph/cm2/s
Energy fluence (15-150 keV)             : 0 ( 0  0 ) ergs/cm2
S(25-50 keV) vs. S(50-100 keV) plot
S(25-50 keV)  = 2.15e-07
S(50-100 keV) = 2.11e-07
T90 vs. Hardness ratio plot

T90                                   = 48 sec.
Hardness ratio (energy fluence ratio) = 0.981395
Color vs. Color plot
Count Ratio  (25-50 keV) / (15-25 keV) = 1.0335
Count Ratio (50-100 keV) / (15-25 keV) = 0.403458
Mask shadow pattern

IMX = 1.594155435631204E-02, IMY = -2.901177717198384E-01
TIME vs. PHA plot around the trigger time

Blue+Cyan dotted lines: Time interval of the scaled map
From 0.000000 to 1.024000
TIME vs. DetID plot around the trigger time
Blue+Cyan dotted lines: Time interval of the scaled map
From 0.000000 to 1.024000
100 us light curve (15-350 keV)

Blue+Cyan dotted lines: Time interval of the scaled map
From 0.000000 to 1.024000
Spacecraft aspect plot
Bright source in the pre-burst/pre-slew/post-slew images
Pre-burst image of 15-350 keV band
Time interval of the image:
-239.632000 -31.632000

# RAcent  DECcent POSerr Theta    Phi  PeakCts   SNR AngSep     Name
#  [deg]    [deg]    ['] [deg]  [deg]                   [']
135.5219 -40.5362    1.3  34.0   38.7   2.5973   8.8    1.1	Vela X-1
170.1627 -60.5802    3.5  28.1   96.0   0.9224   3.3    5.2	Cen X-3
186.5854 -62.7191    2.6  31.7  110.5   1.5031   4.4    3.6	GX 301-2
105.5157 -34.9459    2.4  35.0   -4.8   1.1201   4.8 ------	UNKNOWN
Pre-slew background subtracted image of 15-350 keV band
Time interval of the image:
-31.632000 16.368000

# RAcent  DECcent POSerr Theta    Phi  PeakCts   SNR AngSep     Name
#  [deg]    [deg]    ['] [deg]  [deg]                   [']
135.4719 -40.5221    9.5  34.0   38.6   0.1557   1.2    3.2	Vela X-1
170.6468 -60.5964    6.6  28.3   96.4   0.2216   1.7    9.9	Cen X-3
186.4859 -62.5774    0.0  31.8  110.3   0.2103   1.6   12.5	GX 301-2
123.1404 -23.7744    2.9  47.8   16.7   0.8250   4.0 ------	UNKNOWN
144.9974 -65.8257    0.8  16.2   86.9   1.3748  14.9 ------	UNKNOWN
104.2638 -13.6826    2.2  56.3   -7.0   1.6499   5.2 ------	UNKNOWN
 78.9190 -27.9706    2.2  44.1  -39.6   0.8276   5.3 ------	UNKNOWN
Post-slew image of 15-350 keV band
Time interval of the image:
55.268590 962.438000

# RAcent  DECcent POSerr Theta    Phi  PeakCts   SNR AngSep     Name
#  [deg]    [deg]    ['] [deg]  [deg]                   [']
135.5287 -40.5436    0.6  25.8   11.6  11.4972  20.2    0.7	Vela X-1
170.3329 -60.6772    2.0  12.4  105.7   3.1724   5.8    3.3	Cen X-3
186.6532 -62.7756    0.8  18.0  128.0   8.8767  14.1    0.3	GX 301-2
168.5307 -44.0429    2.3  25.3   70.5   3.7134   5.0 ------	UNKNOWN
120.3506 -73.2452    2.3  11.2 -113.6   2.7219   4.9 ------	UNKNOWN
Plot creation:
Sat May 30 13:53:25 EDT 2015