Click here for the BAT GCN circular template
Image
Pre-slew 15.0-350.0 keV image (Event data)

#   RAcent    DECcent   POSerr    Theta     Phi              Peak Cts       SNR   Name
  197.2755    49.8380   0.0055    29.0584   105.7265        15.2761995     34.670 TRIG_00596901

Foreground time interval of the image:
-130.128 108.912 (delta_t = 239.040 [sec])
Background time interval of the image:
-239.184 -130.128 (delta_t = 109.056 [sec])
Lightcurves
Notes:
- 1) The mask-weighted light curves are using the flight position.
- 2) Multiple plots of different time binning/intervals are shown to cover all scenarios of short/long GRBs, rate/image triggers, and real/false positives.
- 3) For all the mask-weighted lightcurves, the y-axis units are counts/sec/det where a det is 0.4 x 0.4 = 0.16 sq cm.
- 4) The verticle lines correspond to following: green dotted lines are T50 interval, black dotted lines are T90 interval, blue solid line(s) is a spacecraft slew start time, and orange solid line(s) is a spacecraft slew end time.
- 5) Time of each bin is in the middle of the bin.
1 s binning
From T0-310 s to T0+310 s

From T100_start - 20 s to T100_end + 30 s

Full time interval

64 ms binning
Full time interval

From T100_start to T100_end

From T0-5 sec to T0+5 sec
16 ms binning
From T100_start-5 s to T100_start+5 s

Blue+Cyan dotted lines: Time interval of the scaled map
From 0.000000 to 4.096000
8 ms binning
From T100_start-3 s to T100_start+3 s
Blue+Cyan dotted lines: Time interval of the scaled map
From 0.000000 to 4.096000
2 ms binning
From T100_start-1 s to T100_start+1 s
Blue+Cyan dotted lines: Time interval of the scaled map
From 0.000000 to 4.096000
SN=5 or 10 sec. binning (whichever binning is satisfied first)

SN=5 or 10 sec. binning (T < 200 sec)

Quad-rate summed light curves (from T0-300s to T0+1000s)
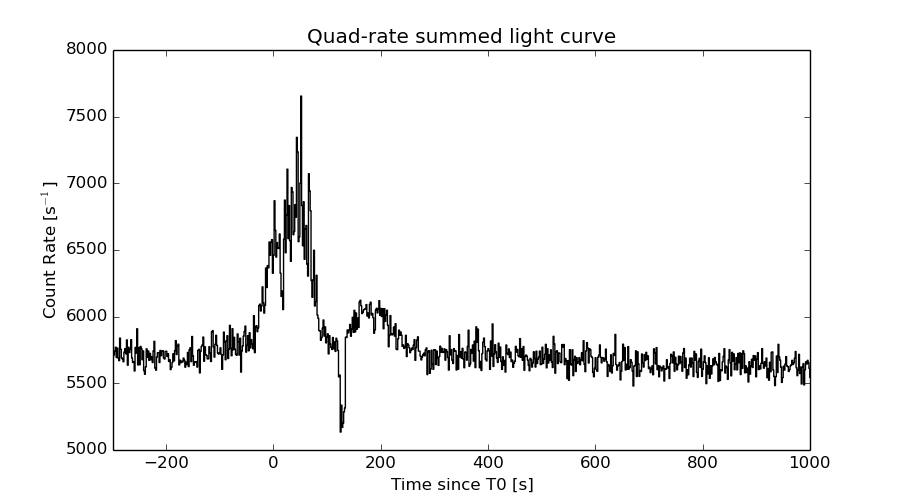
The mask-weighted light curves based on cleaned DPHs

Spectral Evolution

Spectra
Notes:
- 1) The fitting includes the systematic errors.
- 2) When the burst includes telescope slew time periods, the fitting uses an average response file made from multiple 5-s response files through out the slew time plus single time preiod for the non-slew times, and weighted by the total counts in the corresponding time period using addrmf. An average response file is needed becuase a spectral fit using the pre-slew DRM will introduce some errors in both a spectral shape and a normalization if the PHA file contains a lot of the slew/post-slew time interval.
- 3) For fits to more complicated models (e.g. a power-law over a cutoff power-law), the BAT team has decided to require a chi-square improvement of more than 6 for each extra dof.
Time averaged spectrum fit using the average DRM
Power-law model
Time interval is from -130.128 sec. to  108.912 sec.

Spectral model in power-law:
------------------------------------------------------------
Parameters  : value       lower 90%   higher 90%
Photon index: 1.33513     ( -0.0565238   0.0563251 )
Norm@50keV  : 4.00113E-03    ( -0.000121131   0.000121108 )
------------------------------------------------------------
#Fit statistic : Chi-Squared =          47.91 using 59 PHA bins.
# Reduced chi-squared =         0.8406 for     57 degrees of freedom
# Null hypothesis probability =   7.988438e-01

Photon flux (15-150 keV)    in 239 sec: 0.480573 ( -0.0157931  0.0158307 ) ph/cm2/s
Energy fluence (15-150 keV)             : 9.37129e-06 ( -3.01742e-07  3.02254e-07 ) ergs/cm2
Cutoff power-law model
Time interval is from -130.128 sec. to  108.912 sec.
Spectral model in the cutoff power-law:
------------------------------------------------------------
Parameters  : value       lower 90%   higher 90%
Photon index: 1.16322     ( -0.227853   0.192918 )
Epeak [keV] : 271.029      (   )
Norm@50keV  : 4.79027E-03    (     )
------------------------------------------------------------
#Fit statistic : Chi-Squared =          46.09 using 59 PHA bins.
# Reduced chi-squared =         0.8231 for     56 degrees of freedom
# Null hypothesis probability =   8.247693e-01

Photon flux (15-150 keV)    in 239 sec: 0.475257 ( -0.017046  0.017082 ) ph/cm2/s
Energy fluence (15-150 keV)             : 9.27573e-06 ( -3.29055e-07  3.27406e-07 ) ergs/cm2
Band function

Time interval is from -130.128 sec. to  108.912 sec.

Spectral model in the Band function:
------------------------------------------------------------
Parameters  : value       lower 90%   higher 90%
alpha       : 0.538455   ( -2.63701   -0.971278 )
beta        : -1.38093    ( 1.3774   0.0720924 )
Epeak [keV] : 38.4787      ( -17.2603 68.9579 )
Norm@50keV   : 7.82767E-02    ( -0.0779836   135.108 )
------------------------------------------------------------
#Fit statistic : Chi-Squared =          44.17 using 59 PHA bins.
# Reduced chi-squared =         0.8031 for     55 degrees of freedom
# Null hypothesis probability =   8.519720e-01

Photon flux (15-150 keV)    in 239 sec:  (    ) ph/cm2/s
Energy fluence (15-150 keV)             : 0 ( 0  0 ) ergs/cm2
Single BB
Spectral model blackbody:
------------------------------------------------------------
Parameters  : value    Lower 90%  Upper 90%
kT [keV]    : 18.3665  (  )
R^2/D10^2   : 2.75830E-02  (   )
(R is the radius in km and D10 is the distance to the source in units of 10 kpc)
------------------------------------------------------------
#Fit statistic : Chi-Squared =         253.13 using 59 PHA bins.
# Reduced chi-squared =         4.4409 for     57 degrees of freedom
# Null hypothesis probability =   1.561813e-26

Energy  Fluence     90% Error
[keV]   [erg/cm2]   [erg/cm2]
15- 25  4.423e-07   2.713e-08
25- 50  2.076e-06   9.596e-08
50-150  5.110e-06   2.521e-07
15-150  7.628e-06   2.784e-07
Thermal bremsstrahlung (OTTB)
Spectral model: thermal bremsstrahlung
------------------------------------------------------------
Parameters  : value         Lower 90%    Upper 90%
kT [keV]    : 200.000       (      )
Norm        : 2.02324       (-0.0616795     0.0616502)
------------------------------------------------------------
#Fit statistic : Chi-Squared =          95.99 using 59 PHA bins.
# Reduced chi-squared =          1.684 for     57 degrees of freedom
# Null hypothesis probability =   9.471389e-04

Energy  Fluence     90% Error
[keV]   [erg/cm2]   [erg/cm2]
15- 25  1.204e-06   3.860e-08
25- 50  2.317e-06   7.349e-08
50-150  5.082e-06   1.637e-07
15-150  8.603e-06   2.605e-07
Double BB

Spectral model: bbodyrad<1> + bbodyrad<2>
------------------------------------------------------------
Parameters  : value         Lower 90%    Upper 90%
kT1 [keV]   : 8.06154        (-1.01494      1.14347)
R1^2/D10^2  : 0.274679        (-0.0917722      0.152828)
kT2 [keV]   : 31.3675        (-3.76473      5.66625)
R2^2/D10^2  : 3.75944E-03    (-0.00158621   0.00209742)
------------------------------------------------------------
#Fit statistic : Chi-Squared =          51.10 using 59 PHA bins.
# Reduced chi-squared =         0.9290 for     55 degrees of freedom
# Null hypothesis probability =   6.245724e-01

Energy  Fluence     90% Error
[keV]   [erg/cm2]   [erg/cm2]
15- 25  9.104e-07   1.114e-07
25- 50  2.221e-06   1.654e-07
50-150  6.132e-06   5.760e-07
15-150  9.263e-06   7.481e-07
Peak spectrum fit
Power-law model

Time interval is from   44.188 sec. to   45.188 sec.

Spectral model in power-law:
------------------------------------------------------------
Parameters  : value       lower 90%   higher 90%
Photon index: 1.19415     ( -0.189737   0.186939 )
Norm@50keV  : 1.83307E-02    ( -0.00205655   0.00205563 )
------------------------------------------------------------
#Fit statistic : Chi-Squared =          70.77 using 59 PHA bins.
# Reduced chi-squared =          1.242 for     57 degrees of freedom
# Null hypothesis probability =   1.038299e-01

Photon flux (15-150 keV)    in 1 sec: 2.14989 ( -0.24505  0.24526 ) ph/cm2/s
Energy fluence (15-150 keV)             : 1.86281e-07 ( -2.33939e-08  2.35765e-08 ) ergs/cm2
Cutoff power-law model

Time interval is from   44.188 sec. to   45.188 sec.
Spectral model in the cutoff power-law:
------------------------------------------------------------
Parameters  : value       lower 90%   higher 90%
Photon index: 0.980418     ( -0.879528   0.381062 )
Epeak [keV] : 244.833      ( -245.16 -245.16 )
Norm@50keV  : 2.34978E-02    ( -0.00928074   0.0408045 )
------------------------------------------------------------
#Fit statistic : Chi-Squared =          70.54 using 59 PHA bins.
# Reduced chi-squared =          1.260 for     56 degrees of freedom
# Null hypothesis probability =   9.142196e-02

Photon flux (15-150 keV)    in 1 sec: 2.13777 ( -0.24922  0.24875 ) ph/cm2/s
Energy fluence (15-150 keV)             : 1.83637e-07 ( -2.6244e-08  2.5247e-08 ) ergs/cm2
Band function
Time interval is from   44.188 sec. to   45.188 sec.

Spectral model in the Band function:
------------------------------------------------------------
Parameters  : value       lower 90%   higher 90%
alpha       : 4.99727   ( -14.9695   -4.99727 )
beta        : -1.33952    ( -0.273992   0.22761 )
Epeak [keV] : 29.2537      ( -9.3612 15.4321 )
Norm@50keV   : 607.342    ( -67.6291   16936.5 )
------------------------------------------------------------
#Fit statistic : Chi-Squared =          68.05 using 59 PHA bins.
# Reduced chi-squared =          1.237 for     55 degrees of freedom
# Null hypothesis probability =   1.112991e-01

Photon flux (15-150 keV)    in 1 sec:  (    ) ph/cm2/s
Energy fluence (15-150 keV)             : 0 ( 0  0 ) ergs/cm2
Single BB

Spectral model blackbody:
------------------------------------------------------------
Parameters  : value    Lower 90%  Upper 90%
kT [keV]    : 16.5140  (-2.19956  2.75452)
R^2/D10^2   : 0.188847  (-0.0767221   0.117615)
(R is the radius in km and D10 is the distance to the source in units of 10 kpc)
------------------------------------------------------------
#Fit statistic : Chi-Squared =          84.21 using 59 PHA bins.
# Reduced chi-squared =          1.477 for     57 degrees of freedom
# Null hypothesis probability =   1.105324e-02

Energy  Fluence     90% Error
[keV]   [erg/cm2]   [erg/cm2]
15- 25  1.057e-08   2.676e-09
25- 50  4.567e-08   7.010e-09
50-150  8.807e-08   1.932e-08
15-150  1.443e-07   2.410e-08
Thermal bremsstrahlung (OTTB)
Spectral model: thermal bremsstrahlung
------------------------------------------------------------
Parameters  : value         Lower 90%    Upper 90%
kT [keV]    : 200.000       (      )
Norm        : 8.79761       (-1.00679     1.00676)
------------------------------------------------------------
#Fit statistic : Chi-Squared =          79.58 using 59 PHA bins.
# Reduced chi-squared =          1.396 for     57 degrees of freedom
# Null hypothesis probability =   2.576581e-02

Energy  Fluence     90% Error
[keV]   [erg/cm2]   [erg/cm2]
15- 25  2.190e-08   1.191e-08
25- 50  4.213e-08   2.337e-08
50-150  9.241e-08   5.130e-08
15-150  1.564e-07   8.610e-08
Double BB

------------------------------------------------------------
Parameters  : value         Lower 90%    Upper 90%
kT1 [keV]   : 11.9859        (-2.0947      2.6595)
R1^2/D10^2  : 0.454702        (-0.234068      0.400118)
kT2 [keV]   : 200.000        (      )
R2^2/D10^2  : 3.15609E-04    (-0.000108797   8.96615e-05)
------------------------------------------------------------
#Fit statistic : Chi-Squared =          65.20 using 59 PHA bins.
#Fit statistic : Chi-Squared =          64.89 using 59 PHA bins.
# Reduced chi-squared =          1.185 for     55 degrees of freedom
# Reduced chi-squared =          1.180 for     55 degrees of freedom
# Null hypothesis probability =   1.633396e-01
# Null hypothesis probability =   1.699972e-01

Energy  Fluence     90% Error
[keV]   [erg/cm2]   [erg/cm2]
15- 25  1.451e-08   4.914e-09
25- 50  4.653e-08   1.798e-08
50-150  1.237e-07   9.434e-08
15-150  1.848e-07   1.189e-07
Pre-slew spectrum (Pre-slew PHA with pre-slew DRM)
Power-law model

Spectral model in power-law:
------------------------------------------------------------
Parameters  : value       lower 90%   higher 90%
Photon index: 1.33513     ( -0.0565238   0.0563251 )
Norm@50keV  : 4.00113E-03    ( -0.000121131   0.000121108 )
------------------------------------------------------------
#Fit statistic : Chi-Squared =          47.91 using 59 PHA bins.
# Reduced chi-squared =         0.8406 for     57 degrees of freedom
# Null hypothesis probability =   7.988438e-01

Photon flux (15-150 keV)    in 239 sec: 0.480573 ( -0.0157931  0.0158307 ) ph/cm2/s
Energy fluence (15-150 keV)             : 9.37129e-06 ( -3.01742e-07  3.02254e-07 ) ergs/cm2
Cutoff power-law model
Spectral model in the cutoff power-law:
------------------------------------------------------------
Parameters  : value       lower 90%   higher 90%
Photon index: 1.16322     ( -0.227853   0.192918 )
Epeak [keV] : 271.029      (   )
Norm@50keV  : 4.79027E-03    (     )
------------------------------------------------------------
#Fit statistic : Chi-Squared =          46.09 using 59 PHA bins.
# Reduced chi-squared =         0.8231 for     56 degrees of freedom
# Null hypothesis probability =   8.247693e-01

Photon flux (15-150 keV)    in 239 sec: 0.475257 ( -0.017046  0.017082 ) ph/cm2/s
Energy fluence (15-150 keV)             : 9.27573e-06 ( -3.29055e-07  3.27406e-07 ) ergs/cm2
Band function
Spectral model in the Band function:
------------------------------------------------------------
Parameters  : value       lower 90%   higher 90%
alpha       : 0.369300   ( -2.06256   -0.368849 )
beta        : -1.38222    ( 1.38223   0.074495 )
Epeak [keV] : 40.3486      ( -17.2136 114.478 )
Norm@50keV   : 5.78850E-02    ( -0.0577116   135.13 )
------------------------------------------------------------
#Fit statistic : Chi-Squared =          44.16 using 59 PHA bins.
# Reduced chi-squared =         0.8029 for     55 degrees of freedom
# Null hypothesis probability =   8.521447e-01

Photon flux (15-150 keV)    in 239 sec:  (    ) ph/cm2/s
Energy fluence (15-150 keV)             : 0 ( 0  0 ) ergs/cm2
S(25-50 keV) vs. S(50-100 keV) plot
S(25-50 keV)  = 2.13e-06
S(50-100 keV) = 3.37e-06
T90 vs. Hardness ratio plot

T90                                   = 134.143999993801 sec.
Hardness ratio (energy fluence ratio) = 1.58216
Color vs. Color plot
Count Ratio  (25-50 keV) / (15-25 keV) = 1.50528
Count Ratio (50-100 keV) / (15-25 keV) = 1.33307
Mask shadow pattern
IMX = -1.506037702459664E-01, IMY = -5.348419615468998E-01
TIME vs. PHA plot around the trigger time
Blue+Cyan dotted lines: Time interval of the scaled map
From 0.000000 to 4.096000
TIME vs. DetID plot around the trigger time
Blue+Cyan dotted lines: Time interval of the scaled map
From 0.000000 to 4.096000
100 us light curve (15-350 keV)
Blue+Cyan dotted lines: Time interval of the scaled map
From 0.000000 to 4.096000
Spacecraft aspect plot

Bright source in the pre-burst/pre-slew/post-slew images
Pre-burst image of 15-350 keV band
Time interval of the image:
-239.184000 -130.128000

# RAcent  DECcent POSerr Theta    Phi  PeakCts   SNR AngSep     Name
#  [deg]    [deg]    ['] [deg]  [deg]                   [']
299.6060  35.2186    3.1  57.9   -3.7   2.4521   3.8    1.3	Cyg X-1
308.1073  40.9268    7.3  53.8  -13.1   0.4787   1.6    1.6	Cyg X-3
208.3018  43.4473    2.3  35.7   92.0   1.2829   5.0 ------	UNKNOWN
178.3745  47.6249    1.9  32.0  130.0   1.0461   6.2 ------	UNKNOWN
107.8648  34.1629    2.6  56.4 -157.3   2.0159   4.4 ------	UNKNOWN
Pre-slew background subtracted image of 15-350 keV band
Time interval of the image:
-130.128000 108.912000

# RAcent  DECcent POSerr Theta    Phi  PeakCts   SNR AngSep     Name
#  [deg]    [deg]    ['] [deg]  [deg]                   [']
299.4853  35.2502    5.2  57.8   -3.6  -3.8068  -2.2    5.9	Cyg X-1
308.2230  40.8962    6.2  53.8  -13.2  -1.4951  -1.9    6.1	Cyg X-3
251.1208  36.9666    2.7  47.1   44.0   5.0581   4.2 ------	UNKNOWN
204.0112  45.2785    2.2  33.7   97.2   3.1161   5.1 ------	UNKNOWN
197.2755  49.8380    0.3  29.1  105.7  15.2752  34.7 ------	UNKNOWN
152.1501  64.6322    3.1  19.1  173.8   0.9845   3.7 ------	UNKNOWN
109.6900  52.1668    2.9  38.7 -152.5   1.4767   4.0 ------	UNKNOWN
Post-slew image of 15-350 keV band
Time interval of the image:
300.316630 962.840300

# RAcent  DECcent POSerr Theta    Phi  PeakCts   SNR AngSep     Name
#  [deg]    [deg]    ['] [deg]  [deg]                   [']
352.7413 -72.6630    2.6  46.6   45.9   6.2959   4.5 ------	UNKNOWN
332.4196  26.4436    4.3  59.0 -166.2   6.1791   2.7 ------	UNKNOWN
359.8621  10.0084    3.6  36.2 -137.6   1.7709   3.2 ------	UNKNOWN
Plot creation:
Sat May 30 13:45:05 EDT 2015