Click here for the BAT GCN circular template
Image
Pre-slew 15.0-350.0 keV image (Event data)

#   RAcent    DECcent   POSerr    Theta     Phi              Peak Cts       SNR   Name
  276.8075   -55.5562   0.0122    51.1079    14.2302         2.5505097     15.799 TRIG_00598284

Foreground time interval of the image:
 -0.196  14.301 (delta_t =  14.497 [sec])
Background time interval of the image:
-239.800  -0.196 (delta_t = 239.604 [sec])
Lightcurves
Notes:
- 1) The mask-weighted light curves are using the flight position.
- 2) Multiple plots of different time binning/intervals are shown to cover all scenarios of short/long GRBs, rate/image triggers, and real/false positives.
- 3) For all the mask-weighted lightcurves, the y-axis units are counts/sec/det where a det is 0.4 x 0.4 = 0.16 sq cm.
- 4) The verticle lines correspond to following: green dotted lines are T50 interval, black dotted lines are T90 interval, blue solid line(s) is a spacecraft slew start time, and orange solid line(s) is a spacecraft slew end time.
- 5) Time of each bin is in the middle of the bin.
1 s binning
From T0-310 s to T0+310 s

From T100_start - 20 s to T100_end + 30 s
Full time interval
64 ms binning
Full time interval

From T100_start to T100_end

From T0-5 sec to T0+5 sec

16 ms binning
From T100_start-5 s to T100_start+5 s

Blue+Cyan dotted lines: Time interval of the scaled map
From 0.000000 to 1.024000
8 ms binning
From T100_start-3 s to T100_start+3 s

Blue+Cyan dotted lines: Time interval of the scaled map
From 0.000000 to 1.024000
2 ms binning
From T100_start-1 s to T100_start+1 s
Blue+Cyan dotted lines: Time interval of the scaled map
From 0.000000 to 1.024000
SN=5 or 10 sec. binning (whichever binning is satisfied first)
SN=5 or 10 sec. binning (T < 200 sec)
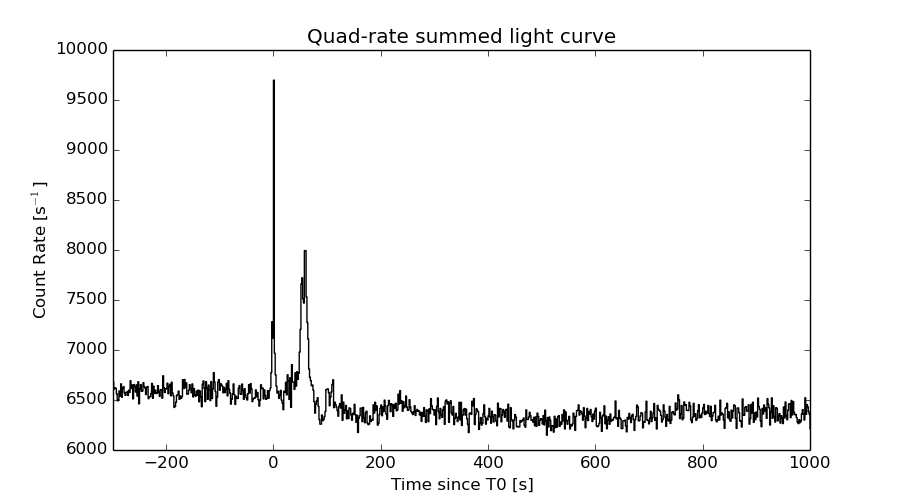
Quad-rate summed light curves (from T0-300s to T0+1000s)
Spectral Evolution

Spectra
Notes:
- 1) The fitting includes the systematic errors.
- 2) When the burst includes telescope slew time periods, the fitting uses an average response file made from multiple 5-s response files through out the slew time plus single time preiod for the non-slew times, and weighted by the total counts in the corresponding time period using addrmf. An average response file is needed becuase a spectral fit using the pre-slew DRM will introduce some errors in both a spectral shape and a normalization if the PHA file contains a lot of the slew/post-slew time interval.
- 3) For fits to more complicated models (e.g. a power-law over a cutoff power-law), the BAT team has decided to require a chi-square improvement of more than 6 for each extra dof.
Time averaged spectrum fit using the average DRM
Power-law model

Time interval is from   -0.196 sec. to  120.176 sec.

Spectral model in power-law:
------------------------------------------------------------
Parameters  : value       lower 90%   higher 90%
Photon index: 1.55681     ( -0.164168   0.164956 )
Norm@50keV  : 2.35195E-03    ( -0.000216091   0.000215592 )
------------------------------------------------------------
#Fit statistic : Chi-Squared =          46.55 using 59 PHA bins.
# Reduced chi-squared =         0.8167 for     57 degrees of freedom
# Null hypothesis probability =   8.370117e-01

Photon flux (15-150 keV)    in 120.4 sec: 0.298332 ( -0.0288433  0.029004 ) ph/cm2/s
Energy fluence (15-150 keV)             : 2.66327e-06 ( -2.59976e-07  2.61207e-07 ) ergs/cm2
Cutoff power-law model

Time interval is from   -0.196 sec. to  120.176 sec.
Spectral model in the cutoff power-law:
------------------------------------------------------------
Parameters  : value       lower 90%   higher 90%
Photon index: 1.55443     ( -0.582068   1.05556 )
Epeak [keV] : 9983.35      (   )
Norm@50keV  : 2.35830E-03    ( -0.00147807   0.00251549 )
------------------------------------------------------------
#Fit statistic : Chi-Squared =          46.55 using 59 PHA bins.
# Reduced chi-squared =         0.8312 for     56 degrees of freedom
# Null hypothesis probability =   8.118712e-01

Photon flux (15-150 keV)    in 120.4 sec: 0.297573 ( -0.030214  0.029536 ) ph/cm2/s
Energy fluence (15-150 keV)             : 2.65138e-06 ( -2.69407e-07  2.72393e-07 ) ergs/cm2
Band function
Time interval is from   -0.196 sec. to  120.176 sec.

Spectral model in the Band function:
------------------------------------------------------------
Parameters  : value       lower 90%   higher 90%
alpha       : -1.29209   ( 1.29209   1.29209 )
beta        : -1.55681    ( 1.55681   0.164248 )
Epeak [keV] : 29.3170      ( -29.317 -29.317 )
Norm@50keV   : 4.57987E-03    ( -0.0024416   185.115 )
------------------------------------------------------------
#Fit statistic : Chi-Squared =          46.55 using 59 PHA bins.
# Reduced chi-squared =         0.8464 for     55 degrees of freedom
# Null hypothesis probability =   7.842048e-01

Photon flux (15-150 keV)    in 120.4 sec:  (    ) ph/cm2/s
Energy fluence (15-150 keV)             : 0 ( 0  0 ) ergs/cm2
Single BB

Spectral model blackbody:
------------------------------------------------------------
Parameters  : value    Lower 90%  Upper 90%
kT [keV]    : 16.2665  (-1.90896  2.20885)
R^2/D10^2   : 2.44579E-02  (-0.00885025   0.0137146)
(R is the radius in km and D10 is the distance to the source in units of 10 kpc)
------------------------------------------------------------
#Fit statistic : Chi-Squared =          80.90 using 59 PHA bins.
# Reduced chi-squared =          1.419 for     57 degrees of freedom
# Null hypothesis probability =   2.040746e-02

Energy  Fluence     90% Error
[keV]   [erg/cm2]   [erg/cm2]
15- 25  1.605e-07   2.980e-08
25- 50  6.849e-07   9.903e-08
50-150  1.275e-06   2.149e-07
15-150  2.120e-06   2.733e-07
Thermal bremsstrahlung (OTTB)

Spectral model: thermal bremsstrahlung
------------------------------------------------------------
Parameters  : value         Lower 90%    Upper 90%
kT [keV]    : 199.357       (-63.9398      -199.361)
Norm        : 1.21210       (-0.109991     0.110235)
------------------------------------------------------------
#Fit statistic : Chi-Squared =          47.23 using 59 PHA bins.
# Reduced chi-squared =         0.8286 for     57 degrees of freedom
# Null hypothesis probability =   8.185942e-01

Energy  Fluence     90% Error
[keV]   [erg/cm2]   [erg/cm2]
15- 25  3.634e-07   4.310e-08
25- 50  6.990e-07   1.696e-07
50-150  1.533e-06   6.656e-07
15-150  2.596e-06   8.205e-07
Double BB

Spectral model: bbodyrad<1> + bbodyrad<2>
------------------------------------------------------------
Parameters  : value         Lower 90%    Upper 90%
kT1 [keV]   : 5.71159        (-1.56859      2.0661)
R1^2/D10^2  : 0.671750        (-0.457242      1.92833)
kT2 [keV]   : 24.4800        (-4.55689      8.15926)
R2^2/D10^2  : 4.97031E-03    (-0.00317775   0.00412697)
------------------------------------------------------------
#Fit statistic : Chi-Squared =          46.74 using 59 PHA bins.
# Reduced chi-squared =         0.8498 for     55 degrees of freedom
# Null hypothesis probability =   7.782515e-01

Energy  Fluence     90% Error
[keV]   [erg/cm2]   [erg/cm2]
15- 25  3.885e-07   1.883e-07
25- 50  6.445e-07   2.035e-07
50-150  1.597e-06   5.491e-07
15-150  2.630e-06   7.754e-07
Peak spectrum fit
Power-law model

Time interval is from    0.004 sec. to    1.004 sec.

Spectral model in power-law:
------------------------------------------------------------
Parameters  : value       lower 90%   higher 90%
Photon index: 1.35842     ( -0.124817   0.124748 )
Norm@50keV  : 9.04534E-02    ( -0.00710032   0.00710019 )
------------------------------------------------------------
#Fit statistic : Chi-Squared =          61.81 using 59 PHA bins.
# Reduced chi-squared =          1.084 for     57 degrees of freedom
# Null hypothesis probability =   3.083586e-01

Photon flux (15-150 keV)    in 1 sec: 10.9161 ( -0.905434  0.907528 ) ph/cm2/s
Energy fluence (15-150 keV)             : 8.81784e-07 ( -7.29442e-08  7.30596e-08 ) ergs/cm2
Cutoff power-law model

Time interval is from    0.004 sec. to    1.004 sec.
Spectral model in the cutoff power-law:
------------------------------------------------------------
Parameters  : value       lower 90%   higher 90%
Photon index: 0.529779     ( -0.645502   0.560671 )
Epeak [keV] : 100.377      ( -21.8836 88.1868 )
Norm@50keV  : 0.216936    ( -0.09521   0.200754 )
------------------------------------------------------------
#Fit statistic : Chi-Squared =          55.12 using 59 PHA bins.
# Reduced chi-squared =         0.9843 for     56 degrees of freedom
# Null hypothesis probability =   5.080341e-01

Photon flux (15-150 keV)    in 1 sec: 10.6409 ( -0.92353  0.9269 ) ph/cm2/s
Energy fluence (15-150 keV)             : 8.67389e-07 ( -7.5528e-08  7.5209e-08 ) ergs/cm2
Band function
Time interval is from    0.004 sec. to    1.004 sec.

Spectral model in the Band function:
------------------------------------------------------------
Parameters  : value       lower 90%   higher 90%
alpha       : -0.534260   ( -0.482887   0.423635 )
beta        : -9.35885    ( 9.36933   19.3693 )
Epeak [keV] : 100.796      ( -16.2232 73.9543 )
Norm@50keV   : 0.215585    ( -0.0938698   0.0600099 )
------------------------------------------------------------
#Fit statistic : Chi-Squared =          55.12 using 59 PHA bins.
# Reduced chi-squared =          1.002 for     55 degrees of freedom
# Null hypothesis probability =   4.699402e-01

Photon flux (15-150 keV)    in 1 sec: 10.6499 (    ) ph/cm2/s
Energy fluence (15-150 keV)             : 0 ( 0  0 ) ergs/cm2
Single BB

Spectral model blackbody:
------------------------------------------------------------
Parameters  : value    Lower 90%  Upper 90%
kT [keV]    : 18.0892  (-1.50325  1.68157)
R^2/D10^2   : 0.715220  (-0.192071   0.252959)
(R is the radius in km and D10 is the distance to the source in units of 10 kpc)
------------------------------------------------------------
#Fit statistic : Chi-Squared =          73.90 using 59 PHA bins.
# Reduced chi-squared =          1.297 for     57 degrees of freedom
# Null hypothesis probability =   6.548150e-02

Energy  Fluence     90% Error
[keV]   [erg/cm2]   [erg/cm2]
15- 25  4.678e-08   6.530e-09
25- 50  2.172e-07   2.310e-08
50-150  5.165e-07   6.285e-08
15-150  7.804e-07   7.485e-08
Thermal bremsstrahlung (OTTB)

Spectral model: thermal bremsstrahlung
------------------------------------------------------------
Parameters  : value         Lower 90%    Upper 90%
kT [keV]    : 200.000       (      )
Norm        : 46.1264       (-3.64005     3.6396)
------------------------------------------------------------
#Fit statistic : Chi-Squared =          66.30 using 59 PHA bins.
# Reduced chi-squared =          1.163 for     57 degrees of freedom
# Null hypothesis probability =   1.868199e-01

Energy  Fluence     90% Error
[keV]   [erg/cm2]   [erg/cm2]
15- 25  1.149e-07   1.135e-08
25- 50  2.210e-07   2.560e-08
50-150  4.847e-07   1.247e-07
15-150  8.206e-07   1.568e-07
Double BB

Spectral model: bbodyrad<1> + bbodyrad<2>
------------------------------------------------------------
Parameters  : value         Lower 90%    Upper 90%
kT1 [keV]   : 5.09990        (-1.83276      7.80313)
R1^2/D10^2  : 23.1071        (-21.4387      82.0504)
kT2 [keV]   : 21.6522        (-2.75802      21.8367)
R2^2/D10^2  : 0.347249    (-0.325196   0.24958)
------------------------------------------------------------
#Fit statistic : Chi-Squared =          56.73 using 59 PHA bins.
# Reduced chi-squared =          1.031 for     55 degrees of freedom
# Null hypothesis probability =   4.103861e-01

Energy  Fluence     90% Error
[keV]   [erg/cm2]   [erg/cm2]
15- 25  9.113e-08   3.790e-08
25- 50  2.006e-07   4.760e-08
50-150  5.583e-07   9.870e-08
15-150  8.501e-07   1.681e-07
Pre-slew spectrum (Pre-slew PHA with pre-slew DRM)
Power-law model

Spectral model in power-law:
------------------------------------------------------------
Parameters  : value       lower 90%   higher 90%
Photon index: 1.67656     ( -0.179166   0.181631 )
Norm@50keV  : 1.20506E-02    ( -0.00124635   0.00124183 )
------------------------------------------------------------
#Fit statistic : Chi-Squared =          48.36 using 59 PHA bins.
# Reduced chi-squared =         0.8485 for     57 degrees of freedom
# Null hypothesis probability =   7.853647e-01

Photon flux (15-150 keV)    in 14.5 sec: 1.58757 ( -0.174066  0.175008 ) ph/cm2/s
Energy fluence (15-150 keV)             : 1.62101e-06 ( -1.73536e-07  1.74362e-07 ) ergs/cm2
Cutoff power-law model

Spectral model in the cutoff power-law:
------------------------------------------------------------
Parameters  : value       lower 90%   higher 90%
Photon index: 1.55229     ( -0.750752   0.301613 )
Epeak [keV] : 190.668      ( -190.668 -190.668 )
Norm@50keV  : 1.38453E-02    (     )
------------------------------------------------------------
#Fit statistic : Chi-Squared =          48.27 using 59 PHA bins.
# Reduced chi-squared =         0.8619 for     56 degrees of freedom
# Null hypothesis probability =   7.591777e-01

Photon flux (15-150 keV)    in 14.5 sec: 1.57715 ( -0.18242  0.18154 ) ph/cm2/s
Energy fluence (15-150 keV)             : 1.61211e-06 ( -1.82799e-07  1.80148e-07 ) ergs/cm2
Band function

Spectral model in the Band function:
------------------------------------------------------------
Parameters  : value       lower 90%   higher 90%
alpha       : -1.42348   ( 1.44421   1.44421 )
beta        : -1.77584    ( 1.77136   0.270279 )
Epeak [keV] : 107.782      ( -120.475 -120.475 )
Norm@50keV   : 1.62853E-02    ( -0.00455728   0 )
------------------------------------------------------------
#Fit statistic : Chi-Squared =          48.26 using 59 PHA bins.
# Reduced chi-squared =         0.8775 for     55 degrees of freedom
# Null hypothesis probability =   7.279556e-01

Photon flux (15-150 keV)    in 14.5 sec:  (    ) ph/cm2/s
Energy fluence (15-150 keV)             : 0 ( 0  0 ) ergs/cm2
S(25-50 keV) vs. S(50-100 keV) plot

S(25-50 keV)  = 6.77e-07
S(50-100 keV) = 9.20e-07
T90 vs. Hardness ratio plot
T90                                   = 111.103999972343 sec.
Hardness ratio (energy fluence ratio) = 1.35894
Color vs. Color plot
Count Ratio  (25-50 keV) / (15-25 keV) = 1.31986
Count Ratio (50-100 keV) / (15-25 keV) = 1.1147
Mask shadow pattern

IMX = 1.201626225300685E+00, IMY = -3.047330864359771E-01
TIME vs. PHA plot around the trigger time
Blue+Cyan dotted lines: Time interval of the scaled map
From 0.000000 to 1.024000
TIME vs. DetID plot around the trigger time
Blue+Cyan dotted lines: Time interval of the scaled map
From 0.000000 to 1.024000
100 us light curve (15-350 keV)
Blue+Cyan dotted lines: Time interval of the scaled map
From 0.000000 to 1.024000
Spacecraft aspect plot

Bright source in the pre-burst/pre-slew/post-slew images
Pre-burst image of 15-350 keV band
Time interval of the image:
-239.800000 -0.196000

# RAcent  DECcent POSerr Theta    Phi  PeakCts   SNR AngSep     Name
#  [deg]    [deg]    ['] [deg]  [deg]                   [']
245.0185 -15.5481    1.0  37.3   81.2   8.2223  11.3    6.0	Sco X-1
254.4440  35.4139    2.9  47.3  160.9   2.5486   3.9    4.3	Her X-1
256.0467 -37.7470    1.2  40.4   42.3   5.2208  10.0    6.5	4U 1700-377
256.4653 -36.4078    5.8  39.1   43.3   0.9450   2.0    1.7	GX 349+2
262.9656 -24.8885    7.4  26.9   50.1   0.4649   1.6    8.9	GX 1+4
264.6541 -44.3550    6.3  42.4   28.7   0.8393   1.8    6.9	4U 1735-44
268.3678  -1.4734    7.4  13.3  114.1   0.3503   1.6    1.3	SW J1753.5-0127
270.3326 -25.0275    2.6  23.0   37.1   1.0874   4.4    4.1	GX 5-1
270.4489 -25.7466    4.2  23.6   36.0   0.6893   2.8    7.9	GRS 1758-258
274.1001 -13.9288    2.9  11.7   47.6   0.8769   4.0    8.5	GX 17+2
275.9258 -30.3615   11.3  26.3   21.5   0.2406   1.0    0.3	H1820-303
285.1716 -24.9622   14.8  20.7    1.0   0.1712   0.8    7.8	HT1900.1-2455
288.8222  11.0269    1.1  17.3 -143.4   2.5000  10.3    5.1	GRS 1915+105
299.6301  35.2796    0.8  43.4 -147.1   6.3977  14.3    5.1	Cyg X-1
308.1484  40.8270   32.8  51.6 -143.2   0.3652   0.4    7.7	Cyg X-3
262.8173 -33.8036    5.5  33.9   39.1  -0.7765  -2.1    8.8	GX 354-0
251.4174  -8.9725    2.4  30.0   90.9   1.9994   4.8 ------	UNKNOWN
309.1816  44.7055    9.6  55.3 -145.1   1.8582   1.2 ------	UNKNOWN
Pre-slew background subtracted image of 15-350 keV band
Time interval of the image:
-0.196000 14.300730

# RAcent  DECcent POSerr Theta    Phi  PeakCts   SNR AngSep     Name
#  [deg]    [deg]    ['] [deg]  [deg]                   [']
244.8321 -15.7173    4.3  37.5   81.0   0.4005   2.7    9.7	Sco X-1
254.5610  35.4731   12.3  47.2  161.1  -0.1135  -0.9    9.3	Her X-1
255.8226 -37.8679    7.7  40.6   42.4  -0.1732  -1.5    7.9	4U 1700-377
256.5127 -36.3734    7.4  39.1   43.3   0.1641   1.5    4.8	GX 349+2
262.8248 -24.6139    5.3  26.8   50.7   0.1257   2.2   12.8	GX 1+4
264.5278 -44.2996    0.0  42.4   28.8  -0.1098  -1.2   12.9	4U 1735-44
268.2333  -1.5508    8.9  13.4  113.6   0.0571   1.3   10.0	SW J1753.5-0127
270.1207 -25.0616   10.0  23.1   37.5  -0.0553  -1.2    8.9	GX 5-1
270.4302 -25.5850    0.0  23.4   36.2   0.0259   0.5   11.7	GRS 1758-258
274.0078 -14.1862    6.6  12.0   47.2  -0.0765  -1.7    9.0	GX 17+2
275.7837 -30.4405    5.4  26.4   21.7  -0.1079  -2.1    8.5	H1820-303
284.9187 -24.9485    5.0  20.7    1.6  -0.0995  -2.3    6.6	HT1900.1-2455
288.6995  10.7800   11.6  17.0 -143.4   0.0431   1.0   11.5	GRS 1915+105
299.5344  35.2021   17.0  43.3 -147.1   0.0543   0.7    2.7	Cyg X-1
307.9570  40.9336   10.5  51.6 -143.4   0.1739   1.1    7.0	Cyg X-3
262.9519 -33.8700    6.4  33.9   38.9   0.1336   1.8    2.8	GX 354-0
276.8075 -55.5562    0.7  51.1   14.2   2.5505  15.8 ------	UNKNOWN
295.6500  34.0154    2.5  40.9 -150.7   0.3036   4.7 ------	UNKNOWN
Post-slew image of 15-350 keV band
Time interval of the image:
86.700590 962.234000

# RAcent  DECcent POSerr Theta    Phi  PeakCts   SNR AngSep     Name
#  [deg]    [deg]    ['] [deg]  [deg]                   [']
170.6770 -60.5833    7.0  50.0   15.9   2.8106   1.7   10.9	Cen X-3
186.5134 -62.7928    4.5  42.8   20.2   2.9657   2.5    4.2	GX 301-2
255.9754 -37.8345    0.4  22.6  111.2  22.7705  30.1    0.8	4U 1700-377
256.4569 -36.4925    3.4  23.6  113.8   2.6884   3.4    4.3	GX 349+2
262.9999 -24.6710    5.1  32.6  134.3   2.3564   2.3    4.5	GX 1+4
264.7140 -44.6084    8.9  13.4  118.2   0.8495   1.3    9.6	4U 1735-44
270.3266 -25.0501    4.2  31.0  146.6   2.4592   2.7    2.9	GX 5-1
270.3533 -25.7905    2.2  30.2  146.4   4.7888   5.2    4.0	GRS 1758-258
274.0276 -14.0898    5.0  41.6  153.9   3.6029   2.3    3.4	GX 17+2
275.7394 -30.3838    6.8  25.3  155.9   1.2808   1.7    9.7	H1820-303
285.0031 -24.8830    5.0  31.4  172.4   1.7400   2.3    2.9	HT1900.1-2455
263.1737 -33.7577    7.2  23.8  129.0   1.1613   1.6   10.3	GX 354-0
266.1693 -28.7477    1.9  28.0  137.8   4.8197   5.9 ------	UNKNOWN
256.7784 -45.0019    2.6  16.5   99.7   2.8512   4.5 ------	UNKNOWN
277.3329 -23.8112    2.9  31.9  158.9   3.7237   4.0 ------	UNKNOWN
278.5908 -32.3578    3.2  23.3  161.9   2.4480   3.6 ------	UNKNOWN
181.3127 -73.4057    2.7  39.1    4.7   3.9804   4.2 ------	UNKNOWN
322.7008 -15.5385    4.0  53.2 -142.2  14.9497   2.9 ------	UNKNOWN
Plot creation:
Sat May 30 13:37:48 EDT 2015