Click here for the BAT GCN circular template
Image
Pre-slew 15.0-350.0 keV image (Event data)
#   RAcent    DECcent   POSerr    Theta     Phi              Peak Cts       SNR   Name
  186.0690    15.0997   0.0084    13.1348   156.6536         1.2848853     22.923 TRIG_00599037

Foreground time interval of the image:
-22.028   3.764 (delta_t =  25.792 [sec])
Background time interval of the image:
-155.403 -22.028 (delta_t = 133.375 [sec])
Lightcurves
Notes:
- 1) The mask-weighted light curves are using the flight position.
- 2) Multiple plots of different time binning/intervals are shown to cover all scenarios of short/long GRBs, rate/image triggers, and real/false positives.
- 3) For all the mask-weighted lightcurves, the y-axis units are counts/sec/det where a det is 0.4 x 0.4 = 0.16 sq cm.
- 4) The verticle lines correspond to following: green dotted lines are T50 interval, black dotted lines are T90 interval, blue solid line(s) is a spacecraft slew start time, and orange solid line(s) is a spacecraft slew end time.
- 5) Time of each bin is in the middle of the bin.
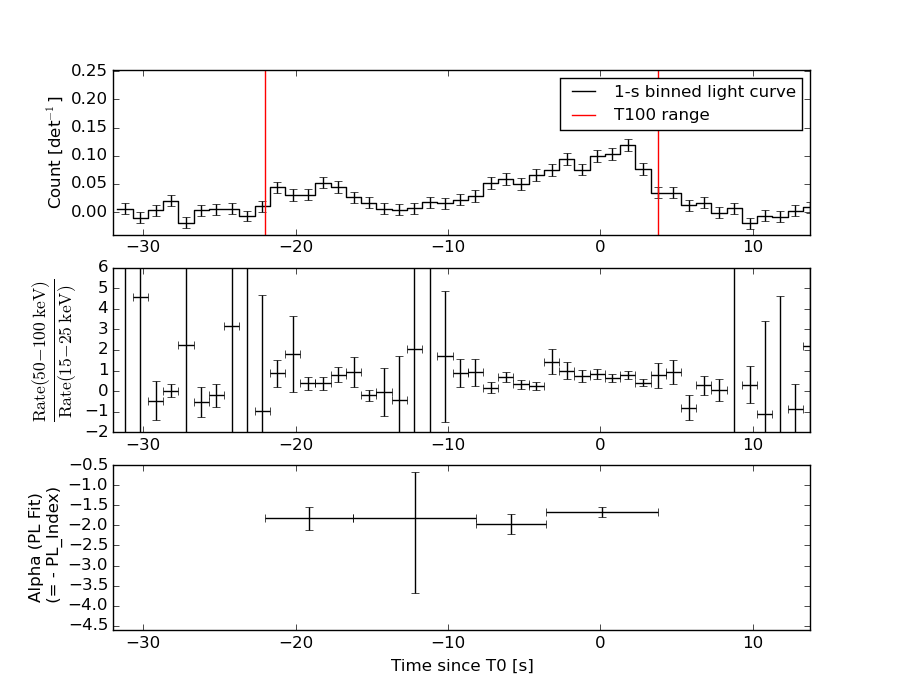
1 s binning
From T0-310 s to T0+310 s

From T100_start - 20 s to T100_end + 30 s

Full time interval
64 ms binning
Full time interval

From T100_start to T100_end
From T0-5 sec to T0+5 sec
16 ms binning
From T100_start-5 s to T100_start+5 s
Blue+Cyan dotted lines: Time interval of the scaled map
From 0.000000 to 1.024000
8 ms binning
From T100_start-3 s to T100_start+3 s
Blue+Cyan dotted lines: Time interval of the scaled map
From 0.000000 to 1.024000
2 ms binning
From T100_start-1 s to T100_start+1 s
Blue+Cyan dotted lines: Time interval of the scaled map
From 0.000000 to 1.024000
SN=5 or 10 sec. binning (whichever binning is satisfied first)
SN=5 or 10 sec. binning (T < 200 sec)

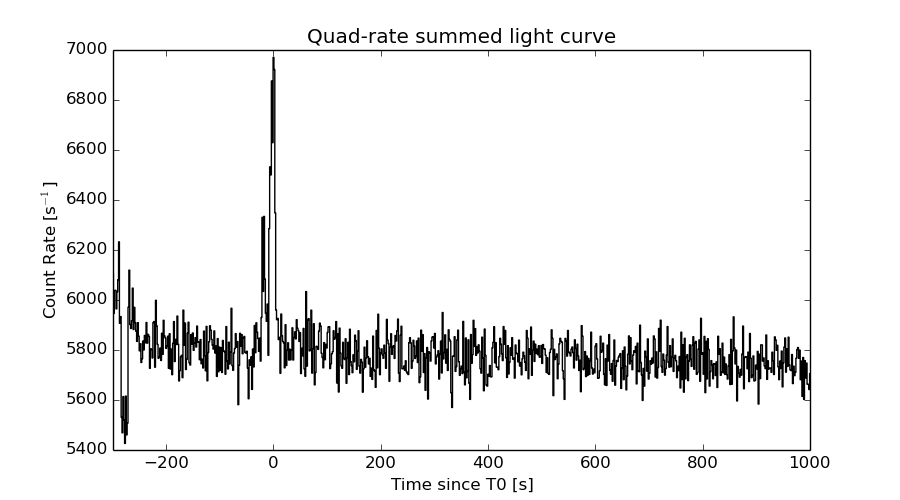
Quad-rate summed light curves (from T0-300s to T0+1000s)
Spectral Evolution
Spectra
Notes:
- 1) The fitting includes the systematic errors.
- 2) When the burst includes telescope slew time periods, the fitting uses an average response file made from multiple 5-s response files through out the slew time plus single time preiod for the non-slew times, and weighted by the total counts in the corresponding time period using addrmf. An average response file is needed becuase a spectral fit using the pre-slew DRM will introduce some errors in both a spectral shape and a normalization if the PHA file contains a lot of the slew/post-slew time interval.
- 3) For fits to more complicated models (e.g. a power-law over a cutoff power-law), the BAT team has decided to require a chi-square improvement of more than 6 for each extra dof.
Time averaged spectrum fit using the average DRM
Power-law model
Time interval is from  -22.028 sec. to    3.764 sec.

Spectral model in power-law:
------------------------------------------------------------
Parameters  : value       lower 90%   higher 90%
Photon index: 1.77665     ( -0.125065   0.127965 )
Norm@50keV  : 2.82813E-03    ( -0.000224836   0.000222297 )
------------------------------------------------------------
#Fit statistic : Chi-Squared =          58.67 using 59 PHA bins.
# Reduced chi-squared =          1.029 for     57 degrees of freedom
# Null hypothesis probability =   4.141615e-01

Photon flux (15-150 keV)    in 25.79 sec: 0.386239 ( -0.0268638  0.026877 ) ph/cm2/s
Energy fluence (15-150 keV)             : 6.72103e-07 ( -5.47259e-08  5.54451e-08 ) ergs/cm2
Cutoff power-law model
Time interval is from  -22.028 sec. to    3.764 sec.
Spectral model in the cutoff power-law:
------------------------------------------------------------
Parameters  : value       lower 90%   higher 90%
Photon index: 0.984096     ( -0.636864   0.551004 )
Epeak [keV] : 56.3679      ( -9.85982 31.2991 )
Norm@50keV  : 7.76230E-03    ( -0.00385683   0.00961304 )
------------------------------------------------------------
#Fit statistic : Chi-Squared =          52.30 using 59 PHA bins.
# Reduced chi-squared =         0.9340 for     56 degrees of freedom
# Null hypothesis probability =   6.155372e-01

Photon flux (15-150 keV)    in 25.79 sec: 0.372071 ( -0.028456  0.02847 ) ph/cm2/s
Energy fluence (15-150 keV)             : 6.19233e-07 ( -6.25562e-08  6.49547e-08 ) ergs/cm2
Band function
Time interval is from  -22.028 sec. to    3.764 sec.

Spectral model in the Band function:
------------------------------------------------------------
Parameters  : value       lower 90%   higher 90%
alpha       : -0.985649   ( -0.523138   2.13336 )
beta        : -2.79876    ( 2.81093   0.956941 )
Epeak [keV] : 56.3354      ( -23.1195 28.3689 )
Norm@50keV   : 7.74324E-03    ( -0.00413659   0.185007 )
------------------------------------------------------------
#Fit statistic : Chi-Squared =          52.25 using 59 PHA bins.
# Reduced chi-squared =         0.9500 for     55 degrees of freedom
# Null hypothesis probability =   5.803469e-01

Photon flux (15-150 keV)    in 25.79 sec:  (    ) ph/cm2/s
Energy fluence (15-150 keV)             : 6.20226e-07 ( 0  0 ) ergs/cm2
Single BB
Spectral model blackbody:
------------------------------------------------------------
Parameters  : value    Lower 90%  Upper 90%
kT [keV]    : 11.5642  (-0.920815  1.01443)
R^2/D10^2   : 0.106490  (-0.0286526   0.0386293)
(R is the radius in km and D10 is the distance to the source in units of 10 kpc)
------------------------------------------------------------
#Fit statistic : Chi-Squared =          80.40 using 59 PHA bins.
# Reduced chi-squared =          1.411 for     57 degrees of freedom
# Null hypothesis probability =   2.228935e-02

Energy  Fluence     90% Error
[keV]   [erg/cm2]   [erg/cm2]
15- 25  7.738e-08   9.026e-09
25- 50  2.329e-07   1.914e-08
50-150  1.826e-07   3.319e-08
15-150  4.929e-07   4.281e-08
Thermal bremsstrahlung (OTTB)

Spectral model: thermal bremsstrahlung
------------------------------------------------------------
Parameters  : value         Lower 90%    Upper 90%
kT [keV]    : 99.5415       (-23.0476      36.4773)
Norm        : 1.71031       (-0.160885     0.184821)
------------------------------------------------------------
#Fit statistic : Chi-Squared =          53.08 using 59 PHA bins.
# Reduced chi-squared =         0.9312 for     57 degrees of freedom
# Null hypothesis probability =   6.229422e-01

Energy  Fluence     90% Error
[keV]   [erg/cm2]   [erg/cm2]
15- 25  1.153e-07   1.382e-08
25- 50  1.992e-07   1.661e-08
50-150  3.219e-07   1.055e-07
15-150  6.364e-07   1.164e-07
Double BB

Spectral model: bbodyrad<1> + bbodyrad<2>
------------------------------------------------------------
Parameters  : value         Lower 90%    Upper 90%
kT1 [keV]   : 6.60310        (-2.09172      1.99208)
R1^2/D10^2  : 0.511160        (-0.273404      1.32771)
kT2 [keV]   : 19.5891        (-4.68498      10.3935)
R2^2/D10^2  : 1.06431E-02    (-0.00861563   0.0238601)
------------------------------------------------------------
#Fit statistic : Chi-Squared =          53.50 using 59 PHA bins.
# Reduced chi-squared =         0.9728 for     55 degrees of freedom
# Null hypothesis probability =   5.319411e-01

Energy  Fluence     90% Error
[keV]   [erg/cm2]   [erg/cm2]
15- 25  1.070e-07   3.313e-08
25- 50  2.061e-07   7.157e-08
50-150  2.992e-07   1.443e-07
15-150  6.124e-07   2.546e-07
Peak spectrum fit
Power-law model
Time interval is from    1.508 sec. to    2.508 sec.

Spectral model in power-law:
------------------------------------------------------------
Parameters  : value       lower 90%   higher 90%
Photon index: 1.70000     ( -0.234713   0.243935 )
Norm@50keV  : 6.81604E-03    ( -0.00114869   0.00113032 )
------------------------------------------------------------
#Fit statistic : Chi-Squared =          53.67 using 59 PHA bins.
# Reduced chi-squared =         0.9416 for     57 degrees of freedom
# Null hypothesis probability =   6.008223e-01

Photon flux (15-150 keV)    in 1 sec: 0.905243 ( -0.133447  0.133456 ) ph/cm2/s
Energy fluence (15-150 keV)             : 6.31137e-08 ( -1.09786e-08  1.12801e-08 ) ergs/cm2
Cutoff power-law model
Time interval is from    1.508 sec. to    2.508 sec.
Spectral model in the cutoff power-law:
------------------------------------------------------------
Parameters  : value       lower 90%   higher 90%
Photon index: -6.42378E-02     ( -1.62491   1.2157 )
Epeak [keV] : 47.9124      ( -8.98403 22.0396 )
Norm@50keV  : 7.34246E-02    ( -0.0734258   0.597612 )
------------------------------------------------------------
#Fit statistic : Chi-Squared =          46.84 using 59 PHA bins.
# Reduced chi-squared =         0.8364 for     56 degrees of freedom
# Null hypothesis probability =   8.034582e-01

Photon flux (15-150 keV)    in 1 sec: 0.867106 ( -0.13329  0.134364 ) ph/cm2/s
Energy fluence (15-150 keV)             : 5.35118e-08 ( -1.04665e-08  1.21067e-08 ) ergs/cm2
Band function
Time interval is from    1.508 sec. to    2.508 sec.

Spectral model in the Band function:
------------------------------------------------------------
Parameters  : value       lower 90%   higher 90%
alpha       : 4.99165   ( -14.9353   -4.99165 )
beta        : -2.12864    ( -0.626384   0.362744 )
Epeak [keV] : 28.1957      ( -6.28735 5.3208 )
Norm@50keV   : 454.393    ( -64.9646   1756.61 )
------------------------------------------------------------
#Fit statistic : Chi-Squared =          45.89 using 59 PHA bins.
# Reduced chi-squared =         0.8343 for     55 degrees of freedom
# Null hypothesis probability =   8.043888e-01

Photon flux (15-150 keV)    in 1 sec:  (    ) ph/cm2/s
Energy fluence (15-150 keV)             : 5.50755e-08 ( 0  0 ) ergs/cm2
Single BB
Spectral model blackbody:
------------------------------------------------------------
Parameters  : value    Lower 90%  Upper 90%
kT [keV]    : 11.2948  (-1.6445  1.94321)
R^2/D10^2   : 0.293976  (-0.131039   0.230179)
(R is the radius in km and D10 is the distance to the source in units of 10 kpc)
------------------------------------------------------------
#Fit statistic : Chi-Squared =          49.31 using 59 PHA bins.
# Reduced chi-squared =         0.8652 for     57 degrees of freedom
# Null hypothesis probability =   7.554453e-01

Energy  Fluence     90% Error
[keV]   [erg/cm2]   [erg/cm2]
15- 25  7.874e-09   1.872e-09
25- 50  2.302e-08   4.470e-09
50-150  1.693e-08   5.813e-09
15-150  4.782e-08   9.850e-09
Thermal bremsstrahlung (OTTB)
Spectral model: thermal bremsstrahlung
------------------------------------------------------------
Parameters  : value         Lower 90%    Upper 90%
kT [keV]    : 99.9448       (-37.2131      -99.9631)
Norm        : 4.08115       (-0.740284     0.856211)
------------------------------------------------------------
#Fit statistic : Chi-Squared =          50.24 using 59 PHA bins.
# Reduced chi-squared =         0.8815 for     57 degrees of freedom
# Null hypothesis probability =   7.245810e-01

Energy  Fluence     90% Error
[keV]   [erg/cm2]   [erg/cm2]
15- 25  1.067e-08   2.099e-09
25- 50  1.844e-08   3.700e-09
50-150  2.988e-08   1.700e-08
15-150  5.899e-08   2.083e-08
Double BB
Spectral model: bbodyrad<1> + bbodyrad<2>
------------------------------------------------------------
Parameters  : value         Lower 90%    Upper 90%
kT1 [keV]   : 7.07728        (-4.00639      -7.06425)
R1^2/D10^2  : 0.864329        (-0.771081      7.74489)
kT2 [keV]   : 16.8400        (-13.8164      -16.8822)
R2^2/D10^2  : 4.33483E-02    (-0.0432865   0.257898)
------------------------------------------------------------
#Fit statistic : Chi-Squared =          46.21 using 59 PHA bins.
# Reduced chi-squared =         0.8402 for     55 degrees of freedom
# Null hypothesis probability =   7.947166e-01

Energy  Fluence     90% Error
[keV]   [erg/cm2]   [erg/cm2]
15- 25  9.544e-09   5.795e-09
25- 50  2.086e-08   1.112e-08
50-150  2.394e-08   1.402e-08
15-150  5.435e-08   2.894e-08
Pre-slew spectrum (Pre-slew PHA with pre-slew DRM)
Power-law model

Spectral model in power-law:
------------------------------------------------------------
Parameters  : value       lower 90%   higher 90%
Photon index: 1.77665     ( -0.125065   0.127965 )
Norm@50keV  : 2.82813E-03    ( -0.000224836   0.000222297 )
------------------------------------------------------------
#Fit statistic : Chi-Squared =          58.67 using 59 PHA bins.
# Reduced chi-squared =          1.029 for     57 degrees of freedom
# Null hypothesis probability =   4.141615e-01

Photon flux (15-150 keV)    in 25.79 sec: 0.386239 ( -0.0268638  0.026877 ) ph/cm2/s
Energy fluence (15-150 keV)             : 6.72103e-07 ( -5.47259e-08  5.54451e-08 ) ergs/cm2
Cutoff power-law model

Spectral model in the cutoff power-law:
------------------------------------------------------------
Parameters  : value       lower 90%   higher 90%
Photon index: 0.984096     ( -0.636864   0.551004 )
Epeak [keV] : 56.3679      ( -9.85982 31.2991 )
Norm@50keV  : 7.76230E-03    ( -0.00385683   0.00961304 )
------------------------------------------------------------
#Fit statistic : Chi-Squared =          52.30 using 59 PHA bins.
# Reduced chi-squared =         0.9340 for     56 degrees of freedom
# Null hypothesis probability =   6.155372e-01

Photon flux (15-150 keV)    in 25.79 sec: 0.372071 ( -0.028456  0.02847 ) ph/cm2/s
Energy fluence (15-150 keV)             : 6.19233e-07 ( -6.25562e-08  6.49547e-08 ) ergs/cm2
Band function
Spectral model in the Band function:
------------------------------------------------------------
Parameters  : value       lower 90%   higher 90%
alpha       : -0.985649   ( -0.523138   2.13336 )
beta        : -2.79876    ( 2.81093   0.956941 )
Epeak [keV] : 56.3354      ( -23.1195 28.3691 )
Norm@50keV   : 7.74324E-03    ( -0.00413659   0.196701 )
------------------------------------------------------------
#Fit statistic : Chi-Squared =          52.25 using 59 PHA bins.
# Reduced chi-squared =         0.9500 for     55 degrees of freedom
# Null hypothesis probability =   5.803469e-01

Photon flux (15-150 keV)    in 25.79 sec:  (    ) ph/cm2/s
Energy fluence (15-150 keV)             : 6.20226e-07 ( 0  0 ) ergs/cm2
S(25-50 keV) vs. S(50-100 keV) plot
S(25-50 keV)  = 1.88e-07
S(50-100 keV) = 2.19e-07
T90 vs. Hardness ratio plot
T90                                   = 23.4159999489784 sec.
Hardness ratio (energy fluence ratio) = 1.16489
Color vs. Color plot
Count Ratio  (25-50 keV) / (15-25 keV) = 1.24245
Count Ratio (50-100 keV) / (15-25 keV) = 0.684705
Mask shadow pattern

IMX = -2.142427386856387E-01, IMY = -9.247330130020254E-02
TIME vs. PHA plot around the trigger time
Blue+Cyan dotted lines: Time interval of the scaled map
From 0.000000 to 1.024000
TIME vs. DetID plot around the trigger time
Blue+Cyan dotted lines: Time interval of the scaled map
From 0.000000 to 1.024000
100 us light curve (15-350 keV)

Blue+Cyan dotted lines: Time interval of the scaled map
From 0.000000 to 1.024000
Spacecraft aspect plot
Bright source in the pre-burst/pre-slew/post-slew images
Pre-burst image of 15-350 keV band
Time interval of the image:
-155.403410 -22.028000

# RAcent  DECcent POSerr Theta    Phi  PeakCts   SNR AngSep     Name
#  [deg]    [deg]    ['] [deg]  [deg]                   [']
254.5173  35.4423   14.2  52.6    9.4   0.3815   0.8    6.7	Her X-1
213.5018   0.9681    2.9  32.1   84.3   1.0852   4.0 ------	UNKNOWN
166.7393   1.5345    2.8  35.6  175.0   0.7051   4.1 ------	UNKNOWN
232.8713  63.4340    3.0  45.1  -31.1   0.9072   3.9 ------	UNKNOWN
Pre-slew background subtracted image of 15-350 keV band
Time interval of the image:
-22.028000 3.764000

# RAcent  DECcent POSerr Theta    Phi  PeakCts   SNR AngSep     Name
#  [deg]    [deg]    ['] [deg]  [deg]                   [']
254.4549  35.4086    6.9  52.5    9.4  -0.3560  -1.7    4.0	Her X-1
238.2295  11.6208    2.2  44.9   45.6   1.1807   5.2 ------	UNKNOWN
165.7587  -8.7840    2.4  44.1  165.9   0.5623   4.8 ------	UNKNOWN
186.0690  15.0997    0.5  13.1  156.7   1.2848  22.9 ------	UNKNOWN
249.1430  63.4925    2.4  51.5  -26.7   0.7883   4.8 ------	UNKNOWN
194.8342  73.0783    2.1  46.6  -54.2   1.6064   5.6 ------	UNKNOWN
Post-slew image of 15-350 keV band
Time interval of the image:
59.196600 782.430300
840.296000 962.332600

# RAcent  DECcent POSerr Theta    Phi  PeakCts   SNR AngSep     Name
#  [deg]    [deg]    ['] [deg]  [deg]                   [']
176.5511 -35.9234    2.7  51.8  154.6  10.6463   4.3 ------	UNKNOWN
242.7278  44.5502    3.5  55.9   10.8  10.4078   3.3 ------	UNKNOWN
209.9228  43.6616    3.9  35.1   -4.5   1.9672   2.9 ------	UNKNOWN
170.6352  24.3033    2.4  17.2  -90.3   2.2587   4.8 ------	UNKNOWN
136.2377   1.5852    4.3  50.9 -135.6   7.9071   2.7 ------	UNKNOWN
140.9187  19.0845    2.6  43.2 -113.2  10.5663   4.4 ------	UNKNOWN
Plot creation:
Sat May 30 13:32:39 EDT 2015