Special notes of this burst
Image
Pre-slew 15.0-350.0 keV image (Event data)
#   RAcent    DECcent   POSerr    Theta     Phi              Peak Cts       SNR   Name
  252.9756    39.9610   0.0244    22.6469    40.6295         0.0572317      7.868 TRIG_00599188

Foreground time interval of the image:
 -0.024   0.296 (delta_t =   0.320 [sec])
Background time interval of the image:
-315.915 -300.722 (delta_t =  15.193 [sec])
-239.816  -0.024 (delta_t = 239.792 [sec])
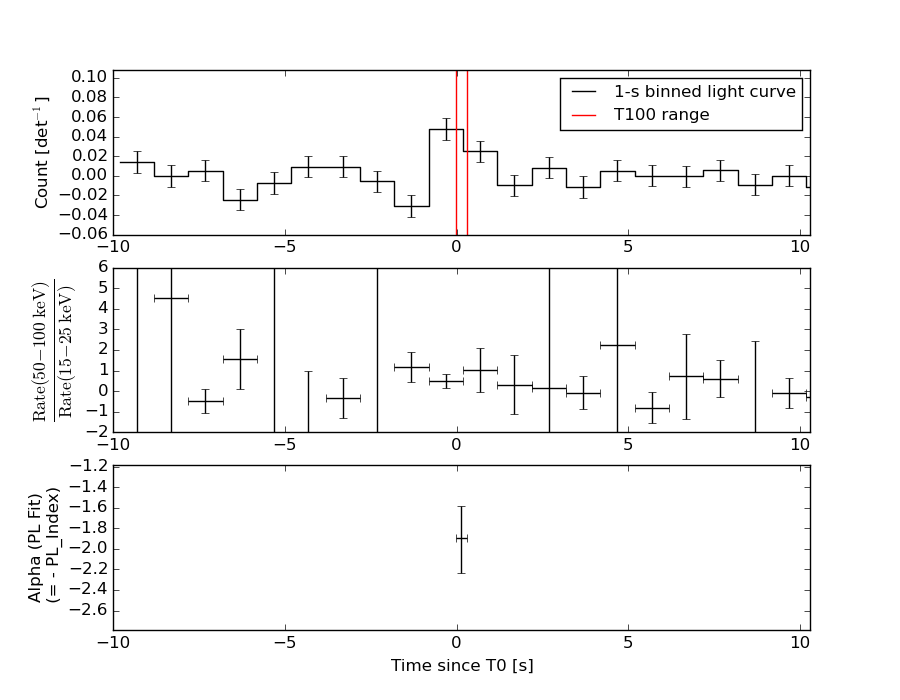
Lightcurves
Notes:
- 1) The mask-weighted light curves are using the flight position.
- 2) Multiple plots of different time binning/intervals are shown to cover all scenarios of short/long GRBs, rate/image triggers, and real/false positives.
- 3) For all the mask-weighted lightcurves, the y-axis units are counts/sec/det where a det is 0.4 x 0.4 = 0.16 sq cm.
- 4) The verticle lines correspond to following: green dotted lines are T50 interval, black dotted lines are T90 interval, blue solid line(s) is a spacecraft slew start time, and orange solid line(s) is a spacecraft slew end time.
- 5) Time of each bin is in the middle of the bin.
1 s binning
From T0-310 s to T0+310 s
From T100_start - 20 s to T100_end + 30 s
Full time interval
64 ms binning
Full time interval
From T100_start to T100_end
From T0-5 sec to T0+5 sec
16 ms binning
From T100_start-5 s to T100_start+5 s
Blue+Cyan dotted lines: Time interval of the scaled map
From 0.000000 to 0.128000
8 ms binning
From T100_start-3 s to T100_start+3 s
Blue+Cyan dotted lines: Time interval of the scaled map
From 0.000000 to 0.128000
2 ms binning
From T100_start-1 s to T100_start+1 s

Blue+Cyan dotted lines: Time interval of the scaled map
From 0.000000 to 0.128000
SN=5 or 10 sec. binning (whichever binning is satisfied first)
SN=5 or 10 sec. binning (T < 200 sec)
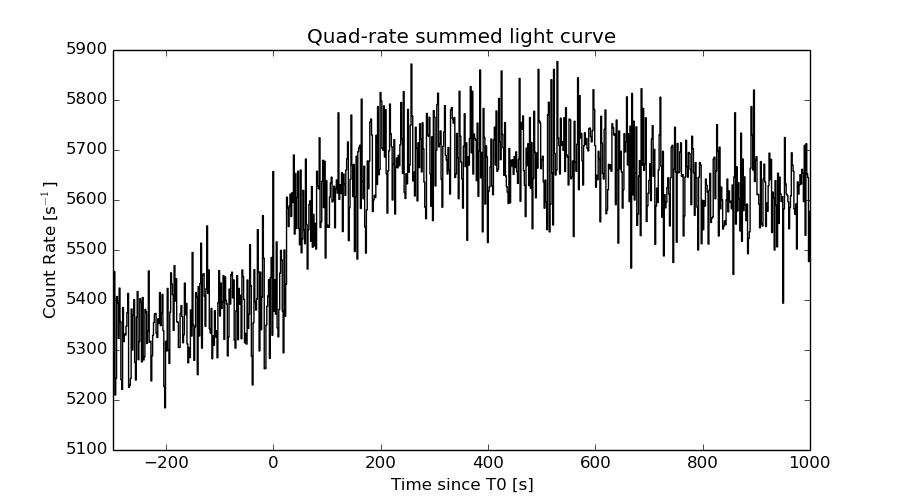
Quad-rate summed light curves (from T0-300s to T0+1000s)
Spectral Evolution
Spectra
Notes:
- 1) The fitting includes the systematic errors.
- 2) When the burst includes telescope slew time periods, the fitting uses an average response file made from multiple 5-s response files through out the slew time plus single time preiod for the non-slew times, and weighted by the total counts in the corresponding time period using addrmf. An average response file is needed becuase a spectral fit using the pre-slew DRM will introduce some errors in both a spectral shape and a normalization if the PHA file contains a lot of the slew/post-slew time interval.
- 3) For fits to more complicated models (e.g. a power-law over a cutoff power-law), the BAT team has decided to require a chi-square improvement of more than 6 for each extra dof.
Time averaged spectrum fit using the average DRM
Power-law model
Time interval is from   -0.024 sec. to    0.296 sec.

Spectral model in power-law:
------------------------------------------------------------
Parameters  : value       lower 90%   higher 90%
Photon index: 1.89057     ( -0.30734   0.340045 )
Norm@50keV  : 1.02394E-02    ( -0.00247323   0.00241023 )
------------------------------------------------------------
#Fit statistic : Chi-Squared =          66.51 using 59 PHA bins.
# Reduced chi-squared =          1.167 for     57 degrees of freedom
# Null hypothesis probability =   1.822481e-01

Photon flux (15-150 keV)    in 0.32 sec: 1.46363 ( -0.291781  0.291785 ) ph/cm2/s
Energy fluence (15-150 keV)             : 3.01173e-08 ( -7.01238e-09  7.24653e-09 ) ergs/cm2
Cutoff power-law model
Time interval is from   -0.024 sec. to    0.296 sec.
Spectral model in the cutoff power-law:
------------------------------------------------------------
Parameters  : value       lower 90%   higher 90%
Photon index: -0.484079     ( -2.74615   1.67998 )
Epeak [keV] : 44.5729      ( -8.92008 16.0482 )
Norm@50keV  : 0.229200    ( -0.231068   9.10047 )
------------------------------------------------------------
#Fit statistic : Chi-Squared =          59.78 using 59 PHA bins.
# Reduced chi-squared =          1.068 for     56 degrees of freedom
# Null hypothesis probability =   3.400234e-01

Photon flux (15-150 keV)    in 0.32 sec: 1.41208 ( -0.28991  0.29148 ) ph/cm2/s
Energy fluence (15-150 keV)             : 2.68158e-08 ( -6.29606e-09  7.15958e-09 ) ergs/cm2
Band function

Time interval is from   -0.024 sec. to    0.296 sec.

Spectral model in the Band function:
------------------------------------------------------------
Parameters  : value       lower 90%   higher 90%
alpha       : 0.460364   ( -1.29939   4.81231 )
beta        : -10.0000    ( 10   2.84217e-14 )
Epeak [keV] : 44.5659      ( -8.98581 16.0866 )
Norm@50keV   : 0.222863    ( -0.222747   9.11275 )
------------------------------------------------------------
#Fit statistic : Chi-Squared =          59.78 using 59 PHA bins.
# Reduced chi-squared =          1.087 for     55 degrees of freedom
# Null hypothesis probability =   3.061903e-01

Photon flux (15-150 keV)    in 0.32 sec: 1.42901 ( 5.57099  -0.30934 ) ph/cm2/s
Energy fluence (15-150 keV)             : 0 ( 0  0 ) ergs/cm2
Single BB

Spectral model blackbody:
------------------------------------------------------------
Parameters  : value    Lower 90%  Upper 90%
kT [keV]    : 11.0677  (-1.87427  2.32358)
R^2/D10^2   : 0.526757  (-0.272667   0.522857)
(R is the radius in km and D10 is the distance to the source in units of 10 kpc)
------------------------------------------------------------
#Fit statistic : Chi-Squared =          60.36 using 59 PHA bins.
# Reduced chi-squared =          1.059 for     57 degrees of freedom
# Null hypothesis probability =   3.554661e-01

Energy  Fluence     90% Error
[keV]   [erg/cm2]   [erg/cm2]
15- 25  4.319e-09   1.574e-09
25- 50  1.231e-08   3.432e-09
50-150  8.558e-09   4.060e-09
15-150  2.519e-08   7.003e-09
Thermal bremsstrahlung (OTTB)
Spectral model: thermal bremsstrahlung
------------------------------------------------------------
Parameters  : value         Lower 90%    Upper 90%
kT [keV]    : 75.0102       (-30.3165      72.9775)
Norm        : 7.26247       (-1.96855     2.26915)
------------------------------------------------------------
#Fit statistic : Chi-Squared =          62.97 using 59 PHA bins.
# Reduced chi-squared =          1.105 for     57 degrees of freedom
# Null hypothesis probability =   2.735000e-01

Energy  Fluence     90% Error
[keV]   [erg/cm2]   [erg/cm2]
15- 25  6.002e-09   1.600e-09
25- 50  9.724e-09   2.936e-09
50-150  1.313e-08   9.932e-09
15-150  2.886e-08   1.048e-08
Double BB
------------------------------------------------------------
Parameters  : value         Lower 90%    Upper 90%
kT1 [keV]   : 1.90302        (-5.86418      -5.86418)
R1^2/D10^2  : 381.261        (      )
kT2 [keV]   : 11.5090        (-2.10405      -11.5083)
R2^2/D10^2  : 0.442860    (-0.443475   0.523436)
------------------------------------------------------------
#Fit statistic : Chi-Squared =          59.77 using 59 PHA bins.
#Fit statistic : Chi-Squared =          59.75 using 59 PHA bins.
# Reduced chi-squared =          1.087 for     55 degrees of freedom
# Reduced chi-squared =          1.086 for     55 degrees of freedom
# Null hypothesis probability =   3.064772e-01
# Null hypothesis probability =   3.071248e-01

Energy  Fluence     90% Error
[keV]   [erg/cm2]   [erg/cm2]
15- 25  4.900e-09   2.734e-09
25- 50  1.148e-08   6.395e-09
50-150  1.016e-08   6.035e-09
15-150  2.654e-08   1.521e-08
Peak spectrum fit
Power-law model

Time interval is from   -0.332 sec. to    0.668 sec.

Spectral model in power-law:
------------------------------------------------------------
Parameters  : value       lower 90%   higher 90%
Photon index: 1.81491     ( -0.482947   0.561778 )
Norm@50keV  : 3.61151E-03    ( -0.00132002   0.00125856 )
------------------------------------------------------------
#Fit statistic : Chi-Squared =          67.41 using 59 PHA bins.
# Reduced chi-squared =          1.183 for     57 degrees of freedom
# Null hypothesis probability =   1.627446e-01

Photon flux (15-150 keV)    in 1 sec: 0.500563 ( -0.149468  0.149471 ) ph/cm2/s
Energy fluence (15-150 keV)             : 3.32342e-08 ( -1.16924e-08  1.23188e-08 ) ergs/cm2
Cutoff power-law model
Time interval is from   -0.332 sec. to    0.668 sec.
Spectral model in the cutoff power-law:
------------------------------------------------------------
Parameters  : value       lower 90%   higher 90%
Photon index: -0.302814     ( -5.46871   2.47795 )
Epeak [keV] : 48.1480      ( -48.129 -48.129 )
Norm@50keV  : 5.30401E-02    ( -0.0546393   42.1494 )
------------------------------------------------------------
#Fit statistic : Chi-Squared =          65.41 using 59 PHA bins.
# Reduced chi-squared =          1.168 for     56 degrees of freedom
# Null hypothesis probability =   1.824672e-01

Photon flux (15-150 keV)    in 1 sec: 0.474331 ( -0.155438  0.153299 ) ph/cm2/s
Energy fluence (15-150 keV)             : 2.94599e-08 ( -1.10365e-08  1.26597e-08 ) ergs/cm2
Band function

Time interval is from   -0.332 sec. to    0.668 sec.

Spectral model in the Band function:
------------------------------------------------------------
Parameters  : value       lower 90%   higher 90%
alpha       : 0.141232   ( -1.81311   0.186895 )
beta        : -10.0000    ( 10   1.77636e-15 )
Epeak [keV] : 48.5363      ( -22.2174 55.7247 )
Norm@50keV   : 4.34496E-02    ( -0.0434455   14.9334 )
------------------------------------------------------------
#Fit statistic : Chi-Squared =          65.42 using 59 PHA bins.
# Reduced chi-squared =          1.189 for     55 degrees of freedom
# Null hypothesis probability =   1.587576e-01

Photon flux (15-150 keV)    in 1 sec: 0.477759 (    ) ph/cm2/s
Energy fluence (15-150 keV)             : 0 ( 0  0 ) ergs/cm2
Single BB
Spectral model blackbody:
------------------------------------------------------------
Parameters  : value    Lower 90%  Upper 90%
kT [keV]    : 11.9568  (-2.96695  4.0649)
R^2/D10^2   : 0.133640  (-0.133641   0.242584)
(R is the radius in km and D10 is the distance to the source in units of 10 kpc)
------------------------------------------------------------
#Fit statistic : Chi-Squared =          65.61 using 59 PHA bins.
# Reduced chi-squared =          1.151 for     57 degrees of freedom
# Null hypothesis probability =   2.030636e-01

Energy  Fluence     90% Error
[keV]   [erg/cm2]   [erg/cm2]
15- 25  4.040e-09   2.502e-09
25- 50  1.266e-08   7.480e-09
50-150  1.086e-08   6.963e-09
15-150  2.756e-08   1.639e-08
Thermal bremsstrahlung (OTTB)
Spectral model: thermal bremsstrahlung
------------------------------------------------------------
Parameters  : value         Lower 90%    Upper 90%
kT [keV]    : 87.9480       (-49.8857      -87.9822)
Norm        : 2.33602       (-0.777315     1.18994)
------------------------------------------------------------
#Fit statistic : Chi-Squared =          66.40 using 59 PHA bins.
# Reduced chi-squared =          1.165 for     57 degrees of freedom
# Null hypothesis probability =   1.847012e-01

Energy  Fluence     90% Error
[keV]   [erg/cm2]   [erg/cm2]
15- 25  6.091e-09   3.698e-09
25- 50  1.025e-08   6.255e-09
50-150  1.538e-08   1.312e-08
15-150  3.172e-08   2.319e-08
Double BB
Spectral model: bbodyrad<1> + bbodyrad<2>
------------------------------------------------------------
Parameters  : value         Lower 90%    Upper 90%
kT1 [keV]   : 2.10512        (-2.07087      22.2043)
R1^2/D10^2  : 126.286        (-137.428      -137.428)
kT2 [keV]   : 12.9818        (-3.47953      -12.9701)
R2^2/D10^2  : 9.31273E-02    (-0.0934752   0.206027)
------------------------------------------------------------
#Fit statistic : Chi-Squared =          64.27 using 59 PHA bins.
# Reduced chi-squared =          1.168 for     55 degrees of freedom
# Null hypothesis probability =   1.837902e-01

Energy  Fluence     90% Error
[keV]   [erg/cm2]   [erg/cm2]
15- 25  5.132e-09   2.402e-09
25- 50  1.151e-08   6.865e-09
50-150  1.219e-08   8.280e-09
15-150  2.883e-08   1.749e-08
Pre-slew spectrum (Pre-slew PHA with pre-slew DRM)
Power-law model

Spectral model in power-law:
------------------------------------------------------------
Parameters  : value       lower 90%   higher 90%
Photon index: 1.89057     ( -0.30734   0.340045 )
Norm@50keV  : 1.02394E-02    ( -0.00247323   0.00241023 )
------------------------------------------------------------
#Fit statistic : Chi-Squared =          66.51 using 59 PHA bins.
# Reduced chi-squared =          1.167 for     57 degrees of freedom
# Null hypothesis probability =   1.822481e-01

Photon flux (15-150 keV)    in 0.32 sec: 1.46363 ( -0.291781  0.291785 ) ph/cm2/s
Energy fluence (15-150 keV)             : 3.01173e-08 ( -7.01238e-09  7.24653e-09 ) ergs/cm2
Cutoff power-law model

Spectral model in the cutoff power-law:
------------------------------------------------------------
Parameters  : value       lower 90%   higher 90%
Photon index: -0.484079     ( -2.74615   1.67998 )
Epeak [keV] : 44.5729      ( -8.92008 16.0482 )
Norm@50keV  : 0.229200    ( -0.231068   9.10047 )
------------------------------------------------------------
#Fit statistic : Chi-Squared =          59.78 using 59 PHA bins.
# Reduced chi-squared =          1.068 for     56 degrees of freedom
# Null hypothesis probability =   3.400234e-01

Photon flux (15-150 keV)    in 0.32 sec: 1.41208 ( -0.28991  0.29148 ) ph/cm2/s
Energy fluence (15-150 keV)             : 2.68158e-08 ( -6.29606e-09  7.15958e-09 ) ergs/cm2
Band function

Spectral model in the Band function:
------------------------------------------------------------
Parameters  : value       lower 90%   higher 90%
alpha       : 0.460364   ( -1.29939   4.81231 )
beta        : -10.0000    ( 10   1.77636e-15 )
Epeak [keV] : 44.5659      ( -8.98581 16.0866 )
Norm@50keV   : 0.222863    ( -0.222747   9.11275 )
------------------------------------------------------------
#Fit statistic : Chi-Squared =          59.78 using 59 PHA bins.
# Reduced chi-squared =          1.087 for     55 degrees of freedom
# Null hypothesis probability =   3.061903e-01

Photon flux (15-150 keV)    in 0.32 sec: 1.42901 ( 5.57099  -0.30934 ) ph/cm2/s
Energy fluence (15-150 keV)             : 0 ( 0  0 ) ergs/cm2
S(25-50 keV) vs. S(50-100 keV) plot

S(25-50 keV)  = 8.76e-09
S(50-100 keV) = 9.45e-09
T90 vs. Hardness ratio plot
T90                                   = 0.25600004196167 sec.
Hardness ratio (energy fluence ratio) = 1.07877
Color vs. Color plot
Count Ratio  (25-50 keV) / (15-25 keV) = 1.27924
Count Ratio (50-100 keV) / (15-25 keV) = 0.708353
Mask shadow pattern
IMX = 3.166435238837305E-01, IMY = -2.716794441283923E-01
TIME vs. PHA plot around the trigger time
Blue+Cyan dotted lines: Time interval of the scaled map
From 0.000000 to 0.128000
TIME vs. DetID plot around the trigger time

Blue+Cyan dotted lines: Time interval of the scaled map
From 0.000000 to 0.128000
100 us light curve (15-350 keV)
Blue+Cyan dotted lines: Time interval of the scaled map
From 0.000000 to 0.128000
Spacecraft aspect plot
Bright source in the pre-burst/pre-slew/post-slew images
Pre-burst image of 15-350 keV band
Time interval of the image:
-315.915400 -300.722100
-239.816000 -0.024000

# RAcent  DECcent POSerr Theta    Phi  PeakCts   SNR AngSep     Name
#  [deg]    [deg]    ['] [deg]  [deg]                   [']
254.4156  35.4933   13.0  27.0   44.3   0.2238   0.9    9.3	Her X-1
299.5405  35.1397   11.0  51.0   -2.2  -0.4768  -1.0    4.4	Cyg X-1
308.1004  40.7658   11.7  51.5  -13.5   0.4930   1.0   11.2	Cyg X-3
187.3352  18.4573    3.0  49.0  151.4   3.1659   3.9 ------	UNKNOWN
157.9231  25.8009    2.6  58.4 -175.4   5.6920   4.4 ------	UNKNOWN
193.1117  76.1255    2.0  23.7 -105.8   1.2960   5.7 ------	UNKNOWN
323.9738  43.3958    3.6  57.6  -26.3   3.9030   3.2 ------	UNKNOWN
Pre-slew background subtracted image of 15-350 keV band
Time interval of the image:
-0.024000 0.296000

# RAcent  DECcent POSerr Theta    Phi  PeakCts   SNR AngSep     Name
#  [deg]    [deg]    ['] [deg]  [deg]                   [']
254.5399  35.2814    5.4  27.2   44.3   0.0183   2.1    5.4	Her X-1
299.6265  35.1397    4.1  51.0   -2.3  -0.0442  -2.8    4.1	Cyg X-1
307.9342  41.0150   26.2  51.2  -13.6  -0.0064  -0.4    8.8	Cyg X-3
201.3914  32.4282    2.4  30.5  145.0   0.0407   4.8 ------	UNKNOWN
252.9753  39.9625    1.5  22.6   40.6   0.0566   7.8 ------	UNKNOWN
291.9644  51.6983    2.1  36.0  -15.4   0.0431   5.6 ------	UNKNOWN
128.6122  63.4394    2.0  45.6 -123.3   0.1498   5.8 ------	UNKNOWN
Post-slew image of 15-350 keV band
Time interval of the image:
63.084600 962.277200

# RAcent  DECcent POSerr Theta    Phi  PeakCts   SNR AngSep     Name
#  [deg]    [deg]    ['] [deg]  [deg]                   [']
254.4557  35.3442   33.3   4.7   54.7   0.1897   0.3    0.1	Her X-1
268.4179  -1.6061    0.0  43.9   46.8   0.4092   0.2    9.7	SW J1753.5-0127
288.8032  10.9367    1.3  42.9   11.8   8.2479   9.0    0.6	GRS 1915+105
299.5882  35.1957    0.3  36.8  -28.5  29.9685  38.0    0.4	Cyg X-1
308.0853  40.9685    2.5  41.2  -40.7   4.7256   4.5    1.5	Cyg X-3
296.4533   0.6373    3.4  55.7   12.9  13.0637   3.4 ------	UNKNOWN
274.2783  12.7944    2.5  33.0   28.7   3.4745   4.5 ------	UNKNOWN
290.0202  23.7545    4.6  35.0   -4.5   1.7898   2.5 ------	UNKNOWN
251.6327  53.5484    2.3  13.7 -114.1   2.8699   5.1 ------	UNKNOWN
163.3687  62.2552    9.7  55.2 -145.2   5.5924   1.2 ------	UNKNOWN
Plot creation:
Sat May 30 13:31:03 EDT 2015