Special notes of this burst
Image
Pre-slew 15.0-350.0 keV image (Event data)
#   RAcent    DECcent   POSerr    Theta     Phi              Peak Cts       SNR   Name
  320.1762    67.5870   0.0073    30.2645  -123.5849         1.5601485     26.263 TRIG_00599546

Foreground time interval of the image:
  0.152  11.452 (delta_t =  11.300 [sec])
Background time interval of the image:
-34.227   0.152 (delta_t =  34.379 [sec])
Lightcurves
Notes:
- 1) The mask-weighted light curves are using the flight position.
- 2) Multiple plots of different time binning/intervals are shown to cover all scenarios of short/long GRBs, rate/image triggers, and real/false positives.
- 3) For all the mask-weighted lightcurves, the y-axis units are counts/sec/det where a det is 0.4 x 0.4 = 0.16 sq cm.
- 4) The verticle lines correspond to following: green dotted lines are T50 interval, black dotted lines are T90 interval, blue solid line(s) is a spacecraft slew start time, and orange solid line(s) is a spacecraft slew end time.
- 5) Time of each bin is in the middle of the bin.
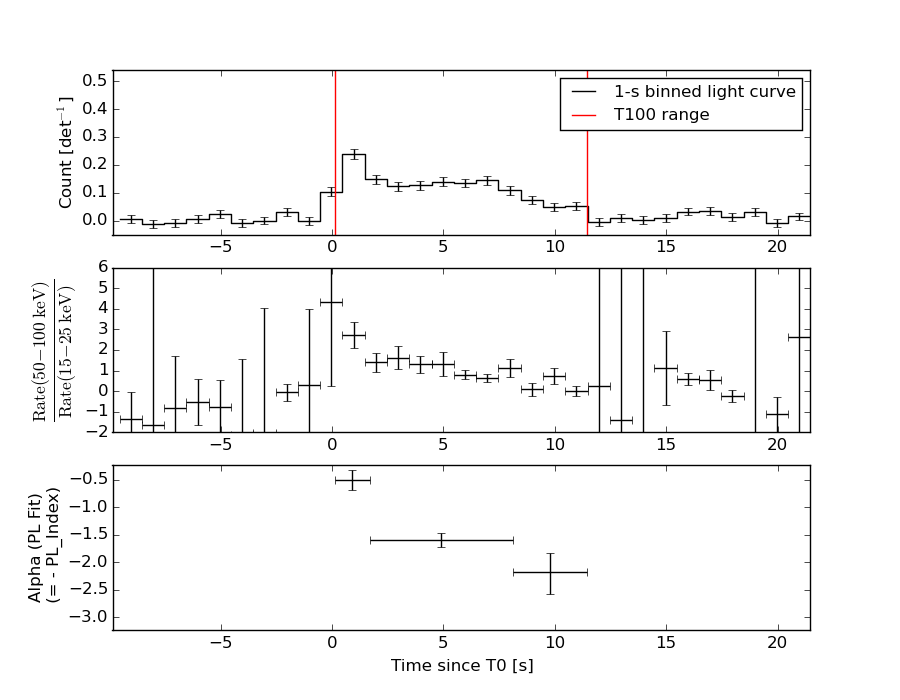
1 s binning
From T0-310 s to T0+310 s
From T100_start - 20 s to T100_end + 30 s
Full time interval
64 ms binning
Full time interval
From T100_start to T100_end
From T0-5 sec to T0+5 sec
16 ms binning
From T100_start-5 s to T100_start+5 s
Blue+Cyan dotted lines: Time interval of the scaled map
From 0.000000 to 0.512000
8 ms binning
From T100_start-3 s to T100_start+3 s
Blue+Cyan dotted lines: Time interval of the scaled map
From 0.000000 to 0.512000
2 ms binning
From T100_start-1 s to T100_start+1 s
Blue+Cyan dotted lines: Time interval of the scaled map
From 0.000000 to 0.512000
SN=5 or 10 sec. binning (whichever binning is satisfied first)
SN=5 or 10 sec. binning (T < 200 sec)
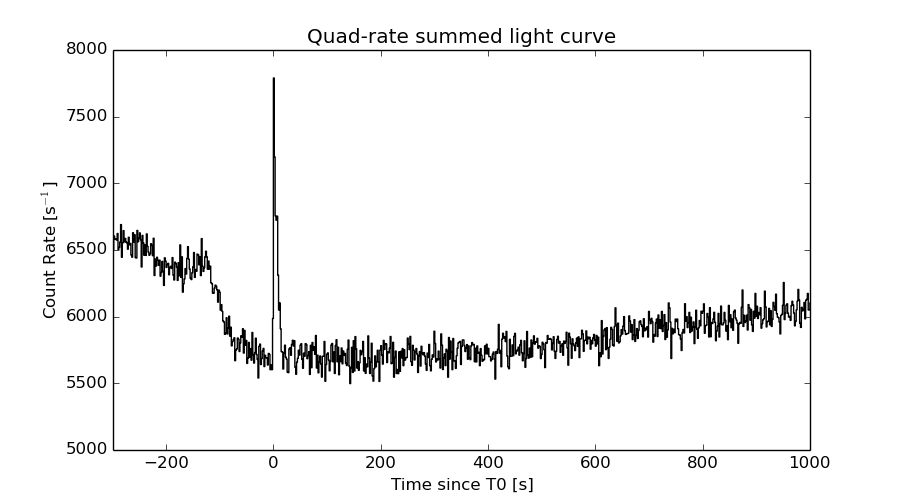
Quad-rate summed light curves (from T0-300s to T0+1000s)
Spectral Evolution
Spectra
Notes:
- 1) The fitting includes the systematic errors.
- 2) When the burst includes telescope slew time periods, the fitting uses an average response file made from multiple 5-s response files through out the slew time plus single time preiod for the non-slew times, and weighted by the total counts in the corresponding time period using addrmf. An average response file is needed becuase a spectral fit using the pre-slew DRM will introduce some errors in both a spectral shape and a normalization if the PHA file contains a lot of the slew/post-slew time interval.
- 3) For fits to more complicated models (e.g. a power-law over a cutoff power-law), the BAT team has decided to require a chi-square improvement of more than 6 for each extra dof.
Time averaged spectrum fit using the average DRM
Power-law model

Time interval is from    0.152 sec. to   11.452 sec.

Spectral model in power-law:
------------------------------------------------------------
Parameters  : value       lower 90%   higher 90%
Photon index: 1.42849     ( -0.109397   0.109304 )
Norm@50keV  : 8.63625E-03    ( -0.000530335   0.000529404 )
------------------------------------------------------------
#Fit statistic : Chi-Squared =          50.80 using 59 PHA bins.
# Reduced chi-squared =         0.8912 for     57 degrees of freedom
# Null hypothesis probability =   7.054513e-01

Photon flux (15-150 keV)    in 11.3 sec: 1.05874 ( -0.0673032  0.0674641 ) ph/cm2/s
Energy fluence (15-150 keV)             : 9.37655e-07 ( -6.29077e-08  6.32927e-08 ) ergs/cm2
Cutoff power-law model

Time interval is from    0.152 sec. to   11.452 sec.
Spectral model in the cutoff power-law:
------------------------------------------------------------
Parameters  : value       lower 90%   higher 90%
Photon index: 1.42549     ( -0.363106   0.136696 )
Epeak [keV] : 9999.05      (   )
Norm@50keV  : 8.66601E-03    ( -0.000532368   0.00462162 )
------------------------------------------------------------
#Fit statistic : Chi-Squared =          50.80 using 59 PHA bins.
# Reduced chi-squared =         0.9072 for     56 degrees of freedom
# Null hypothesis probability =   6.713921e-01

Photon flux (15-150 keV)    in 11.3 sec: 1.05853 ( -0.06666  0.06683 ) ph/cm2/s
Energy fluence (15-150 keV)             : 9.37564e-07 ( -6.60948e-08  6.30563e-08 ) ergs/cm2
Band function

Time interval is from    0.152 sec. to   11.452 sec.

Spectral model in the Band function:
------------------------------------------------------------
Parameters  : value       lower 90%   higher 90%
alpha       : 0.405721   ( -3.39823   -3.39823 )
beta        : -1.48233    ( -0.150197   0.133965 )
Epeak [keV] : 35.1972      ( -35.0537 136.561 )
Norm@50keV   : 0.177456    ( -0.185509   351.341 )
------------------------------------------------------------
#Fit statistic : Chi-Squared =          49.62 using 59 PHA bins.
# Reduced chi-squared =         0.9021 for     55 degrees of freedom
# Null hypothesis probability =   6.797216e-01

Photon flux (15-150 keV)    in 11.3 sec:  (    ) ph/cm2/s
Energy fluence (15-150 keV)             : 0 ( 0  0 ) ergs/cm2
Single BB
Spectral model blackbody:
------------------------------------------------------------
Parameters  : value    Lower 90%  Upper 90%
kT [keV]    : 16.3179  (  )
R^2/D10^2   : 8.87813E-02  (   )
(R is the radius in km and D10 is the distance to the source in units of 10 kpc)
------------------------------------------------------------
#Fit statistic : Chi-Squared =         128.27 using 59 PHA bins.
# Reduced chi-squared =         2.2504 for     57 degrees of freedom
# Null hypothesis probability =   2.077588e-07

Energy  Fluence     90% Error
[keV]   [erg/cm2]   [erg/cm2]
15- 25  5.498e-08   6.774e-09
25- 50  2.353e-07   2.102e-08
50-150  4.411e-07   4.882e-08
15-150  7.313e-07   5.531e-08
Thermal bremsstrahlung (OTTB)
Spectral model: thermal bremsstrahlung
------------------------------------------------------------
Parameters  : value         Lower 90%    Upper 90%
kT [keV]    : 200.000       (      )
Norm        : 4.37307       (-0.267236     0.267214)
------------------------------------------------------------
#Fit statistic : Chi-Squared =          56.46 using 59 PHA bins.
# Reduced chi-squared =         0.9906 for     57 degrees of freedom
# Null hypothesis probability =   4.951195e-01

Energy  Fluence     90% Error
[keV]   [erg/cm2]   [erg/cm2]
15- 25  1.231e-07   8.588e-09
25- 50  2.368e-07   1.927e-08
50-150  5.192e-07   1.118e-07
15-150  8.791e-07   1.335e-07
Double BB
Spectral model: bbodyrad<1> + bbodyrad<2>
------------------------------------------------------------
Parameters  : value         Lower 90%    Upper 90%
kT1 [keV]   : 7.35000        (-1.24724      1.46404)
R1^2/D10^2  : 0.962203        (-0.434084      0.877287)
kT2 [keV]   : 31.7923        (-6.02793      11.1603)
R2^2/D10^2  : 7.57462E-03    (-0.00459662   0.00791425)
------------------------------------------------------------
#Fit statistic : Chi-Squared =          49.59 using 59 PHA bins.
# Reduced chi-squared =         0.9017 for     55 degrees of freedom
# Null hypothesis probability =   6.806362e-01

Energy  Fluence     90% Error
[keV]   [erg/cm2]   [erg/cm2]
15- 25  1.120e-07   2.462e-08
25- 50  2.311e-07   3.836e-08
50-150  6.030e-07   1.596e-07
15-150  9.462e-07   2.300e-07
Peak spectrum fit
Power-law model

Time interval is from    0.644 sec. to    1.644 sec.

Spectral model in power-law:
------------------------------------------------------------
Parameters  : value       lower 90%   higher 90%
Photon index: 0.670469     ( -0.224942   0.212756 )
Norm@50keV  : 1.62315E-02    ( -0.00209424   0.00203134 )
------------------------------------------------------------
#Fit statistic : Chi-Squared =          47.19 using 59 PHA bins.
# Reduced chi-squared =         0.8278 for     57 degrees of freedom
# Null hypothesis probability =   8.198001e-01

Photon flux (15-150 keV)    in 1 sec: 1.88093 ( -0.221375  0.222446 ) ph/cm2/s
Energy fluence (15-150 keV)             : 2.00808e-07 ( -2.31016e-08  2.31655e-08 ) ergs/cm2
Cutoff power-law model

Time interval is from    0.644 sec. to    1.644 sec.
Spectral model in the cutoff power-law:
------------------------------------------------------------
Parameters  : value       lower 90%   higher 90%
Photon index: 0.668556     ( -0.233325   0.20952 )
Epeak [keV] : 9999.36      ( -9999.36 -9999.36 )
Norm@50keV  : 1.63793E-02    ( -0.00210748   0.0137464 )
------------------------------------------------------------
#Fit statistic : Chi-Squared =          47.20 using 59 PHA bins.
# Reduced chi-squared =         0.8429 for     56 degrees of freedom
# Null hypothesis probability =   7.926361e-01

Photon flux (15-150 keV)    in 1 sec: 1.88391 ( -0.22424  0.21709 ) ph/cm2/s
Energy fluence (15-150 keV)             : 2.00766e-07 ( -2.2998e-08  2.3232e-08 ) ergs/cm2
Band function
Time interval is from    0.644 sec. to    1.644 sec.

Spectral model in the Band function:
------------------------------------------------------------
Parameters  : value       lower 90%   higher 90%
alpha       : -0.954551   ( 0.954551   0.954551 )
beta        : -0.670467    ( -0.21281   0.225313 )
Epeak [keV] : 12.6389      ( -12.6389 -12.6389 )
Norm@50keV   : 2.43677E-02    ( -0.0104433   204683 )
------------------------------------------------------------
#Fit statistic : Chi-Squared =          47.19 using 59 PHA bins.
# Reduced chi-squared =         0.8579 for     55 degrees of freedom
# Null hypothesis probability =   7.640079e-01

Photon flux (15-150 keV)    in 1 sec:  (    ) ph/cm2/s
Energy fluence (15-150 keV)             : 0 ( 0  0 ) ergs/cm2
Single BB
Spectral model blackbody:
------------------------------------------------------------
Parameters  : value    Lower 90%  Upper 90%
kT [keV]    : 32.7060  (-5.07504  6.95372)
R^2/D10^2   : 2.28629E-02  (-0.00927042   0.0139866)
(R is the radius in km and D10 is the distance to the source in units of 10 kpc)
------------------------------------------------------------
#Fit statistic : Chi-Squared =          56.32 using 59 PHA bins.
# Reduced chi-squared =         0.9881 for     57 degrees of freedom
# Null hypothesis probability =   5.005220e-01

Energy  Fluence     90% Error
[keV]   [erg/cm2]   [erg/cm2]
15- 25  3.622e-09   9.675e-10
25- 50  2.311e-08   4.495e-09
50-150  1.680e-07   3.070e-08
15-150  1.947e-07   3.225e-08
Thermal bremsstrahlung (OTTB)
Spectral model: thermal bremsstrahlung
------------------------------------------------------------
Parameters  : value         Lower 90%    Upper 90%
kT [keV]    : 200.000       (      )
Norm        : 7.49795       (-0.925638     0.925583)
------------------------------------------------------------
#Fit statistic : Chi-Squared =          95.26 using 59 PHA bins.
# Reduced chi-squared =          1.671 for     57 degrees of freedom
# Null hypothesis probability =   1.115536e-03

Energy  Fluence     90% Error
[keV]   [erg/cm2]   [erg/cm2]
15- 25  1.868e-08   1.047e-08
25- 50  3.592e-08   1.985e-08
50-150  7.879e-08   4.334e-08
15-150  1.334e-07   7.365e-08
Double BB
Spectral model: bbodyrad<1> + bbodyrad<2>
------------------------------------------------------------
Parameters  : value         Lower 90%    Upper 90%
kT1 [keV]   : 4.18689        (-1.50104      2.52182)
R1^2/D10^2  : 9.57982        (-8.38631      89.7039)
kT2 [keV]   : 37.9059        (-6.82784      10.9033)
R2^2/D10^2  : 1.47117E-02    (-0.00706396   0.0107748)
------------------------------------------------------------
#Fit statistic : Chi-Squared =          41.30 using 59 PHA bins.
# Reduced chi-squared =         0.7509 for     55 degrees of freedom
# Null hypothesis probability =   9.144878e-01

Energy  Fluence     90% Error
[keV]   [erg/cm2]   [erg/cm2]
15- 25  1.366e-08   7.238e-09
25- 50  2.346e-08   6.485e-09
50-150  1.699e-07   4.420e-08
15-150  2.070e-07   4.935e-08
Pre-slew spectrum (Pre-slew PHA with pre-slew DRM)
Power-law model
Spectral model in power-law:
------------------------------------------------------------
Parameters  : value       lower 90%   higher 90%
Photon index: 1.42849     ( -0.109397   0.109304 )
Norm@50keV  : 8.63625E-03    ( -0.000530335   0.000529404 )
------------------------------------------------------------
#Fit statistic : Chi-Squared =          50.80 using 59 PHA bins.
# Reduced chi-squared =         0.8912 for     57 degrees of freedom
# Null hypothesis probability =   7.054513e-01

Photon flux (15-150 keV)    in 11.3 sec: 1.05874 ( -0.0673032  0.0674641 ) ph/cm2/s
Energy fluence (15-150 keV)             : 9.37655e-07 ( -6.29077e-08  6.32927e-08 ) ergs/cm2
Cutoff power-law model

Spectral model in the cutoff power-law:
------------------------------------------------------------
Parameters  : value       lower 90%   higher 90%
Photon index: 1.42549     ( -0.363106   0.136696 )
Epeak [keV] : 9999.05      (   )
Norm@50keV  : 8.66601E-03    ( -0.000532368   0.00462162 )
------------------------------------------------------------
#Fit statistic : Chi-Squared =          50.80 using 59 PHA bins.
# Reduced chi-squared =         0.9072 for     56 degrees of freedom
# Null hypothesis probability =   6.713921e-01

Photon flux (15-150 keV)    in 11.3 sec: 1.05853 ( -0.06666  0.06683 ) ph/cm2/s
Energy fluence (15-150 keV)             : 9.37564e-07 ( -6.60948e-08  6.30563e-08 ) ergs/cm2
Band function
Spectral model in the Band function:
------------------------------------------------------------
Parameters  : value       lower 90%   higher 90%
alpha       : 0.405721   ( -3.39823   -3.39823 )
beta        : -1.48233    ( -0.150197   0.133965 )
Epeak [keV] : 35.1972      ( -35.0537 175.82 )
Norm@50keV   : 0.177456    ( -0.185509   419.549 )
------------------------------------------------------------
#Fit statistic : Chi-Squared =          49.62 using 59 PHA bins.
# Reduced chi-squared =         0.9021 for     55 degrees of freedom
# Null hypothesis probability =   6.797216e-01

Photon flux (15-150 keV)    in 11.3 sec:  (    ) ph/cm2/s
Energy fluence (15-150 keV)             : 0 ( 0  0 ) ergs/cm2
S(25-50 keV) vs. S(50-100 keV) plot

S(25-50 keV)  = 2.24e-07
S(50-100 keV) = 3.32e-07
T90 vs. Hardness ratio plot
T90                                   = 9.87599992752075 sec.
Hardness ratio (energy fluence ratio) = 1.48214
Color vs. Color plot
Count Ratio  (25-50 keV) / (15-25 keV) = 1.47693
Count Ratio (50-100 keV) / (15-25 keV) = 1.19783
Mask shadow pattern
IMX = -3.227881382640286E-01, IMY = 4.861139331290731E-01
TIME vs. PHA plot around the trigger time
Blue+Cyan dotted lines: Time interval of the scaled map
From 0.000000 to 0.512000
TIME vs. DetID plot around the trigger time
Blue+Cyan dotted lines: Time interval of the scaled map
From 0.000000 to 0.512000
100 us light curve (15-350 keV)
Blue+Cyan dotted lines: Time interval of the scaled map
From 0.000000 to 0.512000
Spacecraft aspect plot
Bright source in the pre-burst/pre-slew/post-slew images
Pre-burst image of 15-350 keV band
Time interval of the image:
-34.227410 0.152000

# RAcent  DECcent POSerr Theta    Phi  PeakCts   SNR AngSep     Name
#  [deg]    [deg]    ['] [deg]  [deg]                   [']
254.2506  35.3140   10.8  29.7  125.6   0.1046   1.1   10.3	Her X-1
288.8186  10.9205    1.9  30.7   40.7   0.5337   6.0    1.9	GRS 1915+105
299.6104  35.2127    0.6   8.9  -11.9   1.1809  20.3    1.2	Cyg X-1
308.1387  40.9587    4.6  12.4  -57.6   0.1571   2.5    1.3	Cyg X-3
326.0222  38.1519   99.0  26.4  -58.9   0.0088   0.1   12.4	Cyg X-2
214.8980  47.8984    2.2  52.6  160.1   1.5482   5.1 ------	UNKNOWN
Pre-slew background subtracted image of 15-350 keV band
Time interval of the image:
0.152000 11.452000

# RAcent  DECcent POSerr Theta    Phi  PeakCts   SNR AngSep     Name
#  [deg]    [deg]    ['] [deg]  [deg]                   [']
254.4557  35.5184    5.7  29.5  125.9  -0.1510  -2.0   10.6	Her X-1
288.8270  10.8794    5.0  30.7   40.7  -0.1404  -2.3    4.3	GRS 1915+105
299.3419  35.2550    9.3   8.7  -11.0   0.0524   1.2   12.6	Cyg X-1
307.9943  40.7821   22.1  12.3  -56.7   0.0226   0.5   11.5	Cyg X-3
326.3727  38.2672    5.2  26.6  -59.3  -0.1249  -2.2   10.0	Cyg X-2
320.1762  67.5870    0.4  30.3 -123.6   1.5602  26.3 ------	UNKNOWN
Post-slew image of 15-350 keV band
Time interval of the image:
Plot creation:
Sat May 30 13:27:36 EDT 2015