Special notes of this burst
Image
Pre-slew 15.0-350.0 keV image (Event data)
#   RAcent    DECcent   POSerr    Theta     Phi              Peak Cts       SNR   Name
  201.7989    37.5988   0.0224    17.4829   139.1656         0.0696343      8.613 TRIG_00600951

Foreground time interval of the image:
 -0.040   0.352 (delta_t =   0.392 [sec])
Background time interval of the image:
-87.899  -0.040 (delta_t =  87.859 [sec])
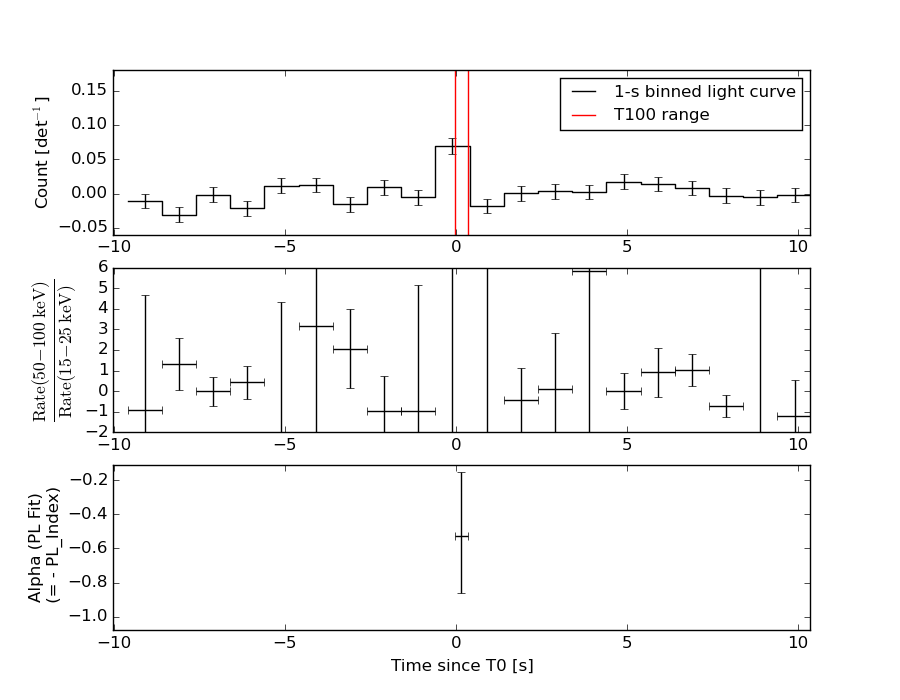
Lightcurves
Notes:
- 1) The mask-weighted light curves are using the flight position.
- 2) Multiple plots of different time binning/intervals are shown to cover all scenarios of short/long GRBs, rate/image triggers, and real/false positives.
- 3) For all the mask-weighted lightcurves, the y-axis units are counts/sec/det where a det is 0.4 x 0.4 = 0.16 sq cm.
- 4) The verticle lines correspond to following: green dotted lines are T50 interval, black dotted lines are T90 interval, blue solid line(s) is a spacecraft slew start time, and orange solid line(s) is a spacecraft slew end time.
- 5) Time of each bin is in the middle of the bin.
1 s binning
From T0-310 s to T0+310 s
From T100_start - 20 s to T100_end + 30 s

Full time interval
64 ms binning
Full time interval
From T100_start to T100_end
From T0-5 sec to T0+5 sec
16 ms binning
From T100_start-5 s to T100_start+5 s
Blue+Cyan dotted lines: Time interval of the scaled map
From 0.000000 to 0.128000
8 ms binning
From T100_start-3 s to T100_start+3 s
Blue+Cyan dotted lines: Time interval of the scaled map
From 0.000000 to 0.128000
2 ms binning
From T100_start-1 s to T100_start+1 s
Blue+Cyan dotted lines: Time interval of the scaled map
From 0.000000 to 0.128000
SN=5 or 10 sec. binning (whichever binning is satisfied first)
SN=5 or 10 sec. binning (T < 200 sec)
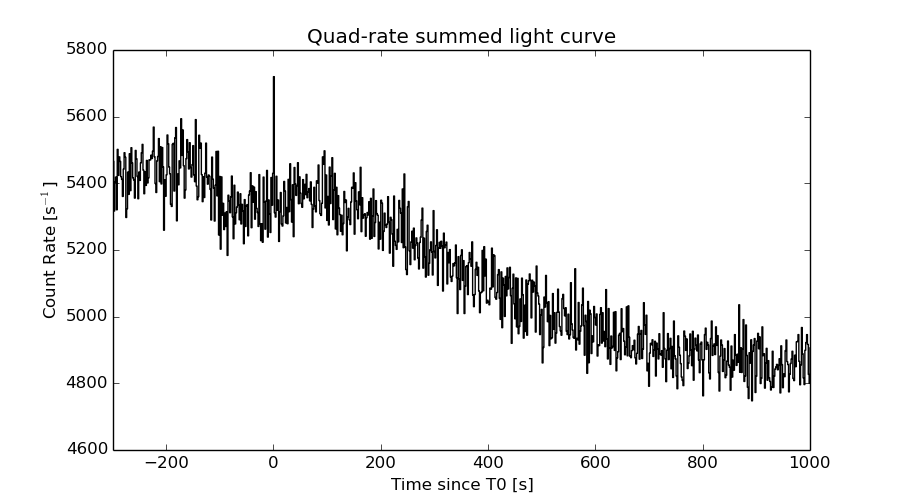
Quad-rate summed light curves (from T0-300s to T0+1000s)
Spectral Evolution
Spectra
Notes:
- 1) The fitting includes the systematic errors.
- 2) When the burst includes telescope slew time periods, the fitting uses an average response file made from multiple 5-s response files through out the slew time plus single time preiod for the non-slew times, and weighted by the total counts in the corresponding time period using addrmf. An average response file is needed becuase a spectral fit using the pre-slew DRM will introduce some errors in both a spectral shape and a normalization if the PHA file contains a lot of the slew/post-slew time interval.
- 3) For fits to more complicated models (e.g. a power-law over a cutoff power-law), the BAT team has decided to require a chi-square improvement of more than 6 for each extra dof.
Time averaged spectrum fit using the average DRM
Power-law model

Time interval is from   -0.040 sec. to    0.352 sec.

Spectral model in power-law:
------------------------------------------------------------
Parameters  : value       lower 90%   higher 90%
Photon index: 0.525033     ( -0.375533   0.337895 )
Norm@50keV  : 9.85348E-03    ( -0.00230442   0.00221817 )
------------------------------------------------------------
#Fit statistic : Chi-Squared =          65.37 using 59 PHA bins.
# Reduced chi-squared =          1.147 for     57 degrees of freedom
# Null hypothesis probability =   2.089210e-01

Photon flux (15-150 keV)    in 0.392 sec: 1.16240 ( -0.238018  0.239896 ) ph/cm2/s
Energy fluence (15-150 keV)             : 5.12434e-08 ( -1.03547e-08  1.03891e-08 ) ergs/cm2
Cutoff power-law model
Time interval is from   -0.040 sec. to    0.352 sec.
Spectral model in the cutoff power-law:
------------------------------------------------------------
Parameters  : value       lower 90%   higher 90%
Photon index: -1.04460     ( -2.98163   1.69169 )
Epeak [keV] : 134.488      ( -43.6445 -134.261 )
Norm@50keV  : 3.45684E-02    ( -0.035096   0.227518 )
------------------------------------------------------------
#Fit statistic : Chi-Squared =          63.13 using 59 PHA bins.
# Reduced chi-squared =          1.127 for     56 degrees of freedom
# Null hypothesis probability =   2.390300e-01

Photon flux (15-150 keV)    in 0.392 sec: 1.10566 ( -0.24261  0.24836 ) ph/cm2/s
Energy fluence (15-150 keV)             : 5.04872e-08 ( -1.09341e-08  1.07808e-08 ) ergs/cm2
Band function

Time interval is from   -0.040 sec. to    0.352 sec.

Spectral model in the Band function:
------------------------------------------------------------
Parameters  : value       lower 90%   higher 90%
alpha       : 1.06431   ( -0.581677   3.81088 )
beta        : -10.0000    ( 10   1.77636e-15 )
Epeak [keV] : 134.219      ( -32.7608 145.262 )
Norm@50keV   : 3.51053E-02    ( -0.0351051   0.227998 )
------------------------------------------------------------
#Fit statistic : Chi-Squared =          63.12 using 59 PHA bins.
# Reduced chi-squared =          1.148 for     55 degrees of freedom
# Null hypothesis probability =   2.111647e-01

Photon flux (15-150 keV)    in 0.392 sec:  (    ) ph/cm2/s
Energy fluence (15-150 keV)             : 0 ( 0  0 ) ergs/cm2
Single BB
Spectral model blackbody:
------------------------------------------------------------
Parameters  : value    Lower 90%  Upper 90%
kT [keV]    : 31.6983  (-7.05968  11.5324)
R^2/D10^2   : 1.65684E-02  (-0.00939053   0.0174338)
(R is the radius in km and D10 is the distance to the source in units of 10 kpc)
------------------------------------------------------------
#Fit statistic : Chi-Squared =          63.07 using 59 PHA bins.
# Reduced chi-squared =          1.107 for     57 degrees of freedom
# Null hypothesis probability =   2.704120e-01

Energy  Fluence     90% Error
[keV]   [erg/cm2]   [erg/cm2]
15- 25  9.863e-10   4.431e-10
25- 50  6.219e-09   2.634e-09
50-150  4.311e-08   1.757e-08
15-150  5.032e-08   1.941e-08
Thermal bremsstrahlung (OTTB)
Spectral model: thermal bremsstrahlung
------------------------------------------------------------
Parameters  : value         Lower 90%    Upper 90%
kT [keV]    : 200.000       (      )
Norm        : 4.22524       (-0.997233     0.99722)
------------------------------------------------------------
#Fit statistic : Chi-Squared =          88.09 using 59 PHA bins.
# Reduced chi-squared =          1.545 for     57 degrees of freedom
# Null hypothesis probability =   5.154307e-03

Energy  Fluence     90% Error
[keV]   [erg/cm2]   [erg/cm2]
15- 25  4.125e-09   2.489e-09
25- 50  7.936e-09   4.655e-09
50-150  1.740e-08   1.025e-08
15-150  2.947e-08   1.770e-08
Double BB
Spectral model: bbodyrad<1> + bbodyrad<2>
------------------------------------------------------------
Parameters  : value         Lower 90%    Upper 90%
kT1 [keV]   : 1.59974        (-2.33287      2.66438)
R1^2/D10^2  : 1023.52        (-63.7625      -63.7625)
kT2 [keV]   : 32.2738        (-7.4439      157.644)
R2^2/D10^2  : 1.56651E-02    (-0.00901348   0.0155977)
------------------------------------------------------------
#Fit statistic : Chi-Squared =          62.44 using 59 PHA bins.
# Reduced chi-squared =          1.135 for     55 degrees of freedom
# Null hypothesis probability =   2.288105e-01

Energy  Fluence     90% Error
[keV]   [erg/cm2]   [erg/cm2]
15- 25  1.379e-09   4.731e-10
25- 50  6.071e-09   2.835e-09
50-150  4.323e-08   2.090e-08
15-150  5.068e-08   2.250e-08
Peak spectrum fit
Power-law model
Time interval is from   -0.342 sec. to    0.658 sec.

Spectral model in power-law:
------------------------------------------------------------
Parameters  : value       lower 90%   higher 90%
Photon index: 0.126273     ( -0.624273   0.492691 )
Norm@50keV  : 3.59574E-03    ( -0.00142443   0.00135952 )
------------------------------------------------------------
#Fit statistic : Chi-Squared =          53.79 using 59 PHA bins.
# Reduced chi-squared =         0.9436 for     57 degrees of freedom
# Null hypothesis probability =   5.964388e-01

Photon flux (15-150 keV)    in 1 sec: 0.465460 ( -0.128898  0.132815 ) ph/cm2/s
Energy fluence (15-150 keV)             : 5.94057e-08 ( -1.48475e-08  1.48526e-08 ) ergs/cm2
Cutoff power-law model

Time interval is from   -0.342 sec. to    0.658 sec.
Spectral model in the cutoff power-law:
------------------------------------------------------------
Parameters  : value       lower 90%   higher 90%
Photon index: -1.29953     ( -4.45385   1.69965 )
Epeak [keV] : 175.197      ( -175.197 -175.197 )
Norm@50keV  : 9.77689E-03    ( -0.00977691   0.130891 )
------------------------------------------------------------
#Fit statistic : Chi-Squared =          52.94 using 59 PHA bins.
# Reduced chi-squared =         0.9453 for     56 degrees of freedom
# Null hypothesis probability =   5.915686e-01

Photon flux (15-150 keV)    in 1 sec: 0.451105 ( -0.123371  0.132907 ) ph/cm2/s
Energy fluence (15-150 keV)             : 5.93948e-08 ( -1.55891e-08  1.5202e-08 ) ergs/cm2
Band function

Time interval is from   -0.342 sec. to    0.658 sec.

Spectral model in the Band function:
------------------------------------------------------------
Parameters  : value       lower 90%   higher 90%
alpha       : -0.966701   ( 0.966701   0.966701 )
beta        : -0.126277    ( -0.493179   0.623642 )
Epeak [keV] : 15.6806      ( -15.6806 -15.6806 )
Norm@50keV   : 4.97008E-03    ( -0.00265772   0 )
------------------------------------------------------------
#Fit statistic : Chi-Squared =          53.79 using 59 PHA bins.
# Reduced chi-squared =         0.9779 for     55 degrees of freedom
# Null hypothesis probability =   5.211082e-01

Photon flux (15-150 keV)    in 1 sec:  (    ) ph/cm2/s
Energy fluence (15-150 keV)             : 0 ( 0  0 ) ergs/cm2
Single BB
Spectral model blackbody:
------------------------------------------------------------
Parameters  : value    Lower 90%  Upper 90%
kT [keV]    : 43.7861  (-14.7822  48.3631)
R^2/D10^2   : 3.12207E-03  (-0.00312207   0.00604846)
(R is the radius in km and D10 is the distance to the source in units of 10 kpc)
------------------------------------------------------------
#Fit statistic : Chi-Squared =          52.97 using 59 PHA bins.
# Reduced chi-squared =         0.9294 for     57 degrees of freedom
# Null hypothesis probability =   6.268076e-01

Energy  Fluence     90% Error
[keV]   [erg/cm2]   [erg/cm2]
15- 25  7.229e-10   4.420e-10
25- 50  5.057e-09   2.950e-09
50-150  5.377e-08   3.093e-08
15-150  5.955e-08   3.464e-08
Thermal bremsstrahlung (OTTB)
Spectral model: thermal bremsstrahlung
------------------------------------------------------------
Parameters  : value         Lower 90%    Upper 90%
kT [keV]    : 200.000       (      )
Norm        : 1.62486       (-0.57939     0.579365)
------------------------------------------------------------
#Fit statistic : Chi-Squared =          76.10 using 59 PHA bins.
# Reduced chi-squared =          1.335 for     57 degrees of freedom
# Null hypothesis probability =   4.633581e-02

Energy  Fluence     90% Error
[keV]   [erg/cm2]   [erg/cm2]
15- 25  4.044e-09   2.589e-09
25- 50  7.780e-09   5.015e-09
50-150  1.706e-08   1.101e-08
15-150  2.889e-08   1.925e-08
Double BB
------------------------------------------------------------
Parameters  : value         Lower 90%    Upper 90%
kT1 [keV]   : 27.2514        (      )
R1^2/D10^2  : 3.12853E-03        (-0.00309837      -0.00309837)
kT2 [keV]   : 56.7834        (-59.17      -59.17)
R2^2/D10^2  : 1.26604E-03    (-0.00104098   -0.00104098)
------------------------------------------------------------
#Fit statistic : Chi-Squared =          52.97 using 59 PHA bins.
#Fit statistic : Chi-Squared =          52.95 using 59 PHA bins.
# Reduced chi-squared =         0.9632 for     55 degrees of freedom
# Reduced chi-squared =         0.9628 for     55 degrees of freedom
# Null hypothesis probability =   5.523987e-01
# Null hypothesis probability =   5.532881e-01

Energy  Fluence     90% Error
[keV]   [erg/cm2]   [erg/cm2]
15- 25  0.000e+00   0.000e+00
25- 50  0.000e+00   0.000e+00
50-150  0.000e+00   0.000e+00
15-150  0.000e+00   0.000e+00
Pre-slew spectrum (Pre-slew PHA with pre-slew DRM)
Power-law model
Spectral model in power-law:
------------------------------------------------------------
Parameters  : value       lower 90%   higher 90%
Photon index: 0.525033     ( -0.375533   0.337895 )
Norm@50keV  : 9.85348E-03    ( -0.00230442   0.00221817 )
------------------------------------------------------------
#Fit statistic : Chi-Squared =          65.37 using 59 PHA bins.
# Reduced chi-squared =          1.147 for     57 degrees of freedom
# Null hypothesis probability =   2.089210e-01

Photon flux (15-150 keV)    in 0.392 sec: 1.16240 ( -0.238018  0.239896 ) ph/cm2/s
Energy fluence (15-150 keV)             : 5.12434e-08 ( -1.03547e-08  1.03891e-08 ) ergs/cm2
Cutoff power-law model

Spectral model in the cutoff power-law:
------------------------------------------------------------
Parameters  : value       lower 90%   higher 90%
Photon index: -1.04460     ( -2.98163   1.69169 )
Epeak [keV] : 134.488      ( -43.6445 -134.261 )
Norm@50keV  : 3.45684E-02    ( -0.035096   0.227518 )
------------------------------------------------------------
#Fit statistic : Chi-Squared =          63.13 using 59 PHA bins.
# Reduced chi-squared =          1.127 for     56 degrees of freedom
# Null hypothesis probability =   2.390300e-01

Photon flux (15-150 keV)    in 0.392 sec: 1.10566 ( -0.24261  0.24836 ) ph/cm2/s
Energy fluence (15-150 keV)             : 5.04872e-08 ( -1.09341e-08  1.07808e-08 ) ergs/cm2
Band function

Spectral model in the Band function:
------------------------------------------------------------
Parameters  : value       lower 90%   higher 90%
alpha       : 1.06431   ( -0.581677   3.81088 )
beta        : -10.0000    ( 10   20 )
Epeak [keV] : 134.219      ( -32.7608 145.262 )
Norm@50keV   : 3.51053E-02    ( -0.0351051   0.227998 )
------------------------------------------------------------
#Fit statistic : Chi-Squared =          63.12 using 59 PHA bins.
# Reduced chi-squared =          1.148 for     55 degrees of freedom
# Null hypothesis probability =   2.111647e-01

Photon flux (15-150 keV)    in 0.392 sec:  (    ) ph/cm2/s
Energy fluence (15-150 keV)             : 0 ( 0  0 ) ergs/cm2
S(25-50 keV) vs. S(50-100 keV) plot
S(25-50 keV)  = 6.71e-09
S(50-100 keV) = 1.87e-08
T90 vs. Hardness ratio plot
T90                                   = 0.339999973773956 sec.
Hardness ratio (energy fluence ratio) = 2.78689
Color vs. Color plot
Count Ratio  (25-50 keV) / (15-25 keV) = 2.15683
Count Ratio (50-100 keV) / (15-25 keV) = 3.99817
Mask shadow pattern
IMX = -2.383069636509457E-01, IMY = -2.059508394812140E-01
TIME vs. PHA plot around the trigger time
Blue+Cyan dotted lines: Time interval of the scaled map
From 0.000000 to 0.128000
TIME vs. DetID plot around the trigger time
Blue+Cyan dotted lines: Time interval of the scaled map
From 0.000000 to 0.128000
100 us light curve (15-350 keV)
Blue+Cyan dotted lines: Time interval of the scaled map
From 0.000000 to 0.128000
Spacecraft aspect plot
Bright source in the pre-burst/pre-slew/post-slew images
Pre-burst image of 15-350 keV band
Time interval of the image:
-87.899390 -0.040000

# RAcent  DECcent POSerr Theta    Phi  PeakCts   SNR AngSep     Name
#  [deg]    [deg]    ['] [deg]  [deg]                   [']
254.6195  35.3750    4.3  39.3   50.8   0.7178   2.7    8.2	Her X-1
172.2052  14.7761    2.6  47.3  176.7   1.0760   4.4 ------	UNKNOWN
147.7925  16.5925    3.3  57.6 -156.3   2.3723   3.5 ------	UNKNOWN
140.2915  28.8165    3.0  52.1 -140.5   2.0541   3.9 ------	UNKNOWN
Pre-slew background subtracted image of 15-350 keV band
Time interval of the image:
-0.040000 0.352000

# RAcent  DECcent POSerr Theta    Phi  PeakCts   SNR AngSep     Name
#  [deg]    [deg]    ['] [deg]  [deg]                   [']
254.6122  35.2948   23.8  39.4   50.9   0.0098   0.5    8.1	Her X-1
201.7989  37.5988    1.3  17.5  139.2   0.0696   8.6 ------	UNKNOWN
Post-slew image of 15-350 keV band
Time interval of the image:
48.500590 962.466100
1325.400000 1465.093700

# RAcent  DECcent POSerr Theta    Phi  PeakCts   SNR AngSep     Name
#  [deg]    [deg]    ['] [deg]  [deg]                   [']
254.5725  35.4153    8.2  41.9   35.1   1.6664   1.4    7.1	Her X-1
246.8055  67.5193    2.7  38.9  -15.7   3.1465   4.3 ------	UNKNOWN
184.5726  40.3347    3.1  13.6 -114.3   2.2567   3.7 ------	UNKNOWN
164.2212  36.1712    3.0  29.9 -122.3   2.9754   3.8 ------	UNKNOWN
152.7545  -0.0592    5.3  58.8 -159.2  12.6602   2.2 ------	UNKNOWN
155.1087  17.1648    3.1  45.6 -144.7   5.8526   3.7 ------	UNKNOWN
310.2279  76.7469    3.6  57.6  -26.3  12.6000   3.3 ------	UNKNOWN
314.3524  75.9210    3.3  58.8  -26.0  16.3225   3.5 ------	UNKNOWN
Plot creation:
Sat May 30 13:26:16 EDT 2015