Special notes of this burst
Image
Pre-slew 15.0-350.0 keV image (Event data)
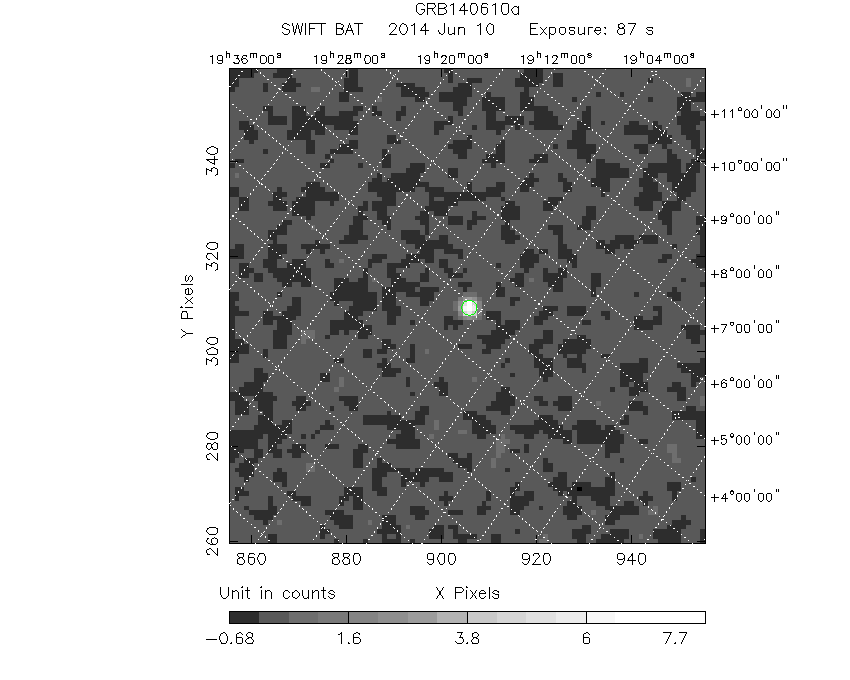
#   RAcent    DECcent   POSerr    Theta     Phi              Peak Cts       SNR   Name
  286.2613     3.8982   0.0040    19.6060    98.8981         8.4291169     47.386 TRIG_00601259

Foreground time interval of the image:
 -6.668  80.133 (delta_t =  86.801 [sec])
Background time interval of the image:
-239.568  -6.668 (delta_t = 232.900 [sec])
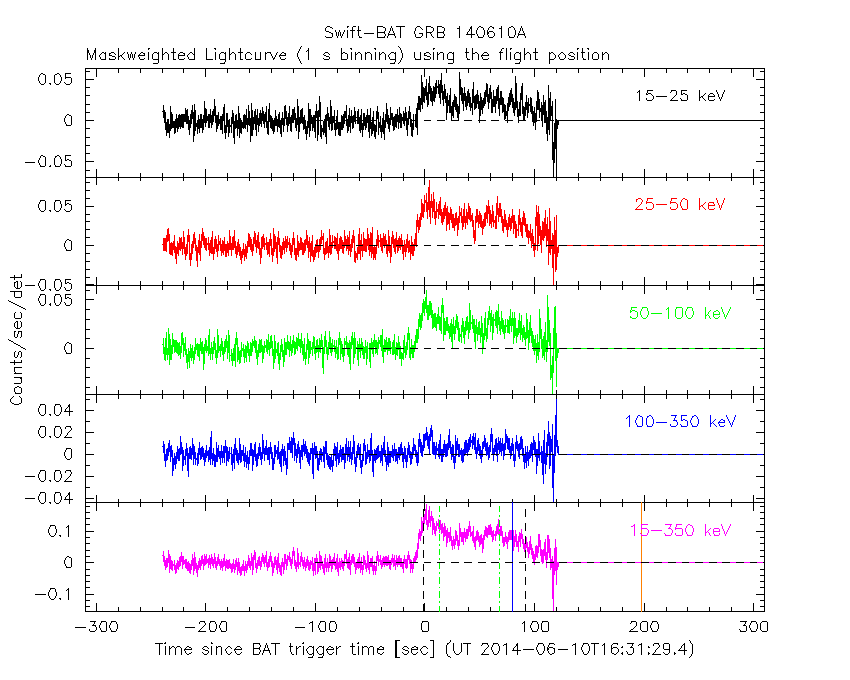
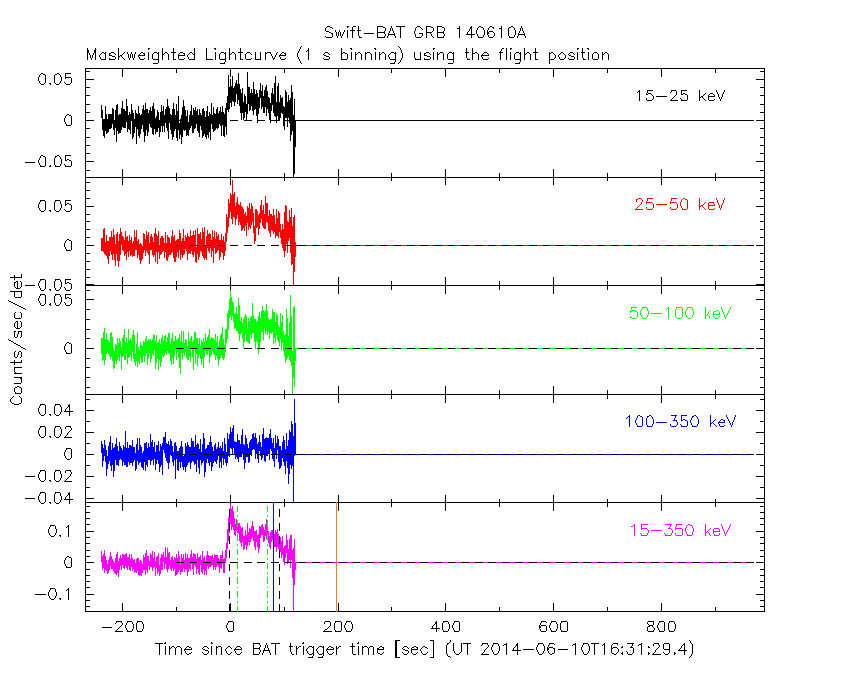
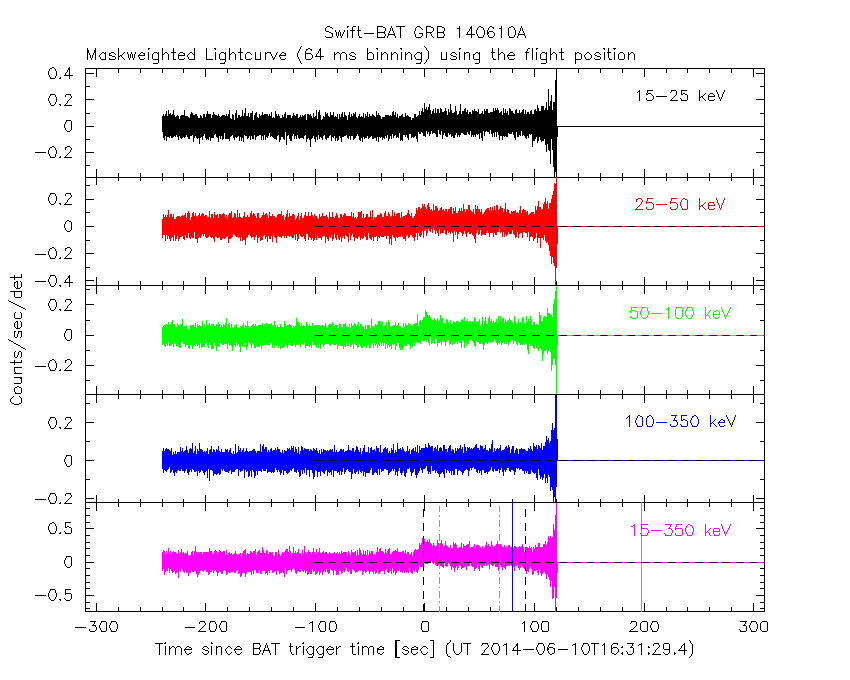
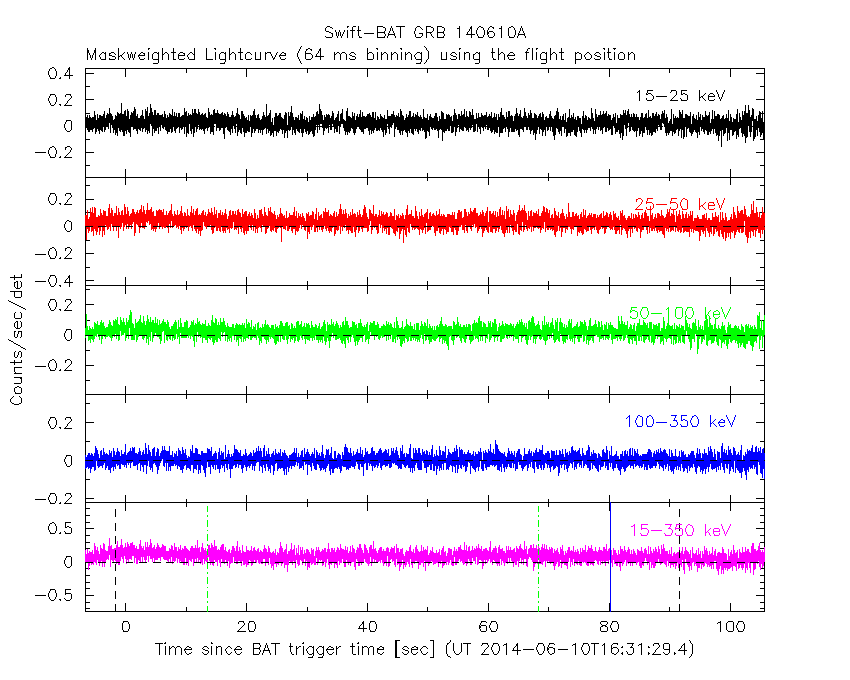
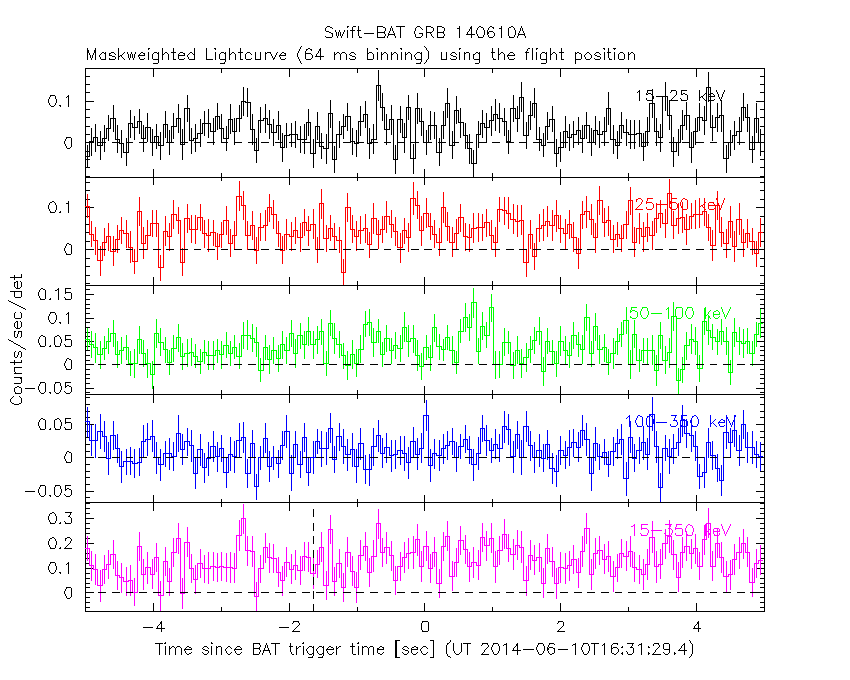
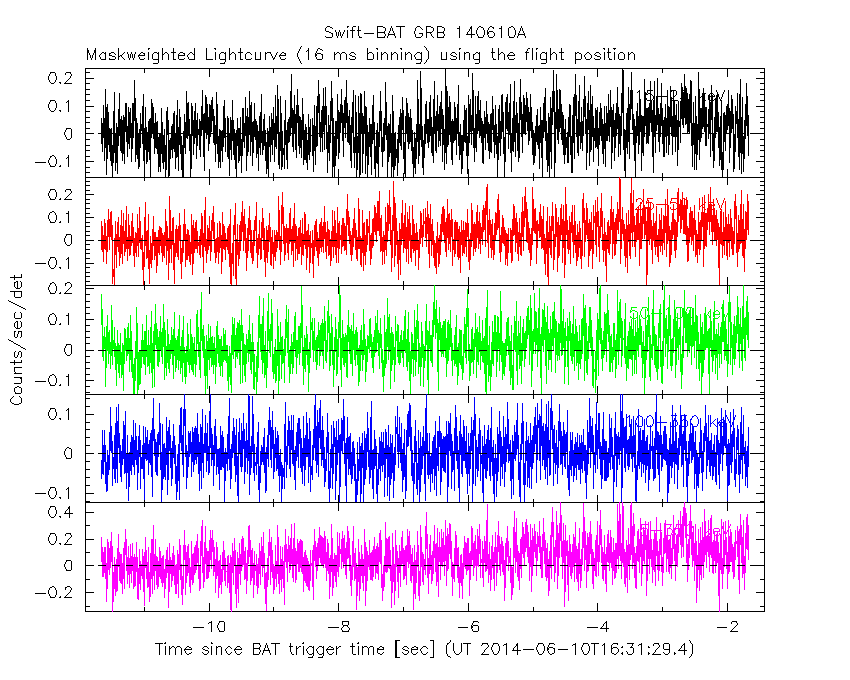
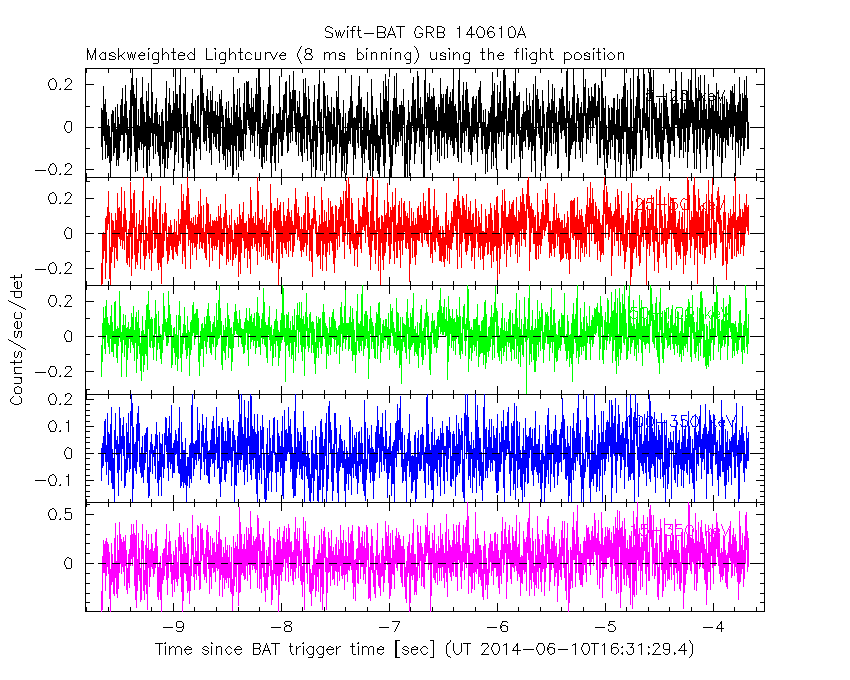
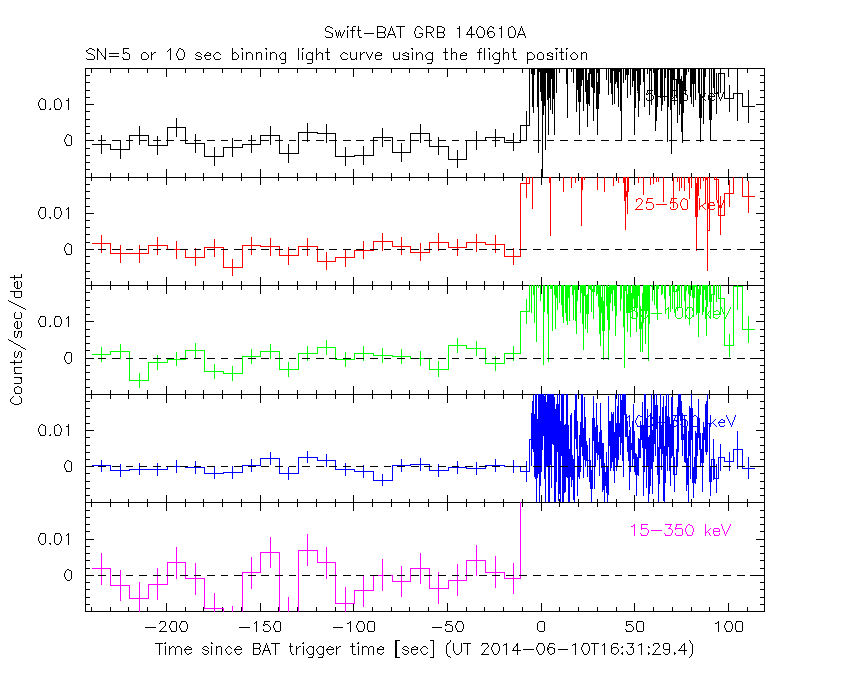
Lightcurves
Notes:
- 1) The mask-weighted light curves are using the flight position.
- 2) Multiple plots of different time binning/intervals are shown to cover all scenarios of short/long GRBs, rate/image triggers, and real/false positives.
- 3) For all the mask-weighted lightcurves, the y-axis units are counts/sec/det where a det is 0.4 x 0.4 = 0.16 sq cm.
- 4) The verticle lines correspond to following: green dotted lines are T50 interval, black dotted lines are T90 interval, blue solid line(s) is a spacecraft slew start time, and orange solid line(s) is a spacecraft slew end time.
- 5) Time of each bin is in the middle of the bin.
1 s binning
From T0-310 s to T0+310 s
From T100_start - 20 s to T100_end + 30 s

Full time interval
64 ms binning
Full time interval
From T100_start to T100_end
From T0-5 sec to T0+5 sec
16 ms binning
From T100_start-5 s to T100_start+5 s
8 ms binning
From T100_start-3 s to T100_start+3 s
2 ms binning
From T100_start-1 s to T100_start+1 s

SN=5 or 10 sec. binning (whichever binning is satisfied first)

SN=5 or 10 sec. binning (T < 200 sec)
Quad-rate summed light curves (from T0-300s to T0+1000s)

Spectral Evolution

Spectra
Notes:
- 1) The fitting includes the systematic errors.
- 2) When the burst includes telescope slew time periods, the fitting uses an average response file made from multiple 5-s response files through out the slew time plus single time preiod for the non-slew times, and weighted by the total counts in the corresponding time period using addrmf. An average response file is needed becuase a spectral fit using the pre-slew DRM will introduce some errors in both a spectral shape and a normalization if the PHA file contains a lot of the slew/post-slew time interval.
- 3) For fits to more complicated models (e.g. a power-law over a cutoff power-law), the BAT team has decided to require a chi-square improvement of more than 6 for each extra dof.
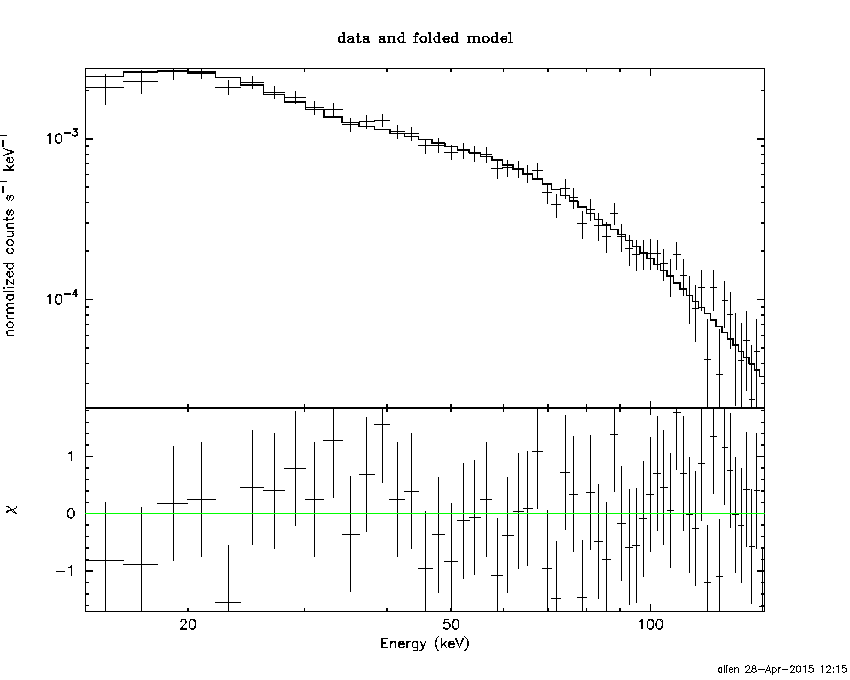
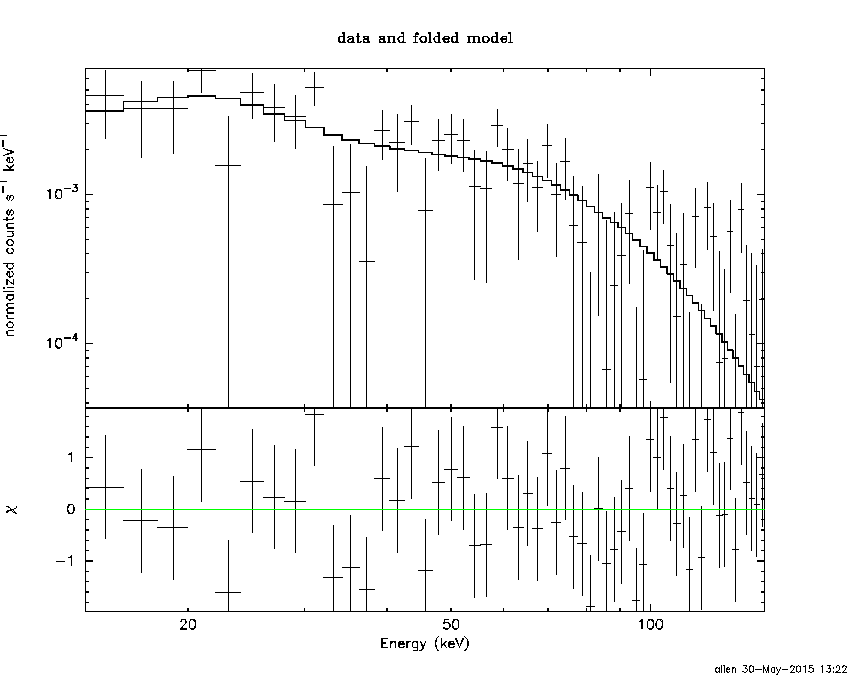
Time averaged spectrum fit using the average DRM
Power-law model

Time interval is from   -6.668 sec. to  105.708 sec.

Spectral model in power-law:
------------------------------------------------------------
Parameters  : value       lower 90%   higher 90%
Photon index: 1.57164     ( -0.0551148   0.0551292 )
Norm@50keV  : 5.61037E-03    ( -0.000163483   0.00016344 )
------------------------------------------------------------
#Fit statistic : Chi-Squared =          41.98 using 59 PHA bins.
# Reduced chi-squared =         0.7365 for     57 degrees of freedom
# Null hypothesis probability =   9.318548e-01

Photon flux (15-150 keV)    in 112.4 sec: 0.714769 ( -0.0228938  0.0229657 ) ph/cm2/s
Energy fluence (15-150 keV)             : 5.91888e-06 ( -1.81614e-07  1.81937e-07 ) ergs/cm2
Cutoff power-law model
Time interval is from   -6.668 sec. to  105.708 sec.
Spectral model in the cutoff power-law:
------------------------------------------------------------
Parameters  : value       lower 90%   higher 90%
Photon index: 1.34655     ( -0.223677   0.212427 )
Epeak [keV] : 152.917      ( -50.9763 1285.8 )
Norm@50keV  : 7.17862E-03    ( -0.0014515   0.00193368 )
------------------------------------------------------------
#Fit statistic : Chi-Squared =          38.70 using 59 PHA bins.
# Reduced chi-squared =         0.6911 for     56 degrees of freedom
# Null hypothesis probability =   9.621912e-01

Photon flux (15-150 keV)    in 112.4 sec: 0.703093 ( -0.025161  0.025249 ) ph/cm2/s
Energy fluence (15-150 keV)             : 5.81914e-06 ( -2.06175e-07  2.05445e-07 ) ergs/cm2
Band function
Time interval is from   -6.668 sec. to  105.708 sec.

Spectral model in the Band function:
------------------------------------------------------------
Parameters  : value       lower 90%   higher 90%
alpha       : -0.292421   ( -0.603703   3.64548 )
beta        : -1.66756    ( -0.110164   0.0909054 )
Epeak [keV] : 45.9430      ( -27.1757 56.7854 )
Norm@50keV   : 3.45294E-02    ( -0.025671   6.76888 )
------------------------------------------------------------
#Fit statistic : Chi-Squared =          34.48 using 59 PHA bins.
# Reduced chi-squared =         0.6269 for     55 degrees of freedom
# Null hypothesis probability =   9.863104e-01

Photon flux (15-150 keV)    in 112.4 sec:  (    ) ph/cm2/s
Energy fluence (15-150 keV)             : 0 ( 0  0 ) ergs/cm2
Single BB
Spectral model blackbody:
------------------------------------------------------------
Parameters  : value    Lower 90%  Upper 90%
kT [keV]    : 15.4417  (  )
R^2/D10^2   : 6.89951E-02  (   )
(R is the radius in km and D10 is the distance to the source in units of 10 kpc)
------------------------------------------------------------
#Fit statistic : Chi-Squared =         284.06 using 59 PHA bins.
# Reduced chi-squared =         4.9836 for     57 degrees of freedom
# Null hypothesis probability =   6.934096e-32

Energy  Fluence     90% Error
[keV]   [erg/cm2]   [erg/cm2]
15- 25  3.852e-07   2.310e-08
25- 50  1.571e-06   5.957e-08
50-150  2.582e-06   1.551e-07
15-150  4.538e-06   1.383e-07
Thermal bremsstrahlung (OTTB)

Spectral model: thermal bremsstrahlung
------------------------------------------------------------
Parameters  : value         Lower 90%    Upper 90%
kT [keV]    : 200.000       (      )
Norm        : 2.88121       (-0.0835916     0.0835916)
------------------------------------------------------------
#Fit statistic : Chi-Squared =          38.96 using 59 PHA bins.
# Reduced chi-squared =         0.6835 for     57 degrees of freedom
# Null hypothesis probability =   9.675525e-01

Energy  Fluence     90% Error
[keV]   [erg/cm2]   [erg/cm2]
15- 25  8.071e-07   2.546e-08
25- 50  1.552e-06   5.170e-08
50-150  3.404e-06   1.124e-07
15-150  5.764e-06   1.916e-07
Double BB

Spectral model: bbodyrad<1> + bbodyrad<2>
------------------------------------------------------------
Parameters  : value         Lower 90%    Upper 90%
kT1 [keV]   : 7.95746        (-0.761133      0.799535)
R1^2/D10^2  : 0.496276        (-0.132293      0.198336)
kT2 [keV]   : 29.7703        (-3.49736      4.88531)
R2^2/D10^2  : 5.27664E-03    (-0.00213554   0.00300672)
------------------------------------------------------------
#Fit statistic : Chi-Squared =          36.70 using 59 PHA bins.
# Reduced chi-squared =         0.6672 for     55 degrees of freedom
# Null hypothesis probability =   9.727326e-01

Energy  Fluence     90% Error
[keV]   [erg/cm2]   [erg/cm2]
15- 25  7.188e-07   7.014e-08
25- 50  1.611e-06   9.385e-08
50-150  3.475e-06   4.384e-07
15-150  5.805e-06   4.822e-07
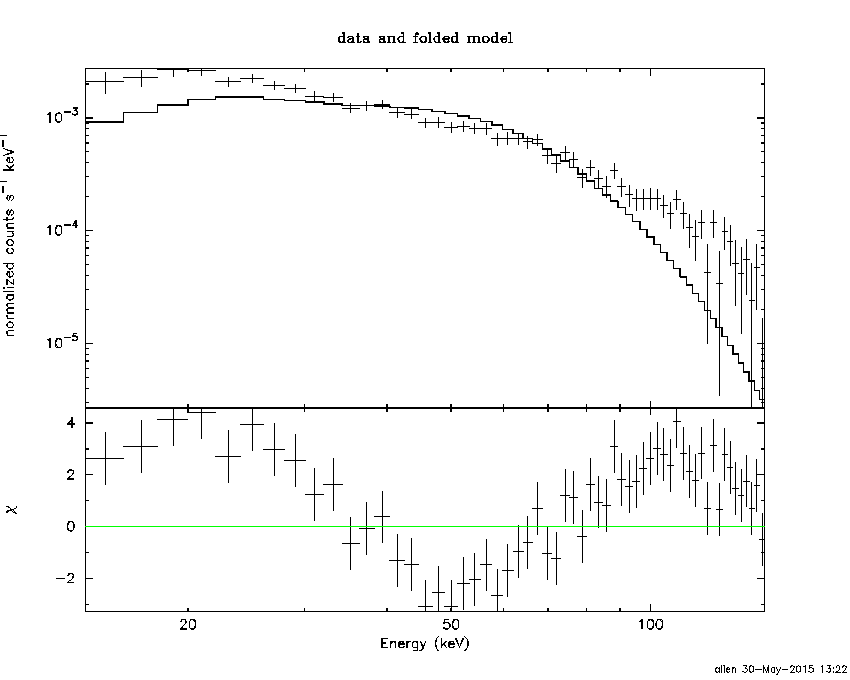
Peak spectrum fit
Power-law model

Time interval is from    0.452 sec. to    1.452 sec.

Spectral model in power-law:
------------------------------------------------------------
Parameters  : value       lower 90%   higher 90%
Photon index: 1.36070     ( -0.24083   0.238919 )
Norm@50keV  : 1.13530E-02    ( -0.00155638   0.00155407 )
------------------------------------------------------------
#Fit statistic : Chi-Squared =          54.35 using 59 PHA bins.
# Reduced chi-squared =         0.9535 for     57 degrees of freedom
# Null hypothesis probability =   5.750773e-01

Photon flux (15-150 keV)    in 1 sec: 1.37076 ( -0.193123  0.1938 ) ph/cm2/s
Energy fluence (15-150 keV)             : 1.10619e-07 ( -1.6653e-08  1.68149e-08 ) ergs/cm2
Cutoff power-law model

Time interval is from    0.452 sec. to    1.452 sec.
Spectral model in the cutoff power-law:
------------------------------------------------------------
Parameters  : value       lower 90%   higher 90%
Photon index: 1.22063     ( -1.09239   1.0076 )
Epeak [keV] : 288.472      ( -288.474 -288.474 )
Norm@50keV  : 1.33174E-02    ( -0.0064706   0.0313104 )
------------------------------------------------------------
#Fit statistic : Chi-Squared =          54.29 using 59 PHA bins.
# Reduced chi-squared =         0.9694 for     56 degrees of freedom
# Null hypothesis probability =   5.400198e-01

Photon flux (15-150 keV)    in 1 sec: 1.36290 ( -0.2005  0.19443 ) ph/cm2/s
Energy fluence (15-150 keV)             : 1.09627e-07 ( -1.84073e-08  1.7637e-08 ) ergs/cm2
Band function

Time interval is from    0.452 sec. to    1.452 sec.

Spectral model in the Band function:
------------------------------------------------------------
Parameters  : value       lower 90%   higher 90%
alpha       : -0.973177   ( 0.845384   0.845384 )
beta        : -1.55096    ( 1.39443   0.271664 )
Epeak [keV] : 127.275      ( -65.8559 -65.8559 )
Norm@50keV   : 1.79685E-02    ( -0.00749059   0 )
------------------------------------------------------------
#Fit statistic : Chi-Squared =          54.13 using 59 PHA bins.
# Reduced chi-squared =         0.9841 for     55 degrees of freedom
# Null hypothesis probability =   5.079528e-01

Photon flux (15-150 keV)    in 1 sec:  (    ) ph/cm2/s
Energy fluence (15-150 keV)             : 0 ( 0  0 ) ergs/cm2
Single BB

Spectral model blackbody:
------------------------------------------------------------
Parameters  : value    Lower 90%  Upper 90%
kT [keV]    : 16.4536  (-2.65233  3.41564)
R^2/D10^2   : 0.115833  (-0.0554434   0.0979286)
(R is the radius in km and D10 is the distance to the source in units of 10 kpc)
------------------------------------------------------------
#Fit statistic : Chi-Squared =          65.25 using 59 PHA bins.
# Reduced chi-squared =          1.145 for     57 degrees of freedom
# Null hypothesis probability =   2.119207e-01

Energy  Fluence     90% Error
[keV]   [erg/cm2]   [erg/cm2]
15- 25  6.441e-09   1.754e-09
25- 50  2.775e-08   6.380e-09
50-150  5.306e-08   1.429e-08
15-150  8.725e-08   1.736e-08
Thermal bremsstrahlung (OTTB)

Spectral model: thermal bremsstrahlung
------------------------------------------------------------
Parameters  : value         Lower 90%    Upper 90%
kT [keV]    : 200.000       (      )
Norm        : 5.68741       (-0.780277     0.780204)
------------------------------------------------------------
#Fit statistic : Chi-Squared =          56.16 using 59 PHA bins.
# Reduced chi-squared =         0.9852 for     57 degrees of freedom
# Null hypothesis probability =   5.067076e-01

Energy  Fluence     90% Error
[keV]   [erg/cm2]   [erg/cm2]
15- 25  1.417e-08   8.005e-09
25- 50  2.725e-08   1.521e-08
50-150  5.977e-08   3.318e-08
15-150  1.012e-07   5.615e-08
Double BB
Spectral model: bbodyrad<1> + bbodyrad<2>
------------------------------------------------------------
Parameters  : value         Lower 90%    Upper 90%
kT1 [keV]   : 5.88984        (-2.96881      8.9677)
R1^2/D10^2  : 2.12621        (-1.75938      39.4692)
kT2 [keV]   : 23.6879        (-6.72768      -23.9097)
R2^2/D10^2  : 2.87537E-02    (-0.0237378   0.0325664)
------------------------------------------------------------
#Fit statistic : Chi-Squared =          55.94 using 59 PHA bins.
# Reduced chi-squared =          1.017 for     55 degrees of freedom
# Null hypothesis probability =   4.392125e-01

Energy  Fluence     90% Error
[keV]   [erg/cm2]   [erg/cm2]
15- 25  1.242e-08   7.031e-09
25- 50  2.503e-08   1.312e-08
50-150  6.728e-08   3.786e-08
15-150  1.047e-07   5.377e-08
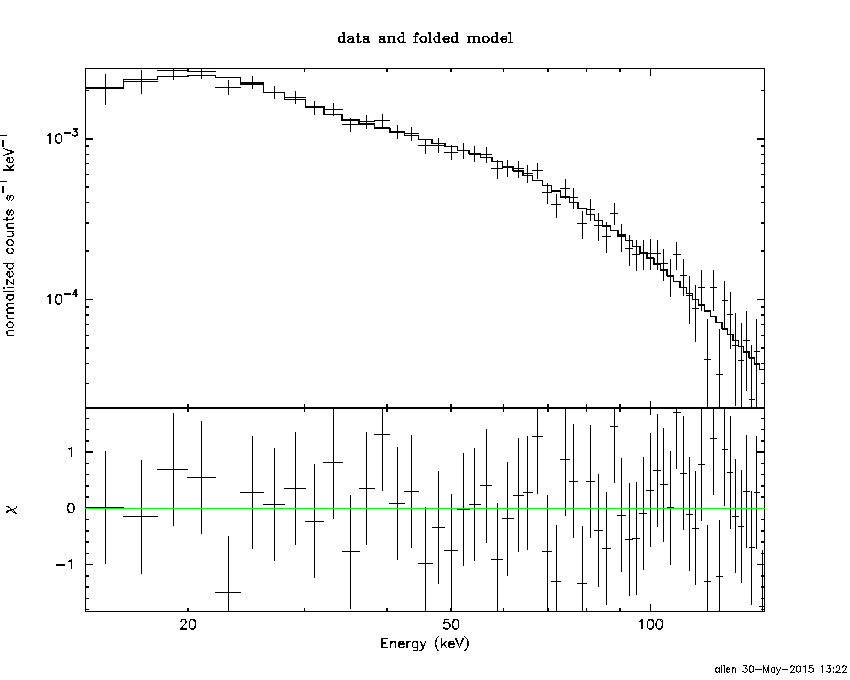
Pre-slew spectrum (Pre-slew PHA with pre-slew DRM)
Power-law model

Spectral model in power-law:
------------------------------------------------------------
Parameters  : value       lower 90%   higher 90%
Photon index: 1.57378     ( -0.0555342   0.0555337 )
Norm@50keV  : 6.19097E-03    ( -0.000182844   0.000182788 )
------------------------------------------------------------
#Fit statistic : Chi-Squared =          48.50 using 59 PHA bins.
# Reduced chi-squared =         0.8508 for     57 degrees of freedom
# Null hypothesis probability =   7.813022e-01

Photon flux (15-150 keV)    in 86.8 sec: 0.789244 ( -0.025491  0.0255657 ) ph/cm2/s
Energy fluence (15-150 keV)             : 5.04239e-06 ( -1.56993e-07  1.57277e-07 ) ergs/cm2
Cutoff power-law model

Spectral model in the cutoff power-law:
------------------------------------------------------------
Parameters  : value       lower 90%   higher 90%
Photon index: 1.34188     ( -0.224155   0.212977 )
Epeak [keV] : 148.492      ( -48.2991 752.355 )
Norm@50keV  : 7.99489E-03    ( -0.00163225   0.00217582 )
------------------------------------------------------------
#Fit statistic : Chi-Squared =          45.02 using 59 PHA bins.
# Reduced chi-squared =         0.8040 for     56 degrees of freedom
# Null hypothesis probability =   8.530881e-01

Photon flux (15-150 keV)    in 86.8 sec: 0.776297 ( -0.027867  0.027952 ) ph/cm2/s
Energy fluence (15-150 keV)             : 4.95395e-06 ( -1.78461e-07  1.77367e-07 ) ergs/cm2
Band function

Spectral model in the Band function:
------------------------------------------------------------
Parameters  : value       lower 90%   higher 90%
alpha       : -9.77175E-02   ( -1.00173   3.99149 )
beta        : -1.67457    ( -0.100512   0.0861141 )
Epeak [keV] : 43.1573      ( -15.239 33.898 )
Norm@50keV   : 5.22455E-02    ( -0.0563808   71.8466 )
------------------------------------------------------------
#Fit statistic : Chi-Squared =          39.16 using 59 PHA bins.
# Reduced chi-squared =         0.7120 for     55 degrees of freedom
# Null hypothesis probability =   9.474400e-01

Photon flux (15-150 keV)    in 86.8 sec:  (    ) ph/cm2/s
Energy fluence (15-150 keV)             : 0 ( 0  0 ) ergs/cm2
S(25-50 keV) vs. S(50-100 keV) plot
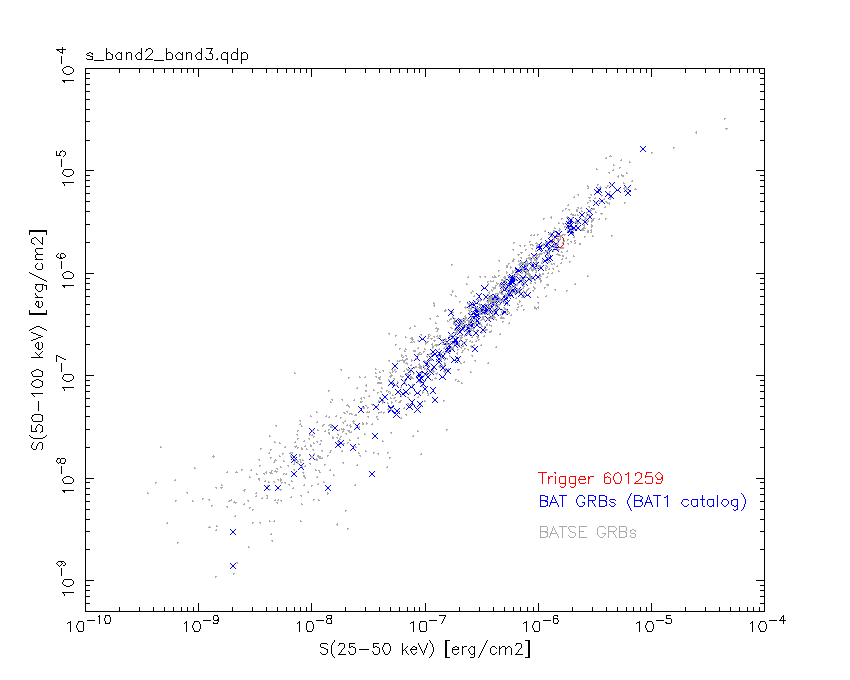
S(25-50 keV)  = 1.51e-06
S(50-100 keV) = 2.04e-06
T90 vs. Hardness ratio plot
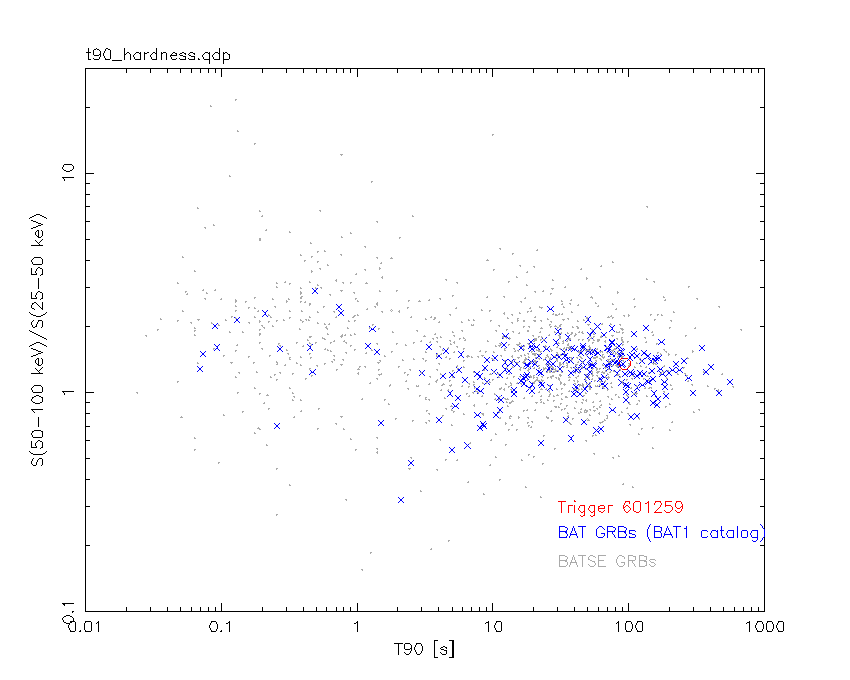
T90                                   = 93.2519999742508 sec.
Hardness ratio (energy fluence ratio) = 1.35099
Color vs. Color plot
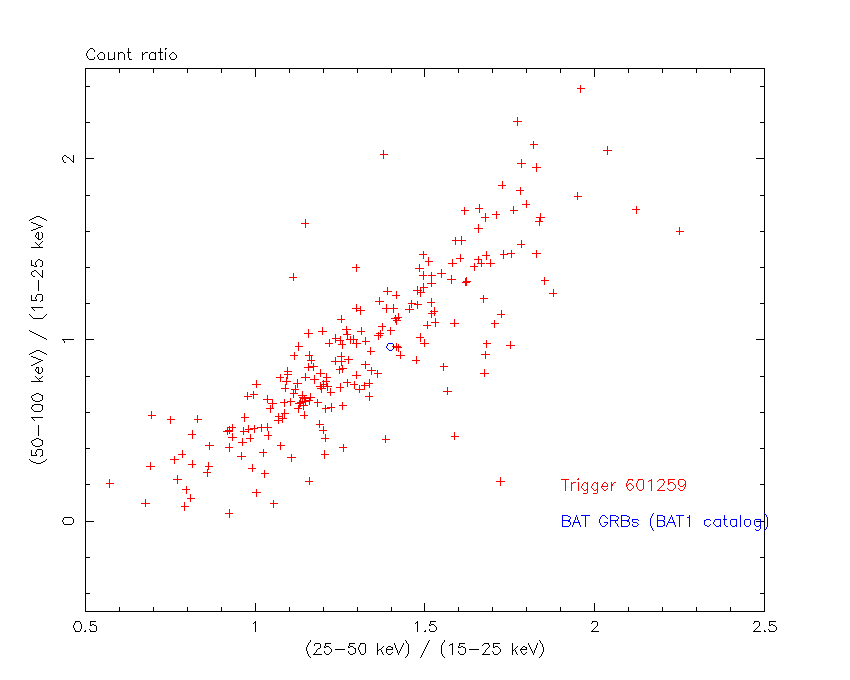
Count Ratio  (25-50 keV) / (15-25 keV) = 1.39739
Count Ratio (50-100 keV) / (15-25 keV) = 0.962842
Mask shadow pattern

IMX = -5.509643130575773E-02, IMY = -3.519150614601779E-01
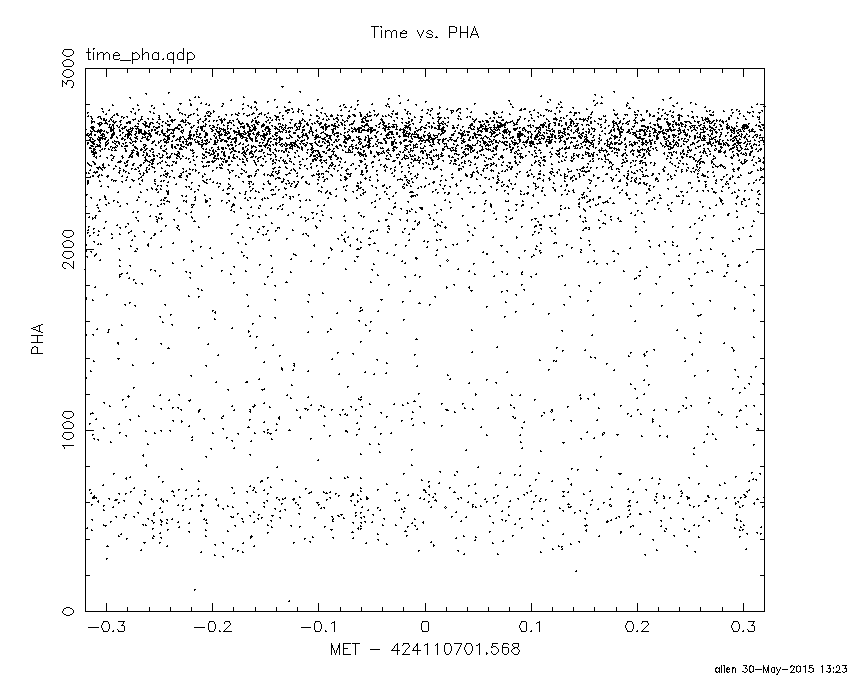
TIME vs. PHA plot around the trigger time
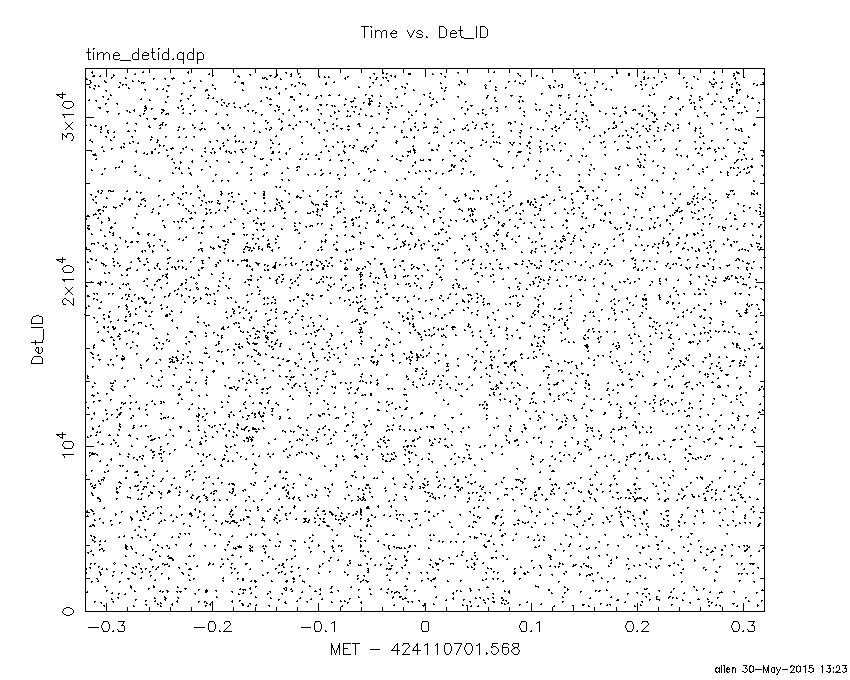
TIME vs. DetID plot around the trigger time
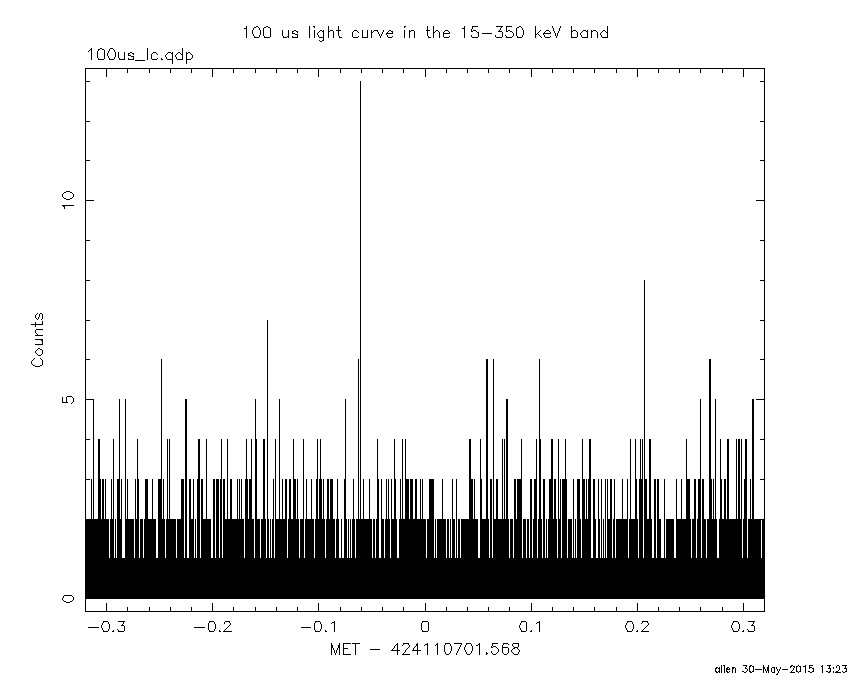
100 us light curve (15-350 keV)
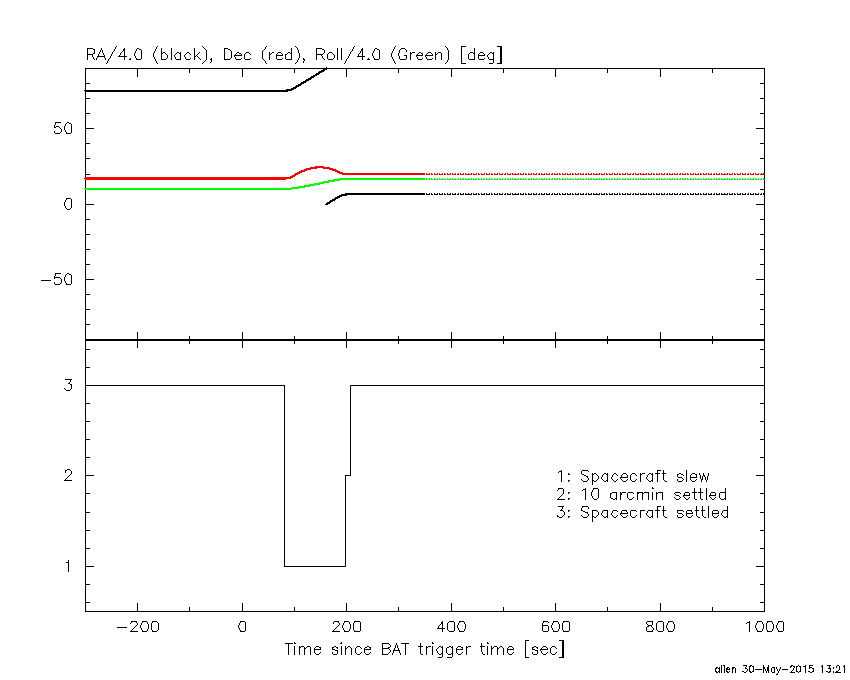
Spacecraft aspect plot
Bright source in the pre-burst/pre-slew/post-slew images
Pre-burst image of 15-350 keV band
Time interval of the image:
-239.568000 -6.668000

# RAcent  DECcent POSerr Theta    Phi  PeakCts   SNR AngSep     Name
#  [deg]    [deg]    ['] [deg]  [deg]                   [']
254.4422  35.3122    3.1  45.2  172.5   1.8697   3.8    2.0	Her X-1
268.5133  -1.4530    5.8  37.1  112.6   1.2532   2.0    8.7	SW J1753.5-0127
288.7846  10.9476    0.5  13.4  113.9   4.8847  22.3    0.8	GRS 1915+105
299.5841  35.1925    0.3  18.2 -134.7   7.9308  33.6    0.6	Cyg X-1
308.0295  41.0247    2.4  24.7 -118.1   1.2852   4.7    5.7	Cyg X-3
326.0985  38.1495   20.3  30.4  -89.7   0.2156   0.6   10.9	Cyg X-2
278.7557  31.9587    3.0  25.1  179.9   0.8886   3.9 ------	UNKNOWN
239.6087  46.8764    2.9  58.3 -175.6   5.8618   4.0 ------	UNKNOWN
257.4068  66.4393    2.6  57.0 -149.9   7.7890   4.5 ------	UNKNOWN
313.6099  60.9798    2.5  44.8 -122.1   4.6116   4.6 ------	UNKNOWN
Pre-slew background subtracted image of 15-350 keV band
Time interval of the image:
-6.668000 80.132600

# RAcent  DECcent POSerr Theta    Phi  PeakCts   SNR AngSep     Name
#  [deg]    [deg]    ['] [deg]  [deg]                   [']
254.5110  35.2098    5.6  45.1  172.4  -0.5985  -2.1    8.4	Her X-1
268.2628  -1.3859    5.3  37.2  112.9   0.8676   2.2    7.5	SW J1753.5-0127
288.7805  10.8548  599.0  13.5  113.6  -0.0030  -0.0    5.5	GRS 1915+105
299.8493  35.2200    0.0  18.2 -134.0   0.0992   0.7   12.7	Cyg X-1
308.1072  40.9564   46.2  24.7 -117.9  -0.0421  -0.2    0.3	Cyg X-3
326.3219  38.2492   13.4  30.6  -89.6   0.1964   0.9    8.3	Cyg X-2
303.3699 -10.7029    2.8  27.8   44.5   0.7966   4.1 ------	UNKNOWN
286.2613   3.8982    0.2  19.6   98.9   8.4294  47.4 ------	UNKNOWN
312.3193  60.4282    2.2  44.1 -122.8   2.7964   5.3 ------	UNKNOWN
329.6114  52.2549    2.6  41.8 -104.7   2.6299   4.5 ------	UNKNOWN
Post-slew image of 15-350 keV band
Time interval of the image:
197.532640 962.512000

# RAcent  DECcent POSerr Theta    Phi  PeakCts   SNR AngSep     Name
#  [deg]    [deg]    ['] [deg]  [deg]                   [']
355.2773  30.2835    3.0  29.4  140.0   2.2768   3.8 ------	UNKNOWN
 22.3500   6.6407    3.4  13.8   38.2   1.4636   3.4 ------	UNKNOWN
 49.6352 -11.0558    2.4  38.9  -15.7   2.7002   4.9 ------	UNKNOWN
 36.3600  29.6926    3.0  13.6 -114.2   1.7521   3.8 ------	UNKNOWN
 14.5686  78.4593    5.1  58.7 -159.2   9.8118   2.3 ------	UNKNOWN
Plot creation:
Sat May 30 13:23:10 EDT 2015