Click here for the BAT GCN circular template
Image
Pre-slew 15.0-350.0 keV image (Event data)

#   RAcent    DECcent   POSerr    Theta     Phi              Peak Cts       SNR   Name
  322.6360    14.8961   0.0173    20.1491   111.8494         1.1290962     11.096 TRIG_00601662

Foreground time interval of the image:
 -3.284  55.676 (delta_t =  58.960 [sec])
Background time interval of the image:
-239.936  -3.284 (delta_t = 236.652 [sec])
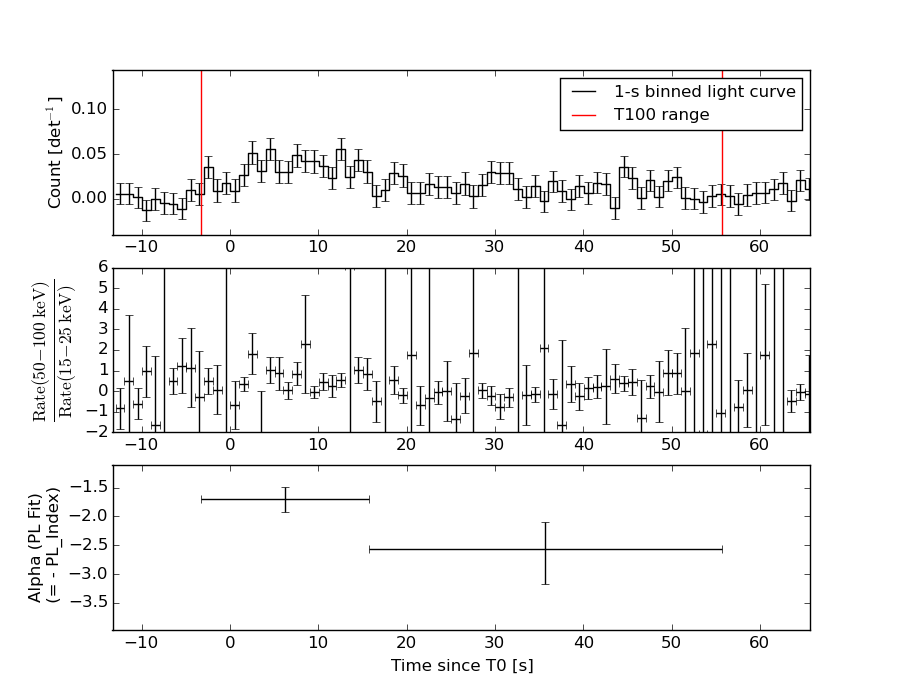
Lightcurves
Notes:
- 1) The mask-weighted light curves are using the flight position.
- 2) Multiple plots of different time binning/intervals are shown to cover all scenarios of short/long GRBs, rate/image triggers, and real/false positives.
- 3) For all the mask-weighted lightcurves, the y-axis units are counts/sec/det where a det is 0.4 x 0.4 = 0.16 sq cm.
- 4) The verticle lines correspond to following: green dotted lines are T50 interval, black dotted lines are T90 interval, blue solid line(s) is a spacecraft slew start time, and orange solid line(s) is a spacecraft slew end time.
- 5) Time of each bin is in the middle of the bin.
1 s binning
From T0-310 s to T0+310 s

From T100_start - 20 s to T100_end + 30 s

Full time interval

64 ms binning
Full time interval

From T100_start to T100_end

From T0-5 sec to T0+5 sec

16 ms binning
From T100_start-5 s to T100_start+5 s

Blue+Cyan dotted lines: Time interval of the scaled map
From 0.000000 to 16.384000
8 ms binning
From T100_start-3 s to T100_start+3 s

Blue+Cyan dotted lines: Time interval of the scaled map
From 0.000000 to 16.384000
2 ms binning
From T100_start-1 s to T100_start+1 s

Blue+Cyan dotted lines: Time interval of the scaled map
From 0.000000 to 16.384000
SN=5 or 10 sec. binning (whichever binning is satisfied first)

SN=5 or 10 sec. binning (T < 200 sec)

Quad-rate summed light curves (from T0-300s to T0+1000s)

Spectral Evolution
Spectra
Notes:
- 1) The fitting includes the systematic errors.
- 2) When the burst includes telescope slew time periods, the fitting uses an average response file made from multiple 5-s response files through out the slew time plus single time preiod for the non-slew times, and weighted by the total counts in the corresponding time period using addrmf. An average response file is needed becuase a spectral fit using the pre-slew DRM will introduce some errors in both a spectral shape and a normalization if the PHA file contains a lot of the slew/post-slew time interval.
- 3) For fits to more complicated models (e.g. a power-law over a cutoff power-law), the BAT team has decided to require a chi-square improvement of more than 6 for each extra dof.
Time averaged spectrum fit using the average DRM
Power-law model

Time interval is from   -3.284 sec. to   55.676 sec.

Spectral model in power-law:
------------------------------------------------------------
Parameters  : value       lower 90%   higher 90%
Photon index: 2.05480     ( -0.242162   0.26344 )
Norm@50keV  : 1.07003E-03    ( -0.000191719   0.000186348 )
------------------------------------------------------------
#Fit statistic : Chi-Squared =          54.93 using 59 PHA bins.
# Reduced chi-squared =         0.9636 for     57 degrees of freedom
# Null hypothesis probability =   5.532161e-01

Photon flux (15-150 keV)    in 58.96 sec: 0.164685 ( -0.0214734  0.0214734 ) ph/cm2/s
Energy fluence (15-150 keV)             : 5.83872e-07 ( -9.41756e-08  9.73152e-08 ) ergs/cm2
Cutoff power-law model

Time interval is from   -3.284 sec. to   55.676 sec.
Spectral model in the cutoff power-law:
------------------------------------------------------------
Parameters  : value       lower 90%   higher 90%
Photon index: 0.946240     ( -1.49028   0.817867 )
Epeak [keV] : 38.7567      (   )
Norm@50keV  : 4.75793E-03    (     )
------------------------------------------------------------
#Fit statistic : Chi-Squared =          52.14 using 59 PHA bins.
# Reduced chi-squared =         0.9310 for     56 degrees of freedom
# Null hypothesis probability =   6.218533e-01

Photon flux (15-150 keV)    in 58.96 sec: 0.158814 ( -0.022115  0.022192 ) ph/cm2/s
Energy fluence (15-150 keV)             : 5.30184e-07 ( -9.45211e-08  1.07775e-07 ) ergs/cm2
Band function

Time interval is from   -3.284 sec. to   55.676 sec.

Spectral model in the Band function:
------------------------------------------------------------
Parameters  : value       lower 90%   higher 90%
alpha       : -0.946420   ( -0.95915   1.70235 )
beta        : -10.0000    ( 10   3.55271e-15 )
Epeak [keV] : 38.7512      ( -9.47633 25.4482 )
Norm@50keV   : 4.75634E-03    ( -0.00475651   0.0311153 )
------------------------------------------------------------
#Fit statistic : Chi-Squared =          52.14 using 59 PHA bins.
# Reduced chi-squared =         0.9479 for     55 degrees of freedom
# Null hypothesis probability =   5.847067e-01

Photon flux (15-150 keV)    in 58.96 sec:  (    ) ph/cm2/s
Energy fluence (15-150 keV)             : 5.30432e-07 ( 0  0 ) ergs/cm2
Single BB

Spectral model blackbody:
------------------------------------------------------------
Parameters  : value    Lower 90%  Upper 90%
kT [keV]    : 9.95637  (-1.32571  1.52125)
R^2/D10^2   : 7.96786E-02  (-0.0335407   0.0578562)
(R is the radius in km and D10 is the distance to the source in units of 10 kpc)
------------------------------------------------------------
#Fit statistic : Chi-Squared =          58.37 using 59 PHA bins.
# Reduced chi-squared =          1.024 for     57 degrees of freedom
# Null hypothesis probability =   4.248488e-01

Energy  Fluence     90% Error
[keV]   [erg/cm2]   [erg/cm2]
15- 25  9.470e-08   2.205e-08
25- 50  2.340e-07   4.012e-08
50-150  1.206e-07   4.192e-08
15-150  4.493e-07   8.532e-08
Thermal bremsstrahlung (OTTB)

Spectral model: thermal bremsstrahlung
------------------------------------------------------------
Parameters  : value         Lower 90%    Upper 90%
kT [keV]    : 58.9857       (-18.3997      32.5239)
Norm        : 0.874722       (-0.172338     0.214683)
------------------------------------------------------------
#Fit statistic : Chi-Squared =          52.42 using 59 PHA bins.
# Reduced chi-squared =         0.9197 for     57 degrees of freedom
# Null hypothesis probability =   6.471589e-01

Energy  Fluence     90% Error
[keV]   [erg/cm2]   [erg/cm2]
15- 25  1.293e-07   2.282e-08
25- 50  1.957e-07   3.237e-08
50-150  2.195e-07   8.305e-08
15-150  5.445e-07   1.073e-07
Double BB

Spectral model: bbodyrad<1> + bbodyrad<2>
------------------------------------------------------------
Parameters  : value         Lower 90%    Upper 90%
kT1 [keV]   : 2.35327        (-1.18      2.29004)
R1^2/D10^2  : 25.8445        (-25.1592      12092.2)
kT2 [keV]   : 11.5517        (-1.86185      2.84213)
R2^2/D10^2  : 4.11906E-02    (-0.0252655   0.027467)
------------------------------------------------------------
#Fit statistic : Chi-Squared =          49.52 using 59 PHA bins.
# Reduced chi-squared =         0.9005 for     55 degrees of freedom
# Null hypothesis probability =   6.830626e-01

Energy  Fluence     90% Error
[keV]   [erg/cm2]   [erg/cm2]
15- 25  1.215e-07   4.939e-08
25- 50  2.083e-07   7.992e-08
50-150  1.604e-07   7.345e-08
15-150  4.902e-07   1.666e-07
Peak spectrum fit
Power-law model

Time interval is from    6.928 sec. to    7.928 sec.

Spectral model in power-law:
------------------------------------------------------------
Parameters  : value       lower 90%   higher 90%
Photon index: 1.80184     ( -0.651967   0.721411 )
Norm@50keV  : 3.67202E-03    ( -0.00158419   0.00143481 )
------------------------------------------------------------
#Fit statistic : Chi-Squared =          54.24 using 59 PHA bins.
# Reduced chi-squared =         0.9515 for     57 degrees of freedom
# Null hypothesis probability =   5.793410e-01

Photon flux (15-150 keV)    in 1 sec: 0.506358 ( -0.161649  0.161649 ) ph/cm2/s
Energy fluence (15-150 keV)             : 3.38021e-08 ( -1.35688e-08  1.46824e-08 ) ergs/cm2
Cutoff power-law model

Time interval is from    6.928 sec. to    7.928 sec.
Spectral model in the cutoff power-law:
------------------------------------------------------------
Parameters  : value       lower 90%   higher 90%
Photon index: 1.83406     ( -1.29614   0.695199 )
Epeak [keV] : 9999.36      (   )
Norm@50keV  : 3.58116E-03    (     )
------------------------------------------------------------
#Fit statistic : Chi-Squared =          54.25 using 59 PHA bins.
# Reduced chi-squared =         0.9687 for     56 degrees of freedom
# Null hypothesis probability =   5.415274e-01

Photon flux (15-150 keV)    in 1 sec: 0.506025 ( -0.161571  0.161562 ) ph/cm2/s
Energy fluence (15-150 keV)             : 3.33962e-08 ( -3.33962e-08  1.49731e-08 ) ergs/cm2
Band function

Time interval is from    6.928 sec. to    7.928 sec.

Spectral model in the Band function:
------------------------------------------------------------
Parameters  : value       lower 90%   higher 90%
alpha       : 4.96925   ( -4.96925   -4.96925 )
beta        : -2.15867    ( -3.60465   0.884904 )
Epeak [keV] : 24.4676      ( -24.4676 8.76741 )
Norm@50keV   : 614.895    ( -194.442   6.25894e+06 )
------------------------------------------------------------
#Fit statistic : Chi-Squared =          53.73 using 59 PHA bins.
# Reduced chi-squared =         0.9770 for     55 degrees of freedom
# Null hypothesis probability =   5.230952e-01

Photon flux (15-150 keV)    in 1 sec:  (    ) ph/cm2/s
Energy fluence (15-150 keV)             : 0 ( 0  0 ) ergs/cm2
Single BB
Spectral model blackbody:
------------------------------------------------------------
Parameters  : value    Lower 90%  Upper 90%
kT [keV]    : 7.15186  (-2.05605  3.48734)
R^2/D10^2   : 0.843533  (-0.843408   2.44704)
(R is the radius in km and D10 is the distance to the source in units of 10 kpc)
------------------------------------------------------------
#Fit statistic : Chi-Squared =          57.13 using 59 PHA bins.
# Reduced chi-squared =          1.002 for     57 degrees of freedom
# Null hypothesis probability =   4.703951e-01

Energy  Fluence     90% Error
[keV]   [erg/cm2]   [erg/cm2]
15- 25  7.084e-09   4.305e-09
25- 50  1.011e-08   6.295e-09
50-150  1.809e-09   1.591e-09
15-150  1.900e-08   1.184e-08
Thermal bremsstrahlung (OTTB)

Spectral model: thermal bremsstrahlung
------------------------------------------------------------
Parameters  : value         Lower 90%    Upper 90%
kT [keV]    : 106.323       (-106.294      -106.294)
Norm        : 2.17947       (-0.802116     2.24226)
------------------------------------------------------------
#Fit statistic : Chi-Squared =          55.17 using 59 PHA bins.
# Reduced chi-squared =         0.9678 for     57 degrees of freedom
# Null hypothesis probability =   5.441413e-01

Energy  Fluence     90% Error
[keV]   [erg/cm2]   [erg/cm2]
15- 25  5.695e-09   3.531e-09
25- 50  9.966e-09   6.135e-09
50-150  1.671e-08   1.254e-08
15-150  3.237e-08   2.123e-08
Double BB

Spectral model: bbodyrad<1> + bbodyrad<2>
------------------------------------------------------------
Parameters  : value         Lower 90%    Upper 90%
kT1 [keV]   : 6.17571        (-1.82249      2.47365)
R1^2/D10^2  : 1.38090        (-1.04385      4.13348)
kT2 [keV]   : 159.068        (-158.711      -158.711)
R2^2/D10^2  : 1.26901E-04    (-9.06056e-05   0.00605843)
------------------------------------------------------------
#Fit statistic : Chi-Squared =          49.98 using 59 PHA bins.
# Reduced chi-squared =         0.9087 for     55 degrees of freedom
# Null hypothesis probability =   6.663335e-01

Energy  Fluence     90% Error
[keV]   [erg/cm2]   [erg/cm2]
15- 25  7.414e-09   4.564e-09
25- 50  8.804e-09   5.280e-09
50-150  2.554e-08   5.335e-09
15-150  4.176e-08   1.340e-08
Pre-slew spectrum (Pre-slew PHA with pre-slew DRM)
Power-law model

Spectral model in power-law:
------------------------------------------------------------
Parameters  : value       lower 90%   higher 90%
Photon index: 2.05480     ( -0.242162   0.26344 )
Norm@50keV  : 1.07003E-03    ( -0.000191719   0.000186348 )
------------------------------------------------------------
#Fit statistic : Chi-Squared =          54.93 using 59 PHA bins.
# Reduced chi-squared =         0.9636 for     57 degrees of freedom
# Null hypothesis probability =   5.532161e-01

Photon flux (15-150 keV)    in 58.96 sec: 0.164685 ( -0.0214734  0.0214734 ) ph/cm2/s
Energy fluence (15-150 keV)             : 5.83872e-07 ( -9.41756e-08  9.73152e-08 ) ergs/cm2
Cutoff power-law model

Spectral model in the cutoff power-law:
------------------------------------------------------------
Parameters  : value       lower 90%   higher 90%
Photon index: 0.946240     ( -1.49028   0.817867 )
Epeak [keV] : 38.7567      (   )
Norm@50keV  : 4.75793E-03    (     )
------------------------------------------------------------
#Fit statistic : Chi-Squared =          52.14 using 59 PHA bins.
# Reduced chi-squared =         0.9310 for     56 degrees of freedom
# Null hypothesis probability =   6.218533e-01

Photon flux (15-150 keV)    in 58.96 sec: 0.158814 ( -0.022115  0.022192 ) ph/cm2/s
Energy fluence (15-150 keV)             : 5.30184e-07 ( -9.45211e-08  1.07775e-07 ) ergs/cm2
Band function

Spectral model in the Band function:
------------------------------------------------------------
Parameters  : value       lower 90%   higher 90%
alpha       : -0.946420   ( -0.958063   1.70235 )
beta        : -10.0000    ( 10   20 )
Epeak [keV] : 38.7512      ( -9.47633 25.4482 )
Norm@50keV   : 4.75634E-03    ( -0.00475651   0.0311153 )
------------------------------------------------------------
#Fit statistic : Chi-Squared =          52.14 using 59 PHA bins.
# Reduced chi-squared =         0.9479 for     55 degrees of freedom
# Null hypothesis probability =   5.847067e-01

Photon flux (15-150 keV)    in 58.96 sec:  (    ) ph/cm2/s
Energy fluence (15-150 keV)             : 5.30432e-07 ( 0  0 ) ergs/cm2
S(25-50 keV) vs. S(50-100 keV) plot

S(25-50 keV)  = 1.79e-07
S(50-100 keV) = 1.72e-07
T90 vs. Hardness ratio plot

T90                                   = 49.8719999194145 sec.
Hardness ratio (energy fluence ratio) = 0.960894
Color vs. Color plot

Count Ratio  (25-50 keV) / (15-25 keV) = 1.08089
Count Ratio (50-100 keV) / (15-25 keV) = 0.439557
Mask shadow pattern

IMX = -1.365559274131149E-01, IMY = -3.405622276047429E-01
TIME vs. PHA plot around the trigger time

Blue+Cyan dotted lines: Time interval of the scaled map
From 0.000000 to 16.384000
TIME vs. DetID plot around the trigger time

Blue+Cyan dotted lines: Time interval of the scaled map
From 0.000000 to 16.384000
100 us light curve (15-350 keV)

Blue+Cyan dotted lines: Time interval of the scaled map
From 0.000000 to 16.384000
Spacecraft aspect plot

Bright source in the pre-burst/pre-slew/post-slew images
Pre-burst image of 15-350 keV band
Time interval of the image:
-239.936000 -3.284000

# RAcent  DECcent POSerr Theta    Phi  PeakCts   SNR AngSep     Name
#  [deg]    [deg]    ['] [deg]  [deg]                   [']
299.6037  35.2009    1.3  43.5  147.1   5.2074   8.6    0.7	Cyg X-1
308.0906  40.9639    3.2  39.3  158.9   1.4372   3.6    1.1	Cyg X-3
326.1802  38.1588   13.3  26.8  171.2   0.1924   0.9    9.8	Cyg X-2
348.1354 -28.7665    3.0  45.1   16.8   1.5232   3.9 ------	UNKNOWN
333.0485  -0.0235    2.2  19.2   56.1   1.2143   5.2 ------	UNKNOWN
357.2748 -26.3206    2.3  44.5    4.8   1.7691   5.0 ------	UNKNOWN
Pre-slew background subtracted image of 15-350 keV band
Time interval of the image:
-3.284000 55.676000

# RAcent  DECcent POSerr Theta    Phi  PeakCts   SNR AngSep     Name
#  [deg]    [deg]    ['] [deg]  [deg]                   [']
299.6385  35.2033    4.9  43.4  147.1   0.5786   2.4    2.4	Cyg X-1
308.1002  40.7514    7.9  39.2  158.6  -0.2212  -1.5   12.1	Cyg X-3
326.0575  38.4424   11.9  27.1  171.4   0.0966   1.0    9.0	Cyg X-2
322.6360  14.8961    1.0  20.1  111.8   1.1290  11.1 ------	UNKNOWN
296.2171  62.7380    2.5  56.9  178.8   2.4376   4.6 ------	UNKNOWN
358.5949 -13.8842    2.2  33.5   -4.7   0.5700   5.2 ------	UNKNOWN
 20.4564 -26.1890    2.6  55.5  -18.3   1.2941   4.3 ------	UNKNOWN
 21.1069  -5.8838    1.9  43.2  -39.9   1.0273   6.1 ------	UNKNOWN
Post-slew image of 15-350 keV band
Time interval of the image:
114.564580 962.097400

# RAcent  DECcent POSerr Theta    Phi  PeakCts   SNR AngSep     Name
#  [deg]    [deg]    ['] [deg]  [deg]                   [']
288.8101  10.9509    0.6  33.2  119.5  20.7546  18.4    0.8	GRS 1915+105
299.5887  35.2025    0.3  29.0  170.9  25.4872  39.0    0.1	Cyg X-1
308.1329  40.9619    1.3  28.9 -170.8   5.4914   9.2    1.2	Cyg X-3
326.1003  38.1466    9.6  23.4 -140.9   0.7087   1.2   11.0	Cyg X-2
293.1212 -11.6990    3.7  39.6   81.6   8.0152   3.1 ------	UNKNOWN
Plot creation:
Sat May 30 13:19:58 EDT 2015