Special notes of this burst
Image
Pre-slew 15.0-350.0 keV image (Event data)

#   RAcent    DECcent   POSerr    Theta     Phi              Peak Cts       SNR   Name
   27.0990   -39.2494   0.0145    34.1475    37.3346         1.4865868     13.304 TRIG_00602080

Foreground time interval of the image:
 32.308  72.701 (delta_t =  40.393 [sec])
Background time interval of the image:
-399.899 -380.879 (delta_t =  19.021 [sec])
-239.000  32.308 (delta_t = 271.308 [sec])
Lightcurves
Notes:
- 1) The mask-weighted light curves are using the flight position.
- 2) Multiple plots of different time binning/intervals are shown to cover all scenarios of short/long GRBs, rate/image triggers, and real/false positives.
- 3) For all the mask-weighted lightcurves, the y-axis units are counts/sec/det where a det is 0.4 x 0.4 = 0.16 sq cm.
- 4) The verticle lines correspond to following: green dotted lines are T50 interval, black dotted lines are T90 interval, blue solid line(s) is a spacecraft slew start time, and orange solid line(s) is a spacecraft slew end time.
- 5) Time of each bin is in the middle of the bin.
1 s binning
From T0-310 s to T0+310 s

From T100_start - 20 s to T100_end + 30 s
Full time interval

64 ms binning
Full time interval
From T100_start to T100_end

From T0-5 sec to T0+5 sec

16 ms binning
From T100_start-5 s to T100_start+5 s
Blue+Cyan dotted lines: Time interval of the scaled map
From 0.000000 to 64.000000
8 ms binning
From T100_start-3 s to T100_start+3 s
Blue+Cyan dotted lines: Time interval of the scaled map
From 0.000000 to 64.000000
2 ms binning
From T100_start-1 s to T100_start+1 s

Blue+Cyan dotted lines: Time interval of the scaled map
From 0.000000 to 64.000000
SN=5 or 10 sec. binning (whichever binning is satisfied first)
SN=5 or 10 sec. binning (T < 200 sec)
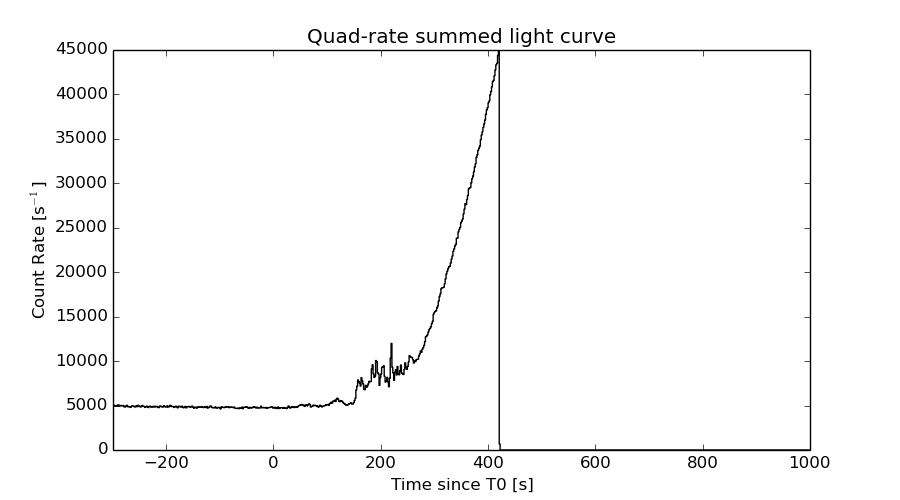
Quad-rate summed light curves (from T0-300s to T0+1000s)
Spectral Evolution

Spectra
Notes:
- 1) The fitting includes the systematic errors.
- 2) When the burst includes telescope slew time periods, the fitting uses an average response file made from multiple 5-s response files through out the slew time plus single time preiod for the non-slew times, and weighted by the total counts in the corresponding time period using addrmf. An average response file is needed becuase a spectral fit using the pre-slew DRM will introduce some errors in both a spectral shape and a normalization if the PHA file contains a lot of the slew/post-slew time interval.
- 3) For fits to more complicated models (e.g. a power-law over a cutoff power-law), the BAT team has decided to require a chi-square improvement of more than 6 for each extra dof.
Time averaged spectrum fit using the average DRM
Power-law model
Time interval is from   32.308 sec. to  335.988 sec.

Spectral model in power-law:
------------------------------------------------------------
Parameters  : value       lower 90%   higher 90%
Photon index: 1.55714     ( -0.0335867   0.0335458 )
Norm@50keV  : 7.43143E-03    ( -0.000124101   0.000124056 )
------------------------------------------------------------
#Fit statistic : Chi-Squared =          39.02 using 59 PHA bins.
# Reduced chi-squared =         0.6845 for     57 degrees of freedom
# Null hypothesis probability =   9.670312e-01

Photon flux (15-150 keV)    in 303.7 sec: 0.942730 ( -0.0190928  0.0191792 ) ph/cm2/s
Energy fluence (15-150 keV)             : 2.12256e-05 ( -3.57005e-07  3.57166e-07 ) ergs/cm2
Cutoff power-law model

Time interval is from   32.308 sec. to  335.988 sec.
Spectral model in the cutoff power-law:
------------------------------------------------------------
Parameters  : value       lower 90%   higher 90%
Photon index: 1.55458     ( -0.135843   0.0413743 )
Epeak [keV] : 9999.99      (   )
Norm@50keV  : 7.45090E-03    ( -0.000123719   0.000123596 )
------------------------------------------------------------
#Fit statistic : Chi-Squared =          39.01 using 59 PHA bins.
# Reduced chi-squared =         0.6966 for     56 degrees of freedom
# Null hypothesis probability =   9.590193e-01

Photon flux (15-150 keV)    in 303.7 sec: 0.940693 ( -0.017827  0.020529 ) ph/cm2/s
Energy fluence (15-150 keV)             : 2.12346e-05 ( -3.52656e-07  3.52262e-07 ) ergs/cm2
Band function

Time interval is from   32.308 sec. to  335.988 sec.

Spectral model in the Band function:
------------------------------------------------------------
Parameters  : value       lower 90%   higher 90%
alpha       : -1.06990   ( 1.0699   6.02045 )
beta        : -1.57476    ( 1.57476   0.0435644 )
Epeak [keV] : 63.3275      ( -63.3275 -63.3275 )
Norm@50keV   : 1.49664E-02    ( -0.008289   0 )
------------------------------------------------------------
#Fit statistic : Chi-Squared =          37.66 using 59 PHA bins.
# Reduced chi-squared =         0.6847 for     55 degrees of freedom
# Null hypothesis probability =   9.643203e-01

Photon flux (15-150 keV)    in 303.7 sec:  (    ) ph/cm2/s
Energy fluence (15-150 keV)             : 0 ( 0  0 ) ergs/cm2
Single BB

Spectral model blackbody:
------------------------------------------------------------
Parameters  : value    Lower 90%  Upper 90%
kT [keV]    : 17.3739  (  )
R^2/D10^2   : 5.87668E-02  (   )
(R is the radius in km and D10 is the distance to the source in units of 10 kpc)
------------------------------------------------------------
#Fit statistic : Chi-Squared =         836.35 using 59 PHA bins.
# Reduced chi-squared =         14.673 for     57 degrees of freedom
# Null hypothesis probability =  5.586427e-139

Energy  Fluence     90% Error
[keV]   [erg/cm2]   [erg/cm2]
15- 25  1.090e-06   3.736e-08
25- 50  4.908e-06   1.245e-07
50-150  1.065e-05   3.067e-07
15-150  1.665e-05   2.931e-07
Thermal bremsstrahlung (OTTB)

Spectral model: thermal bremsstrahlung
------------------------------------------------------------
Parameters  : value         Lower 90%    Upper 90%
kT [keV]    : 200.000       (      )
Norm        : 3.80978       (-0.0632688     0.0632665)
------------------------------------------------------------
#Fit statistic : Chi-Squared =          60.55 using 59 PHA bins.
# Reduced chi-squared =          1.062 for     57 degrees of freedom
# Null hypothesis probability =   3.490115e-01

Energy  Fluence     90% Error
[keV]   [erg/cm2]   [erg/cm2]
15- 25  2.882e-06   5.983e-08
25- 50  5.544e-06   1.169e-07
50-150  1.216e-05   2.369e-07
15-150  2.059e-05   3.887e-07
Double BB

Spectral model: bbodyrad<1> + bbodyrad<2>
------------------------------------------------------------
Parameters  : value         Lower 90%    Upper 90%
kT1 [keV]   : 7.86438        (-0.459807      0.476368)
R1^2/D10^2  : 0.662993        (-0.123556      0.160473)
kT2 [keV]   : 30.7186        (-1.95432      2.32939)
R2^2/D10^2  : 6.55240E-03    (-0.00145204   0.00170632)
------------------------------------------------------------
#Fit statistic : Chi-Squared =          42.23 using 59 PHA bins.
# Reduced chi-squared =         0.7678 for     55 degrees of freedom
# Null hypothesis probability =   8.965575e-01

Energy  Fluence     90% Error
[keV]   [erg/cm2]   [erg/cm2]
15- 25  2.512e-06   1.517e-07
25- 50  5.579e-06   1.731e-07
50-150  1.284e-05   4.783e-07
15-150  2.093e-05   5.953e-07
Peak spectrum fit
Power-law model

Time interval is from  219.520 sec. to  220.520 sec.

Spectral model in power-law:
------------------------------------------------------------
Parameters  : value       lower 90%   higher 90%
Photon index: 1.31991     ( -0.0885364   0.0888283 )
Norm@50keV  : 3.50139E-02    ( -0.00174747   0.00174548 )
------------------------------------------------------------
#Fit statistic : Chi-Squared =          52.57 using 59 PHA bins.
# Reduced chi-squared =         0.9224 for     57 degrees of freedom
# Null hypothesis probability =   6.416465e-01

Photon flux (15-150 keV)    in 1 sec: 4.19296 ( -0.213025  0.213221 ) ph/cm2/s
Energy fluence (15-150 keV)             : 3.44351e-07 ( -1.93199e-08  1.94066e-08 ) ergs/cm2
Cutoff power-law model

Time interval is from  219.520 sec. to  220.520 sec.
Spectral model in the cutoff power-law:
------------------------------------------------------------
Parameters  : value       lower 90%   higher 90%
Photon index: 1.05918     ( -0.372743   0.298051 )
Epeak [keV] : 194.308      ( -84.0484 -194.306 )
Norm@50keV  : 4.65320E-02    ( -0.0124915   0.0225767 )
------------------------------------------------------------
#Fit statistic : Chi-Squared =          50.94 using 59 PHA bins.
# Reduced chi-squared =         0.9096 for     56 degrees of freedom
# Null hypothesis probability =   6.664640e-01

Photon flux (15-150 keV)    in 1 sec: 4.13871 ( -0.22447  0.22434 ) ph/cm2/s
Energy fluence (15-150 keV)             : 3.38927e-07 ( -2.0921e-08  2.0824e-08 ) ergs/cm2
Band function

Time interval is from  219.520 sec. to  220.520 sec.

Spectral model in the Band function:
------------------------------------------------------------
Parameters  : value       lower 90%   higher 90%
alpha       : -1.05386   ( -0.200615   0.34215 )
beta        : -9.34994    ( 9.36844   19.3684 )
Epeak [keV] : 193.780      ( -71.6285 -193.736 )
Norm@50keV   : 4.66494E-02    ( -0.00875441   0.0105394 )
------------------------------------------------------------
#Fit statistic : Chi-Squared =          50.94 using 59 PHA bins.
# Reduced chi-squared =         0.9262 for     55 degrees of freedom
# Null hypothesis probability =   6.304644e-01

Photon flux (15-150 keV)    in 1 sec:  (    ) ph/cm2/s
Energy fluence (15-150 keV)             : 0 ( 0  0 ) ergs/cm2
Single BB

Spectral model blackbody:
------------------------------------------------------------
Parameters  : value    Lower 90%  Upper 90%
kT [keV]    : 17.5070  (  )
R^2/D10^2   : 0.290802  (   )
(R is the radius in km and D10 is the distance to the source in units of 10 kpc)
------------------------------------------------------------
#Fit statistic : Chi-Squared =         126.30 using 59 PHA bins.
# Reduced chi-squared =         2.2157 for     57 degrees of freedom
# Null hypothesis probability =   3.682502e-07

Energy  Fluence     90% Error
[keV]   [erg/cm2]   [erg/cm2]
15- 25  1.800e-08   1.810e-09
25- 50  8.150e-08   5.170e-09
50-150  1.799e-07   1.735e-08
15-150  2.795e-07   1.795e-08
Thermal bremsstrahlung (OTTB)

Spectral model: thermal bremsstrahlung
------------------------------------------------------------
Parameters  : value         Lower 90%    Upper 90%
kT [keV]    : 200.000       (      )
Norm        : 17.2950       (-0.864356     0.864268)
------------------------------------------------------------
#Fit statistic : Chi-Squared =          71.28 using 59 PHA bins.
# Reduced chi-squared =          1.250 for     57 degrees of freedom
# Null hypothesis probability =   9.669939e-02

Energy  Fluence     90% Error
[keV]   [erg/cm2]   [erg/cm2]
15- 25  4.306e-08   2.260e-09
25- 50  8.284e-08   4.265e-09
50-150  1.817e-07   1.060e-08
15-150  3.076e-07   1.925e-08
Double BB
Spectral model: bbodyrad<1> + bbodyrad<2>
------------------------------------------------------------
Parameters  : value         Lower 90%    Upper 90%
kT1 [keV]   : 5.89791        (-1.5102      2.02928)
R1^2/D10^2  : 6.16960        (-3.82999      14.1173)
kT2 [keV]   : 24.5820        (-3.13585      5.19027)
R2^2/D10^2  : 8.13318E-02    (-0.0404004   0.0514869)
------------------------------------------------------------
#Fit statistic : Chi-Squared =          55.16 using 59 PHA bins.
# Reduced chi-squared =          1.003 for     55 degrees of freedom
# Null hypothesis probability =   4.686757e-01

Energy  Fluence     90% Error
[keV]   [erg/cm2]   [erg/cm2]
15- 25  3.642e-08   9.375e-09
25- 50  7.515e-08   1.161e-08
50-150  2.198e-07   2.890e-08
15-150  3.314e-07   4.045e-08
Pre-slew spectrum (Pre-slew PHA with pre-slew DRM)
Power-law model

Spectral model in power-law:
------------------------------------------------------------
Parameters  : value       lower 90%   higher 90%
Photon index: 1.38688     ( -0.185274   0.184366 )
Norm@50keV  : 2.83358E-03    ( -0.000291514   0.000290899 )
------------------------------------------------------------
#Fit statistic : Chi-Squared =          58.39 using 59 PHA bins.
# Reduced chi-squared =          1.024 for     57 degrees of freedom
# Null hypothesis probability =   4.241922e-01

Photon flux (15-150 keV)    in 40.39 sec: 0.344064 ( -0.0367609  0.0368778 ) ph/cm2/s
Energy fluence (15-150 keV)             : 1.10888e-06 ( -1.24804e-07  1.25557e-07 ) ergs/cm2
Cutoff power-law model

Spectral model in the cutoff power-law:
------------------------------------------------------------
Parameters  : value       lower 90%   higher 90%
Photon index: 2.01294     (     )
Epeak [keV] : 5.06679      (   )
Norm@50keV  : 1.20176E-03    (     )
------------------------------------------------------------
#Fit statistic : Chi-Squared =          58.03 using 59 PHA bins.
# Reduced chi-squared =          1.036 for     56 degrees of freedom
# Null hypothesis probability =   4.003885e-01

Photon flux (15-150 keV)    in 40.39 sec: 0.343871 ( -0.0366  0.036509 ) ph/cm2/s
Energy fluence (15-150 keV)             : 1.10858e-06 ( -1.251e-07  1.24668e-07 ) ergs/cm2
Band function

Spectral model in the Band function:
------------------------------------------------------------
Parameters  : value       lower 90%   higher 90%
alpha       : -1.14979   ( 1.14979   1.14979 )
beta        : -1.38687    ( -0.184316   0.185376 )
Epeak [keV] : 25.9758      ( -25.9758 -25.9758 )
Norm@50keV   : 5.67834E-03    ( -0.00277718   0.0518858 )
------------------------------------------------------------
#Fit statistic : Chi-Squared =          58.39 using 59 PHA bins.
# Reduced chi-squared =          1.062 for     55 degrees of freedom
# Null hypothesis probability =   3.520519e-01

Photon flux (15-150 keV)    in 40.39 sec:  (    ) ph/cm2/s
Energy fluence (15-150 keV)             : 0 ( 0  0 ) ergs/cm2
S(25-50 keV) vs. S(50-100 keV) plot
S(25-50 keV)  = 5.40e-06
S(50-100 keV) = 7.33e-06
T90 vs. Hardness ratio plot
T90                                   = 233.047999978065 sec.
Hardness ratio (energy fluence ratio) = 1.35741
Color vs. Color plot
Count Ratio  (25-50 keV) / (15-25 keV) = 1.29656
Count Ratio (50-100 keV) / (15-25 keV) = 0.933118
Mask shadow pattern
IMX = 5.392903072956995E-01, IMY = -4.113437548703612E-01
TIME vs. PHA plot around the trigger time

Blue+Cyan dotted lines: Time interval of the scaled map
From 0.000000 to 64.000000
TIME vs. DetID plot around the trigger time
Blue+Cyan dotted lines: Time interval of the scaled map
From 0.000000 to 64.000000
100 us light curve (15-350 keV)

Blue+Cyan dotted lines: Time interval of the scaled map
From 0.000000 to 64.000000
Spacecraft aspect plot

Bright source in the pre-burst/pre-slew/post-slew images
Pre-burst image of 15-350 keV band
Time interval of the image:
-399.899410 -380.878800
-239.000000 32.308000

# RAcent  DECcent POSerr Theta    Phi  PeakCts   SNR AngSep     Name
#  [deg]    [deg]    ['] [deg]  [deg]                   [']
 28.5877 -56.5679    2.8  51.0   31.2   5.2330   4.2 ------	UNKNOWN
352.5879  30.8539    2.5  54.3  162.0   6.2409   4.6 ------	UNKNOWN
 38.2576   0.6988    3.2   7.4 -123.2   0.7249   3.6 ------	UNKNOWN
 25.8410  52.4591    4.2  58.7 -159.2   4.9519   2.8 ------	UNKNOWN
Pre-slew background subtracted image of 15-350 keV band
Time interval of the image:
32.308000 72.700600

# RAcent  DECcent POSerr Theta    Phi  PeakCts   SNR AngSep     Name
#  [deg]    [deg]    ['] [deg]  [deg]                   [']
 27.0991 -39.2495    0.9  34.1   37.3   1.4861  13.3 ------	UNKNOWN
Post-slew image of 15-350 keV band
Time interval of the image:
127.900620 483.100000

# RAcent  DECcent POSerr Theta    Phi  PeakCts   SNR AngSep     Name
#  [deg]    [deg]    ['] [deg]  [deg]                   [']
 15.8778 -76.2744    5.2  37.4   40.9   8.8980   2.2 ------	UNKNOWN
116.3950 -67.3164    4.5  54.0    8.1  19.6127   2.6 ------	UNKNOWN
 27.1283 -39.2365    0.7   0.0 -132.0  33.1574  15.7 ------	UNKNOWN
107.4425 -46.4956    2.8  56.7  -17.7  39.9484   4.2 ------	UNKNOWN
Plot creation:
Sat May 30 13:18:39 EDT 2015