Special notes of this burst
Image
Pre-slew 15.0-350.0 keV image (Event data)

#   RAcent    DECcent   POSerr    Theta     Phi              Peak Cts       SNR   Name
  317.1528   -14.4123   0.0232    37.8436     4.4243         0.0616791      8.291 TRIG_00602278

Foreground time interval of the image:
 -0.024   0.128 (delta_t =   0.152 [sec])
Background time interval of the image:
-60.888  -0.024 (delta_t =  60.864 [sec])
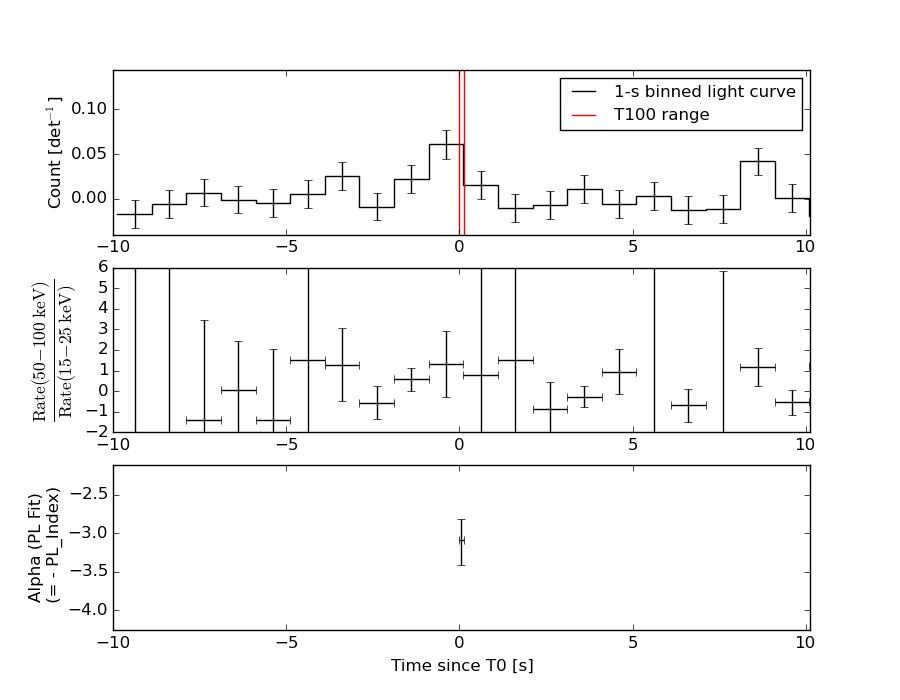
Lightcurves
Notes:
- 1) The mask-weighted light curves are using the flight position.
- 2) Multiple plots of different time binning/intervals are shown to cover all scenarios of short/long GRBs, rate/image triggers, and real/false positives.
- 3) For all the mask-weighted lightcurves, the y-axis units are counts/sec/det where a det is 0.4 x 0.4 = 0.16 sq cm.
- 4) The verticle lines correspond to following: green dotted lines are T50 interval, black dotted lines are T90 interval, blue solid line(s) is a spacecraft slew start time, and orange solid line(s) is a spacecraft slew end time.
- 5) Time of each bin is in the middle of the bin.
1 s binning
From T0-310 s to T0+310 s
From T100_start - 20 s to T100_end + 30 s
Full time interval
64 ms binning
Full time interval

From T100_start to T100_end
From T0-5 sec to T0+5 sec

16 ms binning
From T100_start-5 s to T100_start+5 s

Blue+Cyan dotted lines: Time interval of the scaled map
From 0.000000 to 0.064000
8 ms binning
From T100_start-3 s to T100_start+3 s
Blue+Cyan dotted lines: Time interval of the scaled map
From 0.000000 to 0.064000
2 ms binning
From T100_start-1 s to T100_start+1 s
Blue+Cyan dotted lines: Time interval of the scaled map
From 0.000000 to 0.064000
SN=5 or 10 sec. binning (whichever binning is satisfied first)
SN=5 or 10 sec. binning (T < 200 sec)
Quad-rate summed light curves (from T0-300s to T0+1000s)

Spectral Evolution
Spectra
Notes:
- 1) The fitting includes the systematic errors.
- 2) When the burst includes telescope slew time periods, the fitting uses an average response file made from multiple 5-s response files through out the slew time plus single time preiod for the non-slew times, and weighted by the total counts in the corresponding time period using addrmf. An average response file is needed becuase a spectral fit using the pre-slew DRM will introduce some errors in both a spectral shape and a normalization if the PHA file contains a lot of the slew/post-slew time interval.
- 3) For fits to more complicated models (e.g. a power-law over a cutoff power-law), the BAT team has decided to require a chi-square improvement of more than 6 for each extra dof.
Time averaged spectrum fit using the average DRM
Power-law model
Time interval is from   -0.024 sec. to    0.128 sec.

Spectral model in power-law:
------------------------------------------------------------
Parameters  : value       lower 90%   higher 90%
Photon index: 3.08003     ( -0.259657   0.328724 )
Norm@50keV  : 6.96933E-03    ( -0.00222968   0.00216681 )
------------------------------------------------------------
#Fit statistic : Chi-Squared =          64.67 using 59 PHA bins.
# Reduced chi-squared =          1.135 for     57 degrees of freedom
# Null hypothesis probability =   2.265469e-01

Photon flux (15-150 keV)    in 0.152 sec: 2.03191 ( -0.590726  0.591279 ) ph/cm2/s
Energy fluence (15-150 keV)             : 1.32194e-08 ( -3.73348e-09  3.73348e-09 ) ergs/cm2
Cutoff power-law model
Time interval is from   -0.024 sec. to    0.128 sec.
Spectral model in the cutoff power-law:
------------------------------------------------------------
Parameters  : value       lower 90%   higher 90%
Photon index: -1.23012     ( -2.3436   1.30788 )
Epeak [keV] : 44.2382      ( -7.70853 6.84055 )
Norm@50keV  : 1.25379    ( -1.25379   24.7178 )
------------------------------------------------------------
#Fit statistic : Chi-Squared =          35.95 using 59 PHA bins.
# Reduced chi-squared =         0.6419 for     56 degrees of freedom
# Null hypothesis probability =   9.829626e-01

Photon flux (15-150 keV)    in 0.152 sec: 2.98020 ( -0.65664  0.66218 ) ph/cm2/s
Energy fluence (15-150 keV)             : 2.69035e-08 ( -5.7681e-09  5.76308e-09 ) ergs/cm2
Band function

Time interval is from   -0.024 sec. to    0.128 sec.

Spectral model in the Band function:
------------------------------------------------------------
Parameters  : value       lower 90%   higher 90%
alpha       : 1.23426   ( -0.930117   3.48998 )
beta        : -10.0000    ( 10   10 )
Epeak [keV] : 44.2184      ( -6.96574 5.6013 )
Norm@50keV   : 1.26153    ( -1.2615   28.2269 )
------------------------------------------------------------
#Fit statistic : Chi-Squared =          35.95 using 59 PHA bins.
# Reduced chi-squared =         0.6536 for     55 degrees of freedom
# Null hypothesis probability =   9.781437e-01

Photon flux (15-150 keV)    in 0.152 sec:  (    ) ph/cm2/s
Energy fluence (15-150 keV)             : 0 ( 0  0 ) ergs/cm2
Single BB
Spectral model blackbody:
------------------------------------------------------------
Parameters  : value    Lower 90%  Upper 90%
kT [keV]    : 11.6335  (-1.98335  1.63469)
R^2/D10^2   : 0.961841  (-0.422992   0.974736)
(R is the radius in km and D10 is the distance to the source in units of 10 kpc)
------------------------------------------------------------
#Fit statistic : Chi-Squared =          36.17 using 59 PHA bins.
# Reduced chi-squared =         0.6345 for     57 degrees of freedom
# Null hypothesis probability =   9.858487e-01

Energy  Fluence     90% Error
[keV]   [erg/cm2]   [erg/cm2]
15- 25  4.172e-09   1.488e-09
25- 50  1.265e-08   3.349e-09
50-150  1.008e-08   3.773e-09
15-150  2.690e-08   6.703e-09
Thermal bremsstrahlung (OTTB)

Spectral model: thermal bremsstrahlung
------------------------------------------------------------
Parameters  : value         Lower 90%    Upper 90%
kT [keV]    : 34.6472       (-6.6213      6.54175)
Norm        : 20.8314       (-5.81605     6.57945)
------------------------------------------------------------
#Fit statistic : Chi-Squared =          47.37 using 59 PHA bins.
# Reduced chi-squared =         0.8311 for     57 degrees of freedom
# Null hypothesis probability =   8.146000e-01

Energy  Fluence     90% Error
[keV]   [erg/cm2]   [erg/cm2]
15- 25  6.888e-09   1.774e-09
25- 50  8.483e-09   1.987e-09
50-150  5.566e-09   1.816e-09
15-150  2.094e-08   4.925e-09
Double BB

Spectral model: bbodyrad<1> + bbodyrad<2>
------------------------------------------------------------
Parameters  : value         Lower 90%    Upper 90%
kT1 [keV]   : 7.72852        (-7.91984      52.362)
R1^2/D10^2  : 1.00167        (-0.99813      -0.99813)
kT2 [keV]   : 12.4759        (-12.5061      66.7192)
R2^2/D10^2  : 0.592510    (-0.584928   1.28888)
------------------------------------------------------------
#Fit statistic : Chi-Squared =          35.93 using 59 PHA bins.
# Reduced chi-squared =         0.6533 for     55 degrees of freedom
# Null hypothesis probability =   9.782736e-01

Energy  Fluence     90% Error
[keV]   [erg/cm2]   [erg/cm2]
15- 25  4.573e-09   7.472e-09
25- 50  1.242e-08   3.482e-08
50-150  1.000e-08   5.679e-08
15-150  2.699e-08   1.240e-07
Peak spectrum fit
Power-law model
Time interval is from   -0.446 sec. to    0.554 sec.

Spectral model in power-law:
------------------------------------------------------------
Parameters  : value       lower 90%   higher 90%
Photon index: 1.91468     ( -0.626963   0.728611 )
Norm@50keV  : 4.37652E-03    ( -0.00193998   0.00181035 )
------------------------------------------------------------
#Fit statistic : Chi-Squared =          37.19 using 59 PHA bins.
# Reduced chi-squared =         0.6524 for     57 degrees of freedom
# Null hypothesis probability =   9.804825e-01

Photon flux (15-150 keV)    in 1 sec: 0.632027 ( -0.224283  0.224475 ) ph/cm2/s
Energy fluence (15-150 keV)             : 4.02432e-08 ( -1.63336e-08  1.72285e-08 ) ergs/cm2
Cutoff power-law model
Time interval is from   -0.446 sec. to    0.554 sec.
Spectral model in the cutoff power-law:
------------------------------------------------------------
Parameters  : value       lower 90%   higher 90%
Photon index: 1.47957     ( -1.51731   1.34285 )
Epeak [keV] : 47.0926      (   )
Norm@50keV  : 8.00592E-03    (     )
------------------------------------------------------------
#Fit statistic : Chi-Squared =          37.16 using 59 PHA bins.
# Reduced chi-squared =         0.6636 for     56 degrees of freedom
# Null hypothesis probability =   9.753494e-01

Photon flux (15-150 keV)    in 1 sec: 0.625803 ( -0.22276  0.229328 ) ph/cm2/s
Energy fluence (15-150 keV)             : 3.86793e-08 ( -2.20989e-08  1.85839e-08 ) ergs/cm2
Band function
Time interval is from   -0.446 sec. to    0.554 sec.

Spectral model in the Band function:
------------------------------------------------------------
Parameters  : value       lower 90%   higher 90%
alpha       : 4.63044   ( -4.63044   -4.63044 )
beta        : -2.68724    ( 2.68724   1.14827 )
Epeak [keV] : 31.4257      ( -31.4257 61.2146 )
Norm@50keV   : 99.4644    ( -34.508   8.87602e+06 )
------------------------------------------------------------
#Fit statistic : Chi-Squared =          36.38 using 59 PHA bins.
# Reduced chi-squared =         0.6615 for     55 degrees of freedom
# Null hypothesis probability =   9.751152e-01

Photon flux (15-150 keV)    in 1 sec:  (    ) ph/cm2/s
Energy fluence (15-150 keV)             : 0 ( 0  0 ) ergs/cm2
Single BB
Spectral model blackbody:
------------------------------------------------------------
Parameters  : value    Lower 90%  Upper 90%
kT [keV]    : 8.96478  (-2.62416  4.22597)
R^2/D10^2   : 0.465509  (-0.465509   1.31921)
(R is the radius in km and D10 is the distance to the source in units of 10 kpc)
------------------------------------------------------------
#Fit statistic : Chi-Squared =          37.40 using 59 PHA bins.
# Reduced chi-squared =         0.6562 for     57 degrees of freedom
# Null hypothesis probability =   9.791856e-01

Energy  Fluence     90% Error
[keV]   [erg/cm2]   [erg/cm2]
15- 25  7.269e-09   4.450e-09
25- 50  1.536e-08   9.315e-09
50-150  5.788e-09   5.080e-09
15-150  2.841e-08   1.855e-08
Thermal bremsstrahlung (OTTB)
Spectral model: thermal bremsstrahlung
------------------------------------------------------------
Parameters  : value         Lower 90%    Upper 90%
kT [keV]    : 71.7316       (-71.7316      -71.7316)
Norm        : 3.10103       (-1.36832     2.86828)
------------------------------------------------------------
#Fit statistic : Chi-Squared =          37.16 using 59 PHA bins.
# Reduced chi-squared =         0.6519 for     57 degrees of freedom
# Null hypothesis probability =   9.806543e-01

Energy  Fluence     90% Error
[keV]   [erg/cm2]   [erg/cm2]
15- 25  7.976e-09   5.065e-09
25- 50  1.277e-08   8.085e-09
50-150  1.670e-08   1.434e-08
15-150  3.745e-08   2.782e-08
Double BB
Spectral model: bbodyrad<1> + bbodyrad<2>
------------------------------------------------------------
Parameters  : value         Lower 90%    Upper 90%
kT1 [keV]   : 0.784122        (-0.769934      12.3821)
R1^2/D10^2  : 6.61193E+06        (-1.25359e+07      -1.25359e+07)
kT2 [keV]   : 9.18128        (-2.7538      4.70011)
R2^2/D10^2  : 0.416977    (-0.335813   1.27549)
------------------------------------------------------------
#Fit statistic : Chi-Squared =          37.21 using 59 PHA bins.
# Reduced chi-squared =         0.6765 for     55 degrees of freedom
# Null hypothesis probability =   9.684467e-01

Energy  Fluence     90% Error
[keV]   [erg/cm2]   [erg/cm2]
15- 25  7.083e-09   4.406e-09
25- 50  1.515e-08   9.505e-09
50-150  6.142e-09   4.764e-09
15-150  2.838e-08   1.773e-08
Pre-slew spectrum (Pre-slew PHA with pre-slew DRM)
Power-law model

Spectral model in power-law:
------------------------------------------------------------
Parameters  : value       lower 90%   higher 90%
Photon index: 3.08003     ( -0.259657   0.328724 )
Norm@50keV  : 6.96933E-03    ( -0.00222968   0.00216681 )
------------------------------------------------------------
#Fit statistic : Chi-Squared =          64.67 using 59 PHA bins.
# Reduced chi-squared =          1.135 for     57 degrees of freedom
# Null hypothesis probability =   2.265469e-01

Photon flux (15-150 keV)    in 0.152 sec: 2.03191 ( -0.590726  0.591279 ) ph/cm2/s
Energy fluence (15-150 keV)             : 1.32194e-08 ( -3.73348e-09  3.73348e-09 ) ergs/cm2
Cutoff power-law model

Spectral model in the cutoff power-law:
------------------------------------------------------------
Parameters  : value       lower 90%   higher 90%
Photon index: -1.23012     ( -2.3436   1.30788 )
Epeak [keV] : 44.2382      ( -7.70853 6.84055 )
Norm@50keV  : 1.25379    ( -1.25379   24.7178 )
------------------------------------------------------------
#Fit statistic : Chi-Squared =          35.95 using 59 PHA bins.
# Reduced chi-squared =         0.6419 for     56 degrees of freedom
# Null hypothesis probability =   9.829626e-01

Photon flux (15-150 keV)    in 0.152 sec: 2.98020 ( -0.65664  0.66218 ) ph/cm2/s
Energy fluence (15-150 keV)             : 2.69035e-08 ( -5.7681e-09  5.76308e-09 ) ergs/cm2
Band function

Spectral model in the Band function:
------------------------------------------------------------
Parameters  : value       lower 90%   higher 90%
alpha       : 1.23426   ( -0.930117   3.48998 )
beta        : -10.0000    ( 10   10 )
Epeak [keV] : 44.2184      ( -6.96574 5.6013 )
Norm@50keV   : 1.26153    ( -1.2615   28.2269 )
------------------------------------------------------------
#Fit statistic : Chi-Squared =          35.95 using 59 PHA bins.
# Reduced chi-squared =         0.6536 for     55 degrees of freedom
# Null hypothesis probability =   9.781437e-01

Photon flux (15-150 keV)    in 0.152 sec:  (    ) ph/cm2/s
Energy fluence (15-150 keV)             : 0 ( 0  0 ) ergs/cm2
S(25-50 keV) vs. S(50-100 keV) plot

S(25-50 keV)  = 4.38e-09
S(50-100 keV) = 2.07e-09
T90 vs. Hardness ratio plot
T90                                   = 0.131999969482422 sec.
Hardness ratio (energy fluence ratio) = 0.472603
Color vs. Color plot

Count Ratio  (25-50 keV) / (15-25 keV) = 2.5406
Count Ratio (50-100 keV) / (15-25 keV) = 1.41118
Mask shadow pattern

IMX = 7.745847109252262E-01, IMY = -5.993151477292280E-02
TIME vs. PHA plot around the trigger time
Blue+Cyan dotted lines: Time interval of the scaled map
From 0.000000 to 0.064000
TIME vs. DetID plot around the trigger time
Blue+Cyan dotted lines: Time interval of the scaled map
From 0.000000 to 0.064000
100 us light curve (15-350 keV)
Blue+Cyan dotted lines: Time interval of the scaled map
From 0.000000 to 0.064000
Spacecraft aspect plot

Bright source in the pre-burst/pre-slew/post-slew images
Pre-burst image of 15-350 keV band
Time interval of the image:
-60.888000 -0.024000

# RAcent  DECcent POSerr Theta    Phi  PeakCts   SNR AngSep     Name
#  [deg]    [deg]    ['] [deg]  [deg]                   [']
254.4904  35.4566   11.6  39.6 -173.1   0.1378   1.0    7.0	Her X-1
268.4160  -1.4964    4.7  23.8  112.7   0.3031   2.5    3.9	SW J1753.5-0127
274.0066 -14.0382  887.3  29.0   83.8   0.0020   0.0    0.1	GX 17+2
285.0473 -24.8986  156.3  36.0   58.8  -0.0151  -0.1    1.5	HT1900.1-2455
288.7712  10.9466    0.7   0.0 -179.5   1.4041  17.1    1.6	GRS 1915+105
299.6115  35.2021    1.1  26.2 -106.7   1.2412  10.6    1.0	Cyg X-1
308.2024  40.9373    7.8  34.5 -100.7   0.2682   1.5    4.3	Cyg X-3
236.3446  12.0546    2.4  51.3  149.8   2.6231   4.9 ------	UNKNOWN
233.4307  41.9310    3.6  57.2 -173.7   1.5435   3.2 ------	UNKNOWN
332.0060   5.7111    2.4  43.0  -33.7   0.7815   4.9 ------	UNKNOWN
Pre-slew background subtracted image of 15-350 keV band
Time interval of the image:
-0.024000 0.128000

# RAcent  DECcent POSerr Theta    Phi  PeakCts   SNR AngSep     Name
#  [deg]    [deg]    ['] [deg]  [deg]                   [']
254.6235  35.2940    6.3  39.4 -173.2  -0.0126  -1.8    8.6	Her X-1
268.2098  -1.4397    5.8  23.9  113.1  -0.0130  -2.0    9.5	SW J1753.5-0127
274.0944 -14.1396    5.8  29.0   83.5   0.0175   2.0    8.1	GX 17+2
285.0568 -24.9145    6.7  36.0   58.8  -0.0208  -1.7    1.2	HT1900.1-2455
288.8495  10.8305    9.4   0.1   25.0  -0.0059  -1.2    7.5	GRS 1915+105
299.7647  35.2685   61.4  26.3 -106.5  -0.0012  -0.2    9.4	Cyg X-1
308.2895  41.0293   14.3  34.6 -100.7  -0.0080  -0.8    9.3	Cyg X-3
317.1529 -14.4123    1.4  37.8    4.4   0.0617   8.3 ------	UNKNOWN
262.5487  24.1879    3.0  28.2  174.5   0.0218   3.8 ------	UNKNOWN
303.7407  -0.6863    2.7  18.9    0.1   0.0203   4.3 ------	UNKNOWN
Post-slew image of 15-350 keV band
Time interval of the image:
76.412590 302.192000

# RAcent  DECcent POSerr Theta    Phi  PeakCts   SNR AngSep     Name
#  [deg]    [deg]    ['] [deg]  [deg]                   [']
285.1743 -24.7762    6.4  31.7   85.1  -0.7339  -1.8   11.5	HT1900.1-2455
288.8039  10.9506    1.0  37.9  149.7   4.6867  11.3    0.4	GRS 1915+105
299.5707  35.1951    1.4  52.4 -179.1   5.4394   8.0    1.0	Cyg X-1
308.1986  41.0115    3.8  56.1 -169.0   2.5994   3.1    5.3	Cyg X-3
326.2606  38.2063    8.0  53.3 -152.0  -1.1460  -1.5    8.1	Cyg X-2
312.2509 -27.3273    2.3  13.7   37.8   0.9908   5.0 ------	UNKNOWN
345.8748 -59.3524    2.6  49.6    0.3   1.9567   4.5 ------	UNKNOWN
  5.7405 -40.2812    2.8  49.5  -29.8   1.9192   4.1 ------	UNKNOWN
319.2864  44.1995    3.6  58.7 -159.1   4.8840   3.2 ------	UNKNOWN
Plot creation:
Sat May 30 13:16:42 EDT 2015