Special notes of this burst
Image
Pre-slew 15.0-350.0 keV image (Event data)

#   RAcent    DECcent   POSerr    Theta     Phi              Peak Cts       SNR   Name
   40.6700    -0.3789   0.0059    30.1014   170.3466         2.1455205     32.395 TRIG_00602803

Foreground time interval of the image:
 -1.240   9.933 (delta_t =  11.173 [sec])
Background time interval of the image:
-119.568  -1.240 (delta_t = 118.328 [sec])
Lightcurves
Notes:
- 1) The mask-weighted light curves are using the flight position.
- 2) Multiple plots of different time binning/intervals are shown to cover all scenarios of short/long GRBs, rate/image triggers, and real/false positives.
- 3) For all the mask-weighted lightcurves, the y-axis units are counts/sec/det where a det is 0.4 x 0.4 = 0.16 sq cm.
- 4) The verticle lines correspond to following: green dotted lines are T50 interval, black dotted lines are T90 interval, blue solid line(s) is a spacecraft slew start time, and orange solid line(s) is a spacecraft slew end time.
- 5) Time of each bin is in the middle of the bin.
1 s binning
From T0-310 s to T0+310 s
From T100_start - 20 s to T100_end + 30 s
Full time interval

64 ms binning
Full time interval
From T100_start to T100_end

From T0-5 sec to T0+5 sec

16 ms binning
From T100_start-5 s to T100_start+5 s
Blue+Cyan dotted lines: Time interval of the scaled map
From 0.000000 to 0.512000
8 ms binning
From T100_start-3 s to T100_start+3 s
Blue+Cyan dotted lines: Time interval of the scaled map
From 0.000000 to 0.512000
2 ms binning
From T100_start-1 s to T100_start+1 s
Blue+Cyan dotted lines: Time interval of the scaled map
From 0.000000 to 0.512000
SN=5 or 10 sec. binning (whichever binning is satisfied first)

SN=5 or 10 sec. binning (T < 200 sec)

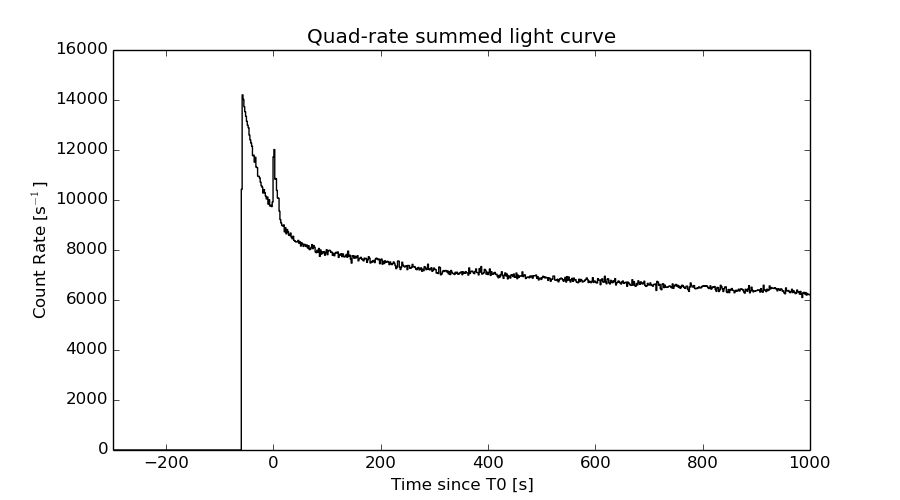
Quad-rate summed light curves (from T0-300s to T0+1000s)
Spectral Evolution

Spectra
Notes:
- 1) The fitting includes the systematic errors.
- 2) When the burst includes telescope slew time periods, the fitting uses an average response file made from multiple 5-s response files through out the slew time plus single time preiod for the non-slew times, and weighted by the total counts in the corresponding time period using addrmf. An average response file is needed becuase a spectral fit using the pre-slew DRM will introduce some errors in both a spectral shape and a normalization if the PHA file contains a lot of the slew/post-slew time interval.
- 3) For fits to more complicated models (e.g. a power-law over a cutoff power-law), the BAT team has decided to require a chi-square improvement of more than 6 for each extra dof.
Time averaged spectrum fit using the average DRM
Power-law model

Time interval is from   -1.240 sec. to   11.116 sec.

Spectral model in power-law:
------------------------------------------------------------
Parameters  : value       lower 90%   higher 90%
Photon index: 1.55602     ( -0.088314   0.0889895 )
Norm@50keV  : 1.14325E-02    ( -0.000577842   0.000575419 )
------------------------------------------------------------
#Fit statistic : Chi-Squared =          48.39 using 59 PHA bins.
# Reduced chi-squared =         0.8489 for     57 degrees of freedom
# Null hypothesis probability =   7.846148e-01

Photon flux (15-150 keV)    in 12.36 sec: 1.44982 ( -0.0708038  0.0708651 ) ph/cm2/s
Energy fluence (15-150 keV)             : 1.32914e-06 ( -7.36327e-08  7.41852e-08 ) ergs/cm2
Cutoff power-law model
Time interval is from   -1.240 sec. to   11.116 sec.
Spectral model in the cutoff power-law:
------------------------------------------------------------
Parameters  : value       lower 90%   higher 90%
Photon index: 1.14716     ( -0.38969   0.356066 )
Epeak [keV] : 100.066      ( -27.8379 284.553 )
Norm@50keV  : 1.86175E-02    ( -0.00630819   0.010788 )
------------------------------------------------------------
#Fit statistic : Chi-Squared =          44.50 using 59 PHA bins.
# Reduced chi-squared =         0.7947 for     56 degrees of freedom
# Null hypothesis probability =   8.657930e-01

Photon flux (15-150 keV)    in 12.36 sec: 1.41649 ( -0.0763  0.07623 ) ph/cm2/s
Energy fluence (15-150 keV)             : 1.27587e-06 ( -8.7206e-08  8.73234e-08 ) ergs/cm2
Band function

Time interval is from   -1.240 sec. to   11.116 sec.

Spectral model in the Band function:
------------------------------------------------------------
Parameters  : value       lower 90%   higher 90%
alpha       : -3.04789E-02   ( -0.811228   0.46579 )
beta        : -1.72920    ( 1.73693   0.168767 )
Epeak [keV] : 44.0780      ( -17.3579 46.7118 )
Norm@50keV   : 0.103375    ( -0.101315   376.337 )
------------------------------------------------------------
#Fit statistic : Chi-Squared =          42.14 using 59 PHA bins.
# Reduced chi-squared =         0.7662 for     55 degrees of freedom
# Null hypothesis probability =   8.983364e-01

Photon flux (15-150 keV)    in 12.36 sec:  (    ) ph/cm2/s
Energy fluence (15-150 keV)             : 1.28508e-06 ( -1.285e-06  -8.0497e-08 ) ergs/cm2
Single BB
Spectral model blackbody:
------------------------------------------------------------
Parameters  : value    Lower 90%  Upper 90%
kT [keV]    : 13.7070  (  )
R^2/D10^2   : 0.219065  (   )
(R is the radius in km and D10 is the distance to the source in units of 10 kpc)
------------------------------------------------------------
#Fit statistic : Chi-Squared =         119.22 using 59 PHA bins.
# Reduced chi-squared =         2.0916 for     57 degrees of freedom
# Null hypothesis probability =   2.706680e-06

Energy  Fluence     90% Error
[keV]   [erg/cm2]   [erg/cm2]
15- 25  1.076e-07   9.381e-09
25- 50  3.919e-07   2.355e-08
50-150  4.795e-07   5.241e-08
15-150  9.791e-07   5.890e-08
Thermal bremsstrahlung (OTTB)
Spectral model: thermal bremsstrahlung
------------------------------------------------------------
Parameters  : value         Lower 90%    Upper 90%
kT [keV]    : 195.467       (      )
Norm        : 5.89107       (-0.289386     0.313035)
------------------------------------------------------------
#Fit statistic : Chi-Squared =          44.63 using 59 PHA bins.
# Reduced chi-squared =         0.7830 for     57 degrees of freedom
# Null hypothesis probability =   8.831910e-01

Energy  Fluence     90% Error
[keV]   [erg/cm2]   [erg/cm2]
15- 25  1.815e-07   1.236e-08
25- 50  3.488e-07   3.566e-08
50-150  7.631e-07   2.245e-07
15-150  1.293e-06   2.788e-07
Double BB

Spectral model: bbodyrad<1> + bbodyrad<2>
------------------------------------------------------------
Parameters  : value         Lower 90%    Upper 90%
kT1 [keV]   : 7.79344        (-1.27077      1.33363)
R1^2/D10^2  : 1.08790        (-0.411378      0.810088)
kT2 [keV]   : 27.8450        (-5.6074      10.5583)
R2^2/D10^2  : 1.32160E-02    (-0.00870153   0.0172297)
------------------------------------------------------------
#Fit statistic : Chi-Squared =          43.44 using 59 PHA bins.
# Reduced chi-squared =         0.7897 for     55 degrees of freedom
# Null hypothesis probability =   8.699598e-01

Energy  Fluence     90% Error
[keV]   [erg/cm2]   [erg/cm2]
15- 25  1.655e-07   2.497e-08
25- 50  3.657e-07   5.451e-08
50-150  7.536e-07   2.576e-07
15-150  1.285e-06   3.311e-07
Peak spectrum fit
Power-law model

Time interval is from    0.944 sec. to    1.944 sec.

Spectral model in power-law:
------------------------------------------------------------
Parameters  : value       lower 90%   higher 90%
Photon index: 1.23400     ( -0.141705   0.141403 )
Norm@50keV  : 2.36362E-02    ( -0.00205498   0.00205325 )
------------------------------------------------------------
#Fit statistic : Chi-Squared =          59.68 using 59 PHA bins.
# Reduced chi-squared =          1.047 for     57 degrees of freedom
# Null hypothesis probability =   3.786134e-01

Photon flux (15-150 keV)    in 1 sec: 2.78843 ( -0.243606  0.243775 ) ph/cm2/s
Energy fluence (15-150 keV)             : 2.37556e-07 ( -2.32561e-08  2.34702e-08 ) ergs/cm2
Cutoff power-law model

Time interval is from    0.944 sec. to    1.944 sec.
Spectral model in the cutoff power-law:
------------------------------------------------------------
Parameters  : value       lower 90%   higher 90%
Photon index: -0.154358     ( -0.859718   0.71641 )
Epeak [keV] : 79.3900      ( -13.4203 31.9103 )
Norm@50keV  : 0.113617    ( -0.0620511   0.176578 )
------------------------------------------------------------
#Fit statistic : Chi-Squared =          47.07 using 59 PHA bins.
# Reduced chi-squared =         0.8405 for     56 degrees of freedom
# Null hypothesis probability =   7.966457e-01

Photon flux (15-150 keV)    in 1 sec: 2.64122 ( -0.25555  0.25516 ) ph/cm2/s
Energy fluence (15-150 keV)             : 2.1537e-07 ( -2.5228e-08  2.592e-08 ) ergs/cm2
Band function

Time interval is from    0.944 sec. to    1.944 sec.

Spectral model in the Band function:
------------------------------------------------------------
Parameters  : value       lower 90%   higher 90%
alpha       : 0.154532   ( -0.565626   0.626343 )
beta        : -10.00000    ( 10   20 )
Epeak [keV] : 79.3750      ( -11.4015 31.91 )
Norm@50keV   : 0.113652    (     )
------------------------------------------------------------
#Fit statistic : Chi-Squared =          47.07 using 59 PHA bins.
# Reduced chi-squared =         0.8558 for     55 degrees of freedom
# Null hypothesis probability =   7.678185e-01

Photon flux (15-150 keV)    in 1 sec:  (    ) ph/cm2/s
Energy fluence (15-150 keV)             : 0 ( 0  0 ) ergs/cm2
Single BB
Spectral model blackbody:
------------------------------------------------------------
Parameters  : value    Lower 90%  Upper 90%
kT [keV]    : 17.0218  (-1.5622  1.77449)
R^2/D10^2   : 0.226487  (-0.0645399   0.0870606)
(R is the radius in km and D10 is the distance to the source in units of 10 kpc)
------------------------------------------------------------
#Fit statistic : Chi-Squared =          52.57 using 59 PHA bins.
# Reduced chi-squared =         0.9223 for     57 degrees of freedom
# Null hypothesis probability =   6.417259e-01

Energy  Fluence     90% Error
[keV]   [erg/cm2]   [erg/cm2]
15- 25  1.336e-08   2.060e-09
25- 50  5.917e-08   6.550e-09
50-150  1.225e-07   1.882e-08
15-150  1.950e-07   2.270e-08
Thermal bremsstrahlung (OTTB)
Spectral model: thermal bremsstrahlung
------------------------------------------------------------
Parameters  : value         Lower 90%    Upper 90%
kT [keV]    : 200.000       (      )
Norm        : 11.4287       (-0.999227     0.999196)
------------------------------------------------------------
#Fit statistic : Chi-Squared =          67.77 using 59 PHA bins.
# Reduced chi-squared =          1.189 for     57 degrees of freedom
# Null hypothesis probability =   1.554982e-01

Energy  Fluence     90% Error
[keV]   [erg/cm2]   [erg/cm2]
15- 25  2.846e-08   3.270e-09
25- 50  5.475e-08   2.600e-08
50-150  1.201e-07   6.020e-08
15-150  2.033e-07   7.924e-08
Double BB
Spectral model: bbodyrad<1> + bbodyrad<2>
------------------------------------------------------------
Parameters  : value         Lower 90%    Upper 90%
kT1 [keV]   : 6.81040        (-4.61746      -6.82116)
R1^2/D10^2  : 1.34560        (-1.11641      6.16182)
kT2 [keV]   : 20.2246        (-3.47119      -20.2399)
R2^2/D10^2  : 0.112053    (-0.111161   0.100395)
------------------------------------------------------------
#Fit statistic : Chi-Squared =          47.22 using 59 PHA bins.
# Reduced chi-squared =         0.8585 for     55 degrees of freedom
# Null hypothesis probability =   7.630229e-01

Energy  Fluence     90% Error
[keV]   [erg/cm2]   [erg/cm2]
15- 25  1.853e-08   9.427e-09
25- 50  5.677e-08   2.426e-08
50-150  1.359e-07   6.999e-08
15-150  2.112e-07   1.022e-07
Pre-slew spectrum (Pre-slew PHA with pre-slew DRM)
Power-law model
Spectral model in power-law:
------------------------------------------------------------
Parameters  : value       lower 90%   higher 90%
Photon index: 1.55025     ( -0.0890211   0.0897432 )
Norm@50keV  : 1.18909E-02    ( -0.00060984   0.00060722 )
------------------------------------------------------------
#Fit statistic : Chi-Squared =          54.88 using 59 PHA bins.
# Reduced chi-squared =         0.9628 for     57 degrees of freedom
# Null hypothesis probability =   5.550097e-01

Photon flux (15-150 keV)    in 11.17 sec: 1.50543 ( -0.0744986  0.074562 ) ph/cm2/s
Energy fluence (15-150 keV)             : 1.25035e-06 ( -7.03573e-08  7.08959e-08 ) ergs/cm2
Cutoff power-law model
Spectral model in the cutoff power-law:
------------------------------------------------------------
Parameters  : value       lower 90%   higher 90%
Photon index: 1.07735     ( -0.401515   0.365446 )
Epeak [keV] : 93.4688      ( -23.3222 140.295 )
Norm@50keV  : 2.09111E-02    ( -0.00724476   0.0125736 )
------------------------------------------------------------
#Fit statistic : Chi-Squared =          49.88 using 59 PHA bins.
# Reduced chi-squared =         0.8908 for     56 degrees of freedom
# Null hypothesis probability =   7.042798e-01

Photon flux (15-150 keV)    in 11.17 sec: 1.46611 ( -0.0802  0.08013 ) ph/cm2/s
Energy fluence (15-150 keV)             : 1.19289e-06 ( -8.30612e-08  8.33617e-08 ) ergs/cm2
Band function

Spectral model in the Band function:
------------------------------------------------------------
Parameters  : value       lower 90%   higher 90%
alpha       : -5.55489E-02   ( -0.866675   0.437012 )
beta        : -1.73860    ( 1.74915   0.177929 )
Epeak [keV] : 45.3000      ( -25.4119 82.218 )
Norm@50keV   : 0.100546    ( -0.0997952   352.822 )
------------------------------------------------------------
#Fit statistic : Chi-Squared =          48.06 using 59 PHA bins.
# Reduced chi-squared =         0.8737 for     55 degrees of freedom
# Null hypothesis probability =   7.349613e-01

Photon flux (15-150 keV)    in 11.17 sec:  (    ) ph/cm2/s
Energy fluence (15-150 keV)             : 0 ( 0  0 ) ergs/cm2
S(25-50 keV) vs. S(50-100 keV) plot

S(25-50 keV)  = 3.38e-07
S(50-100 keV) = 4.59e-07
T90 vs. Hardness ratio plot

T90                                   = 10.539999961853 sec.
Hardness ratio (energy fluence ratio) = 1.35799
Color vs. Color plot

Count Ratio  (25-50 keV) / (15-25 keV) = 1.44142
Count Ratio (50-100 keV) / (15-25 keV) = 1.04865
Mask shadow pattern
IMX = -5.715028141719019E-01, IMY = -9.721046641122040E-02
TIME vs. PHA plot around the trigger time

Blue+Cyan dotted lines: Time interval of the scaled map
From 0.000000 to 0.512000
TIME vs. DetID plot around the trigger time

Blue+Cyan dotted lines: Time interval of the scaled map
From 0.000000 to 0.512000
100 us light curve (15-350 keV)
Blue+Cyan dotted lines: Time interval of the scaled map
From 0.000000 to 0.512000
Spacecraft aspect plot

Bright source in the pre-burst/pre-slew/post-slew images
Pre-burst image of 15-350 keV band
Time interval of the image:
-119.568000 -1.240000

# RAcent  DECcent POSerr Theta    Phi  PeakCts   SNR AngSep     Name
#  [deg]    [deg]    ['] [deg]  [deg]                   [']
 83.6482  21.9283    2.9  40.3 -102.5   3.1947   4.0    5.2	Crab
102.3511 -59.1260    2.5  51.1   31.4   4.4999   4.6 ------	UNKNOWN
112.6510  -1.2367    2.6  46.8  -49.1   3.8537   4.4 ------	UNKNOWN
Pre-slew background subtracted image of 15-350 keV band
Time interval of the image:
-1.240000 9.932590

# RAcent  DECcent POSerr Theta    Phi  PeakCts   SNR AngSep     Name
#  [deg]    [deg]    ['] [deg]  [deg]                   [']
 83.6458  21.9864    5.3  40.3 -102.6   0.4499   2.2    1.8	Crab
 65.7678 -47.0971    2.2  32.1   55.6   0.4777   5.2 ------	UNKNOWN
 40.6700  -0.3789    0.4  30.1  170.3   2.1455  32.4 ------	UNKNOWN
Post-slew image of 15-350 keV band
Time interval of the image:
66.532600 327.532590

# RAcent  DECcent POSerr Theta    Phi  PeakCts   SNR AngSep     Name
#  [deg]    [deg]    ['] [deg]  [deg]                   [']
 48.6106 -42.8074    2.4  43.0   19.0   2.3994   4.8 ------	UNKNOWN
  3.6074  36.5215    2.0  50.4  168.7   5.0595   5.9 ------	UNKNOWN
 45.8192 -19.7464    2.3  20.0   13.2   1.3002   4.9 ------	UNKNOWN
 43.9640   5.3956    2.5   6.7 -122.7   1.1450   4.6 ------	UNKNOWN
 76.7819  -5.7507    2.8  36.5  -53.2   1.7120   4.1 ------	UNKNOWN
 92.7328 -30.1708    3.5  57.7  -26.2   5.3321   3.3 ------	UNKNOWN
 50.6637  54.1911    3.7  55.2 -145.3   5.1667   3.2 ------	UNKNOWN
Plot creation:
Sat May 30 13:13:42 EDT 2015