Click here for the BAT GCN circular template
Image
Pre-slew 15.0-350.0 keV image (Event data)

#   RAcent    DECcent   POSerr    Theta     Phi              Peak Cts       SNR   Name
   13.0103    45.1025   0.0125    54.6259  -169.2392         3.6912900     15.364 TRIG_00603243

Foreground time interval of the image:
 -2.524  30.621 (delta_t =  33.145 [sec])
Background time interval of the image:
-149.379  -2.524 (delta_t = 146.855 [sec])
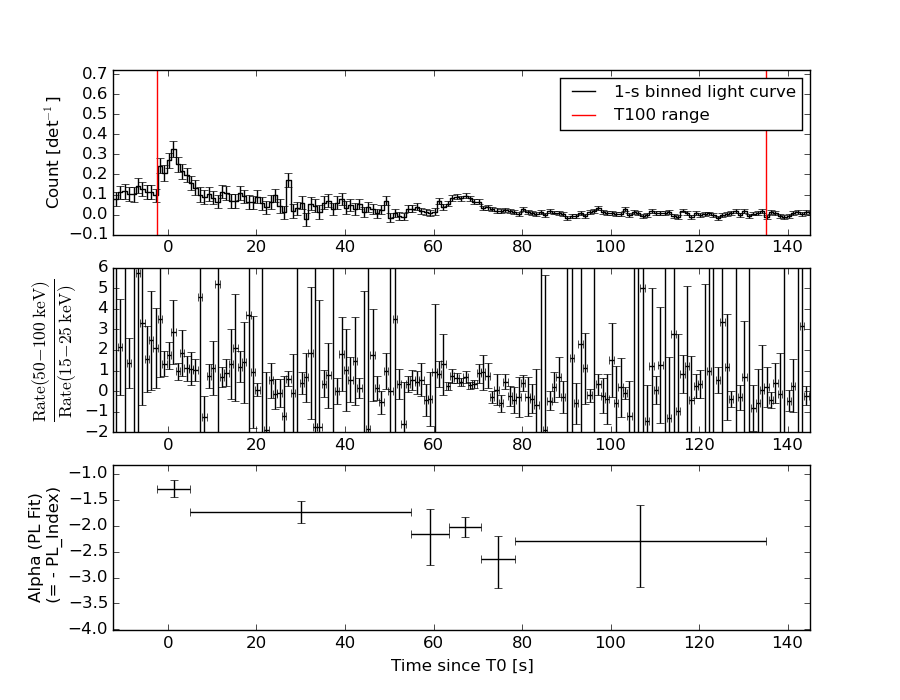
Lightcurves
Notes:
- 1) The mask-weighted light curves are using the flight position.
- 2) Multiple plots of different time binning/intervals are shown to cover all scenarios of short/long GRBs, rate/image triggers, and real/false positives.
- 3) For all the mask-weighted lightcurves, the y-axis units are counts/sec/det where a det is 0.4 x 0.4 = 0.16 sq cm.
- 4) The verticle lines correspond to following: green dotted lines are T50 interval, black dotted lines are T90 interval, blue solid line(s) is a spacecraft slew start time, and orange solid line(s) is a spacecraft slew end time.
- 5) Time of each bin is in the middle of the bin.
1 s binning
From T0-310 s to T0+310 s
From T100_start - 20 s to T100_end + 30 s

Full time interval

64 ms binning
Full time interval

From T100_start to T100_end

From T0-5 sec to T0+5 sec

16 ms binning
From T100_start-5 s to T100_start+5 s

Blue+Cyan dotted lines: Time interval of the scaled map
From 0.000000 to 2.048000
8 ms binning
From T100_start-3 s to T100_start+3 s

Blue+Cyan dotted lines: Time interval of the scaled map
From 0.000000 to 2.048000
2 ms binning
From T100_start-1 s to T100_start+1 s

Blue+Cyan dotted lines: Time interval of the scaled map
From 0.000000 to 2.048000
SN=5 or 10 sec. binning (whichever binning is satisfied first)

SN=5 or 10 sec. binning (T < 200 sec)

Quad-rate summed light curves (from T0-300s to T0+1000s)

Spectral Evolution
Spectra
Notes:
- 1) The fitting includes the systematic errors.
- 2) When the burst includes telescope slew time periods, the fitting uses an average response file made from multiple 5-s response files through out the slew time plus single time preiod for the non-slew times, and weighted by the total counts in the corresponding time period using addrmf. An average response file is needed becuase a spectral fit using the pre-slew DRM will introduce some errors in both a spectral shape and a normalization if the PHA file contains a lot of the slew/post-slew time interval.
- 3) For fits to more complicated models (e.g. a power-law over a cutoff power-law), the BAT team has decided to require a chi-square improvement of more than 6 for each extra dof.
Time averaged spectrum fit using the average DRM
Power-law model
Time interval is from   -2.524 sec. to  135.016 sec.

Spectral model in power-law:
------------------------------------------------------------
Parameters  : value       lower 90%   higher 90%
Photon index: 1.69945     ( -0.129646   0.131122 )
Norm@50keV  : 3.04681E-03    ( -0.000230057   0.000228928 )
------------------------------------------------------------
#Fit statistic : Chi-Squared =          41.19 using 59 PHA bins.
# Reduced chi-squared =         0.7227 for     57 degrees of freedom
# Null hypothesis probability =   9.430642e-01

Photon flux (15-150 keV)    in 137.5 sec: 0.404573 ( -0.0312872  0.0314067 ) ph/cm2/s
Energy fluence (15-150 keV)             : 3.87903e-06 ( -3.04069e-07  3.05613e-07 ) ergs/cm2
Cutoff power-law model
Time interval is from   -2.524 sec. to  135.016 sec.
Spectral model in the cutoff power-law:
------------------------------------------------------------
Parameters  : value       lower 90%   higher 90%
Photon index: 1.70038     ( -0.131922   0.130349 )
Epeak [keV] : 9999.36      ( -9999.35 -9999.36 )
Norm@50keV  : 3.04959E-03    ( -0.00305112   0.0020742 )
------------------------------------------------------------
#Fit statistic : Chi-Squared =          41.19 using 59 PHA bins.
# Reduced chi-squared =         0.7356 for     56 degrees of freedom
# Null hypothesis probability =   9.307225e-01

Photon flux (15-150 keV)    in 137.5 sec: 0.404618 ( -0.030965  0.031176 ) ph/cm2/s
Energy fluence (15-150 keV)             : 3.86928e-06 ( -3.09801e-07  3.17927e-07 ) ergs/cm2
Band function

Time interval is from   -2.524 sec. to  135.016 sec.

Spectral model in the Band function:
------------------------------------------------------------
Parameters  : value       lower 90%   higher 90%
alpha       : 4.94451   ( -4.94451   -4.94451 )
beta        : -1.73456    ( -0.143936   0.137628 )
Epeak [keV] : 21.3191      ( -21.3191 5.11642 )
Norm@50keV   : 939.829    ( -68.3975   2.13887e+06 )
------------------------------------------------------------
#Fit statistic : Chi-Squared =          40.33 using 59 PHA bins.
# Reduced chi-squared =         0.7334 for     55 degrees of freedom
# Null hypothesis probability =   9.307245e-01

Photon flux (15-150 keV)    in 137.5 sec:  (    ) ph/cm2/s
Energy fluence (15-150 keV)             : 0 ( 0  0 ) ergs/cm2
Single BB
Spectral model blackbody:
------------------------------------------------------------
Parameters  : value    Lower 90%  Upper 90%
kT [keV]    : 13.4327  (-1.3167  1.4651)
R^2/D10^2   : 6.36665E-02  (-0.020339   0.0296343)
(R is the radius in km and D10 is the distance to the source in units of 10 kpc)
------------------------------------------------------------
#Fit statistic : Chi-Squared =         100.61 using 59 PHA bins.
# Reduced chi-squared =         1.7651 for     57 degrees of freedom
# Null hypothesis probability =   3.256038e-04

Energy  Fluence     90% Error
[keV]   [erg/cm2]   [erg/cm2]
15- 25  3.347e-07   4.957e-08
25- 50  1.193e-06   1.118e-07
50-150  1.387e-06   2.210e-07
15-150  2.915e-06   2.578e-07
Thermal bremsstrahlung (OTTB)
Spectral model: thermal bremsstrahlung
------------------------------------------------------------
Parameters  : value         Lower 90%    Upper 90%
kT [keV]    : 152.172       (-45.3111      -150.193)
Norm        : 1.64285       (-0.141907     0.184178)
------------------------------------------------------------
#Fit statistic : Chi-Squared =          43.50 using 59 PHA bins.
# Reduced chi-squared =         0.7631 for     57 degrees of freedom
# Null hypothesis probability =   9.061622e-01

Energy  Fluence     90% Error
[keV]   [erg/cm2]   [erg/cm2]
15- 25  5.795e-07   5.981e-08
25- 50  1.076e-06   1.698e-07
50-150  2.137e-06   8.996e-07
15-150  3.793e-06   9.501e-07
Double BB

Spectral model: bbodyrad<1> + bbodyrad<2>
------------------------------------------------------------
Parameters  : value         Lower 90%    Upper 90%
kT1 [keV]   : 7.78396        (-1.43602      1.51464)
R1^2/D10^2  : 0.362689        (-0.164962      0.375935)
kT2 [keV]   : 34.8828        (-9.77531      25.1928)
R2^2/D10^2  : 1.60017E-03    (-0.00125232   0.00341952)
------------------------------------------------------------
#Fit statistic : Chi-Squared =          41.16 using 59 PHA bins.
# Reduced chi-squared =         0.7484 for     55 degrees of freedom
# Null hypothesis probability =   9.169840e-01

Energy  Fluence     90% Error
[keV]   [erg/cm2]   [erg/cm2]
15- 25  5.730e-07   1.189e-07
25- 50  1.141e-06   1.893e-07
50-150  2.194e-06   1.005e-06
15-150  3.908e-06   1.119e-06
Peak spectrum fit
Power-law model
Time interval is from    0.360 sec. to    1.360 sec.

Spectral model in power-law:
------------------------------------------------------------
Parameters  : value       lower 90%   higher 90%
Photon index: 1.17099     ( -0.334503   0.316421 )
Norm@50keV  : 2.36579E-02    ( -0.0048432   0.00477486 )
------------------------------------------------------------
#Fit statistic : Chi-Squared =          68.47 using 59 PHA bins.
# Reduced chi-squared =          1.201 for     57 degrees of freedom
# Null hypothesis probability =   1.420289e-01

Photon flux (15-150 keV)    in 1 sec: 2.76612 ( -0.598712  0.606274 ) ph/cm2/s
Energy fluence (15-150 keV)             : 2.42031e-07 ( -4.78945e-08  4.79518e-08 ) ergs/cm2
Cutoff power-law model

Time interval is from    0.360 sec. to    1.360 sec.
Spectral model in the cutoff power-law:
------------------------------------------------------------
Parameters  : value       lower 90%   higher 90%
Photon index: 0.518729     ( -1.76323   0.907334 )
Epeak [keV] : 137.850      ( -137.886 -137.886 )
Norm@50keV  : 4.48485E-02    ( -0.0250289   0.183768 )
------------------------------------------------------------
#Fit statistic : Chi-Squared =          67.73 using 59 PHA bins.
# Reduced chi-squared =          1.210 for     56 degrees of freedom
# Null hypothesis probability =   1.352996e-01

Photon flux (15-150 keV)    in 1 sec: 2.70242 ( -0.60533  0.6173 ) ph/cm2/s
Energy fluence (15-150 keV)             : 2.40271e-07 ( -4.936e-08  4.8722e-08 ) ergs/cm2
Band function
Time interval is from    0.360 sec. to    1.360 sec.

Spectral model in the Band function:
------------------------------------------------------------
Parameters  : value       lower 90%   higher 90%
alpha       : 4.94789   ( -4.94789   -4.94789 )
beta        : -1.29739    ( -0.400845   0.378603 )
Epeak [keV] : 32.1135      ( -32.1135 14.7475 )
Norm@50keV   : 401.107    ( -77.407   7.65831e+06 )
------------------------------------------------------------
#Fit statistic : Chi-Squared =          67.23 using 59 PHA bins.
# Reduced chi-squared =          1.222 for     55 degrees of freedom
# Null hypothesis probability =   1.247068e-01

Photon flux (15-150 keV)    in 1 sec:  (    ) ph/cm2/s
Energy fluence (15-150 keV)             : 0 ( 0  0 ) ergs/cm2
Single BB

Spectral model blackbody:
------------------------------------------------------------
Parameters  : value    Lower 90%  Upper 90%
kT [keV]    : 21.2330  (-4.41751  6.41564)
R^2/D10^2   : 0.109490  (-0.0645917   0.132617)
(R is the radius in km and D10 is the distance to the source in units of 10 kpc)
------------------------------------------------------------
#Fit statistic : Chi-Squared =          70.95 using 59 PHA bins.
# Reduced chi-squared =          1.245 for     57 degrees of freedom
# Null hypothesis probability =   1.012414e-01

Energy  Fluence     90% Error
[keV]   [erg/cm2]   [erg/cm2]
15- 25  9.281e-09   3.856e-09
25- 50  4.804e-08   1.767e-08
50-150  1.615e-07   6.127e-08
15-150  2.189e-07   6.185e-08
Thermal bremsstrahlung (OTTB)

Spectral model: thermal bremsstrahlung
------------------------------------------------------------
Parameters  : value         Lower 90%    Upper 90%
kT [keV]    : 200.000       (      )
Norm        : 12.0905       (-2.42635     2.42559)
------------------------------------------------------------
#Fit statistic : Chi-Squared =          72.55 using 59 PHA bins.
# Reduced chi-squared =          1.273 for     57 degrees of freedom
# Null hypothesis probability =   8.027963e-02

Energy  Fluence     90% Error
[keV]   [erg/cm2]   [erg/cm2]
15- 25  3.013e-08   1.791e-08
25- 50  5.796e-08   3.292e-08
50-150  1.271e-07   7.410e-08
15-150  2.152e-07   1.245e-07
Double BB

------------------------------------------------------------
Parameters  : value         Lower 90%    Upper 90%
kT1 [keV]   : 41.1331        (      )
R1^2/D10^2  : 9.03107E-03        (-0.00932983      0.10201)
kT2 [keV]   : 12.0742        (-8.96329      -11.9136)
R2^2/D10^2  : 0.427844    (-0.389263   47.2696)
------------------------------------------------------------
#Fit statistic : Chi-Squared =          67.89 using 59 PHA bins.
#Fit statistic : Chi-Squared =          67.78 using 59 PHA bins.
# Reduced chi-squared =          1.234 for     55 degrees of freedom
# Reduced chi-squared =          1.232 for     55 degrees of freedom
# Null hypothesis probability =   1.137972e-01
# Null hypothesis probability =   1.155599e-01

Energy  Fluence     90% Error
[keV]   [erg/cm2]   [erg/cm2]
15- 25  1.704e-08   1.091e-08
25- 50  5.226e-08   2.978e-08
50-150  1.666e-07   9.615e-08
15-150  2.359e-07   1.246e-07
Pre-slew spectrum (Pre-slew PHA with pre-slew DRM)
Power-law model

Spectral model in power-law:
------------------------------------------------------------
Parameters  : value       lower 90%   higher 90%
Photon index: 1.52669     ( -0.149572   0.149152 )
Norm@50keV  : 8.57097E-03    ( -0.000738568   0.000738461 )
------------------------------------------------------------
#Fit statistic : Chi-Squared =          42.19 using 59 PHA bins.
# Reduced chi-squared =         0.7401 for     57 degrees of freedom
# Null hypothesis probability =   9.286608e-01

Photon flux (15-150 keV)    in 33.14 sec: 1.07786 ( -0.101737  0.102239 ) ph/cm2/s
Energy fluence (15-150 keV)             : 2.68322e-06 ( -2.40465e-07  2.4091e-07 ) ergs/cm2
Cutoff power-law model

Spectral model in the cutoff power-law:
------------------------------------------------------------
Parameters  : value       lower 90%   higher 90%
Photon index: 1.41295     ( -0.631504   1.3784 )
Epeak [keV] : 255.463      ( -298.952 -298.952 )
Norm@50keV  : 9.70999E-03    ( -0.00961481   0.00911777 )
------------------------------------------------------------
#Fit statistic : Chi-Squared =          42.16 using 59 PHA bins.
# Reduced chi-squared =         0.7528 for     56 degrees of freedom
# Null hypothesis probability =   9.146971e-01

Photon flux (15-150 keV)    in 33.14 sec: 1.07266 ( -0.10516  0.10535 ) ph/cm2/s
Energy fluence (15-150 keV)             : 2.67293e-06 ( -2.5089e-07  2.47963e-07 ) ergs/cm2
Band function
Spectral model in the Band function:
------------------------------------------------------------
Parameters  : value       lower 90%   higher 90%
alpha       : -0.175987   ( 0.901442   5.53642 )
beta        : -1.63150    ( 1.65755   0.252286 )
Epeak [keV] : 46.2132      ( -46.1849 232.874 )
Norm@50keV   : 5.95147E-02    ( -0.0602661   1.02567e+06 )
------------------------------------------------------------
#Fit statistic : Chi-Squared =          41.11 using 59 PHA bins.
# Reduced chi-squared =         0.7475 for     55 degrees of freedom
# Null hypothesis probability =   9.178352e-01

Photon flux (15-150 keV)    in 33.14 sec:  (    ) ph/cm2/s
Energy fluence (15-150 keV)             : 0 ( 0  0 ) ergs/cm2
S(25-50 keV) vs. S(50-100 keV) plot

S(25-50 keV)  = 1.05e-06
S(50-100 keV) = 1.29e-06
T90 vs. Hardness ratio plot

T90                                   = 68.6439999341965 sec.
Hardness ratio (energy fluence ratio) = 1.22857
Color vs. Color plot

Count Ratio  (25-50 keV) / (15-25 keV) = 1.39573
Count Ratio (50-100 keV) / (15-25 keV) = 0.980338
Mask shadow pattern

IMX = -1.383715046351633E+00, IMY = 2.629757897240920E-01
TIME vs. PHA plot around the trigger time

Blue+Cyan dotted lines: Time interval of the scaled map
From 0.000000 to 2.048000
TIME vs. DetID plot around the trigger time

Blue+Cyan dotted lines: Time interval of the scaled map
From 0.000000 to 2.048000
100 us light curve (15-350 keV)

Blue+Cyan dotted lines: Time interval of the scaled map
From 0.000000 to 2.048000
Spacecraft aspect plot
Bright source in the pre-burst/pre-slew/post-slew images
Pre-burst image of 15-350 keV band
Time interval of the image:
-149.379370 -2.524000

# RAcent  DECcent POSerr Theta    Phi  PeakCts   SNR AngSep     Name
#  [deg]    [deg]    ['] [deg]  [deg]                   [']
355.5494 -15.7553    2.8  39.9  102.0   2.2986   4.1 ------	UNKNOWN
359.2587 -25.0649    2.7  39.2   86.4   2.6188   4.3 ------	UNKNOWN
 70.0738 -44.7552    3.1  49.5   -2.9   1.0889   3.7 ------	UNKNOWN
 40.7508  29.4266    2.8  35.7 -141.7   0.8128   4.1 ------	UNKNOWN
 82.2878  -9.2573    2.2  47.0  -53.2   3.4033   5.3 ------	UNKNOWN
Pre-slew background subtracted image of 15-350 keV band
Time interval of the image:
-2.524000 30.620600

# RAcent  DECcent POSerr Theta    Phi  PeakCts   SNR AngSep     Name
#  [deg]    [deg]    ['] [deg]  [deg]                   [']
357.8692  21.5348    1.9  45.5  157.8   1.0152   6.0 ------	UNKNOWN
 31.0893 -25.7085    2.3  20.2   39.8   0.3617   5.0 ------	UNKNOWN
 13.0103  45.1025    0.7  54.6 -169.2   3.6905  15.4 ------	UNKNOWN
 25.5362  49.1599    2.1  55.6 -157.8   1.6618   5.6 ------	UNKNOWN
Post-slew image of 15-350 keV band
Time interval of the image:
102.020580 239.820600

# RAcent  DECcent POSerr Theta    Phi  PeakCts   SNR AngSep     Name
#  [deg]    [deg]    ['] [deg]  [deg]                   [']
326.2722  38.3582    5.2  35.0  112.0   0.7283   2.2    5.2	Cyg X-2
 25.1117  11.6785    2.7  35.0   -4.8   0.7306   4.2 ------	UNKNOWN
199.4342  75.7083    2.3  59.1 -165.6   4.6733   5.0 ------	UNKNOWN
177.1140  75.7395    3.9  58.7 -159.3   2.7856   3.0 ------	UNKNOWN
 58.5698  25.0716    2.0  41.6  -60.8   2.5092   5.9 ------	UNKNOWN
 81.9087  55.9735    2.3  43.2 -114.1   2.7949   5.0 ------	UNKNOWN
 57.0001  12.2591    2.6  49.7  -46.7   2.7451   4.5 ------	UNKNOWN
Plot creation:
Sat May 30 13:04:54 EDT 2015