Click here for the BAT GCN circular template
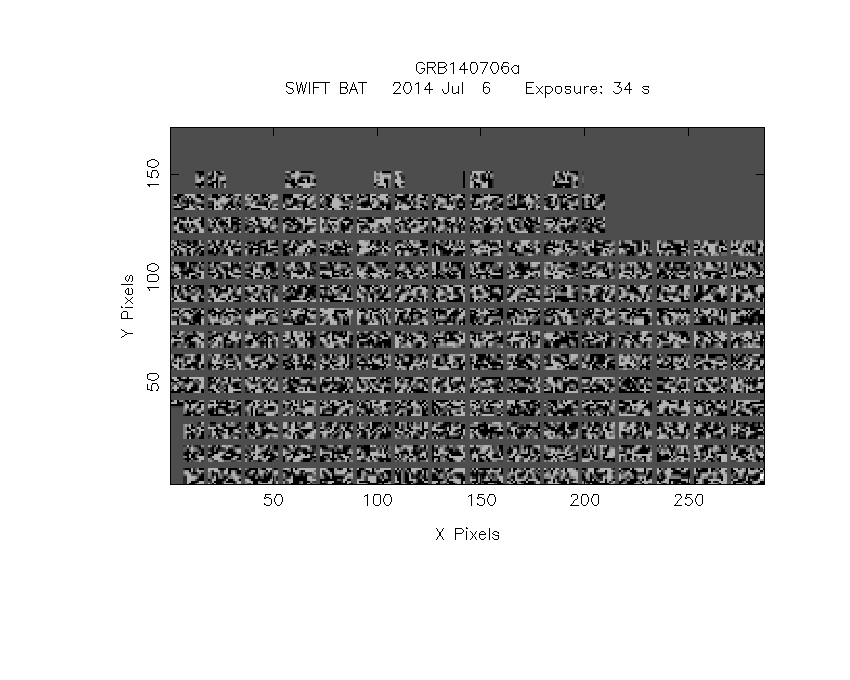
Image
Pre-slew 15.0-350.0 keV image (Event data)
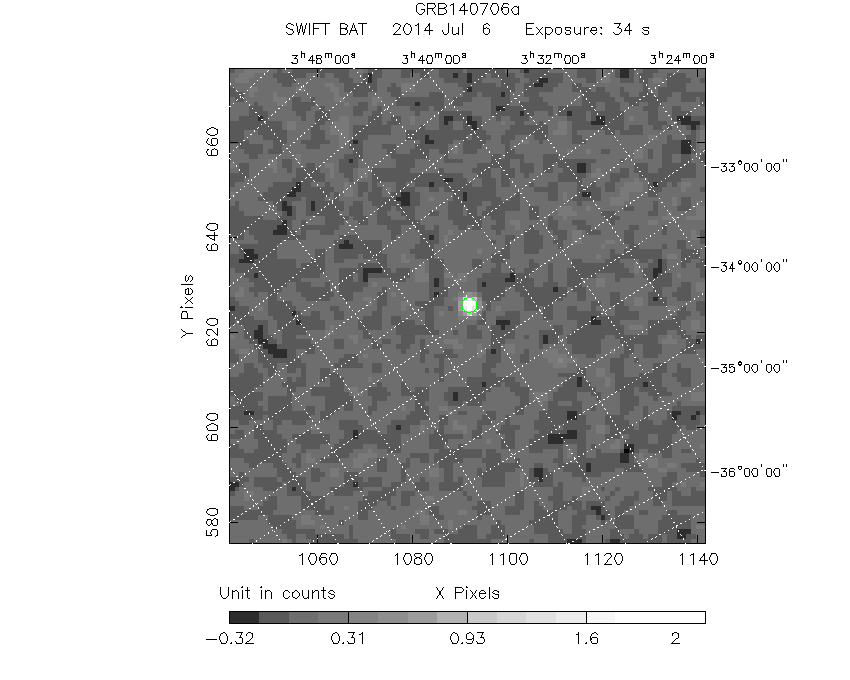
#   RAcent    DECcent   POSerr    Theta     Phi              Peak Cts       SNR   Name
   49.2697   -38.0577   0.0069    28.5898  -144.9142         2.2876787     27.950 TRIG_00603587

Foreground time interval of the image:
-21.264  12.893 (delta_t =  34.157 [sec])
Background time interval of the image:
-239.408 -21.264 (delta_t = 218.144 [sec])
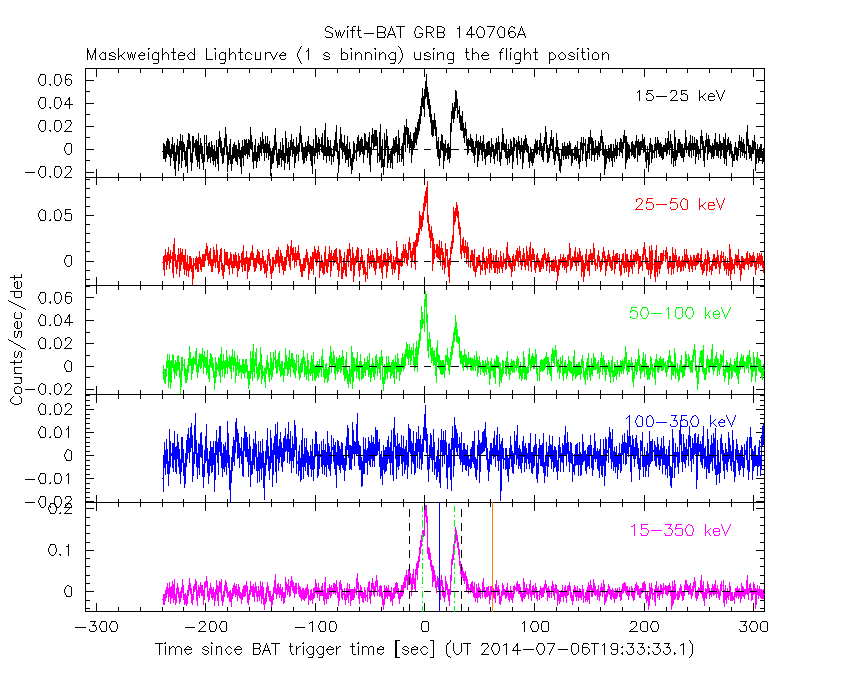
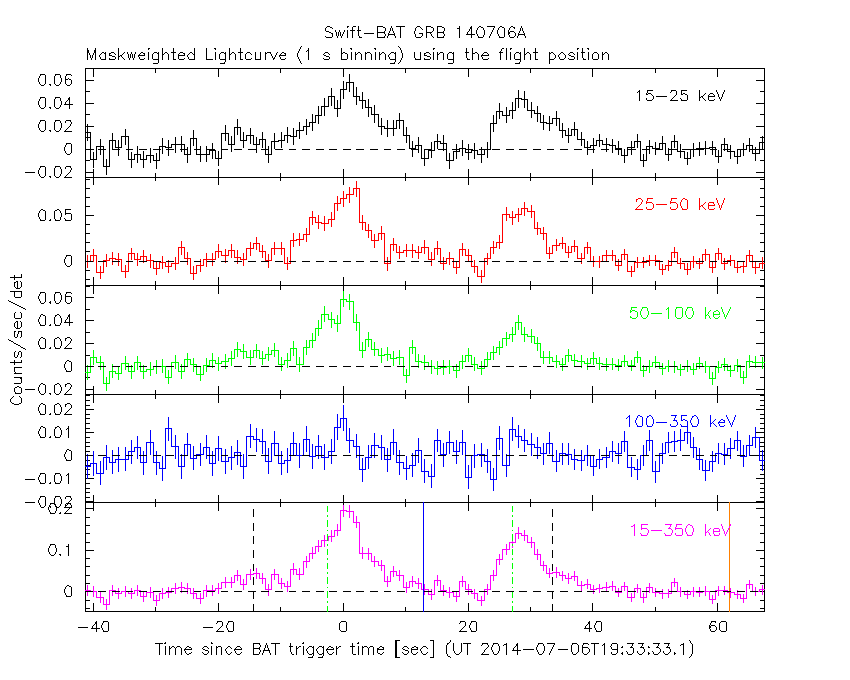
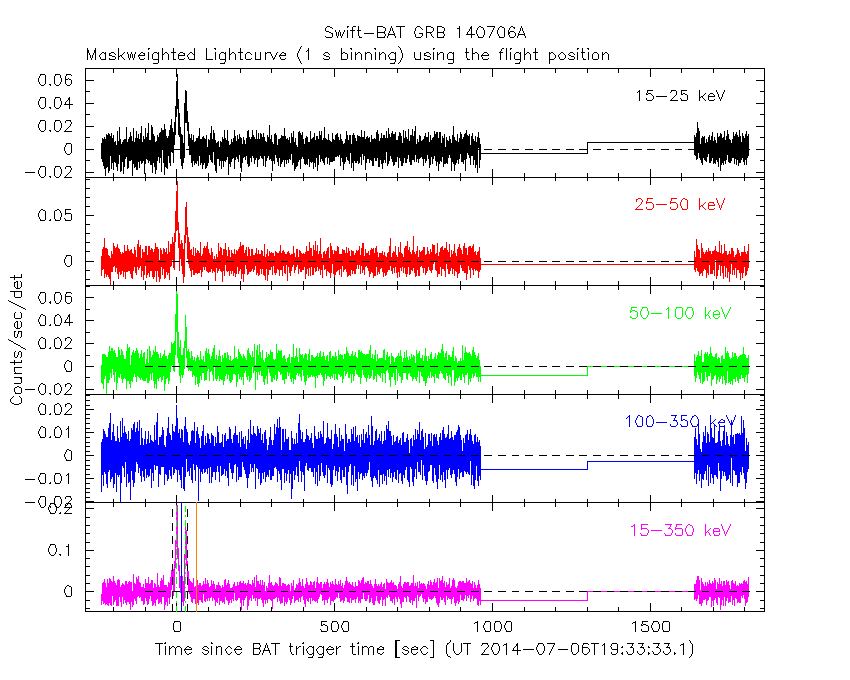
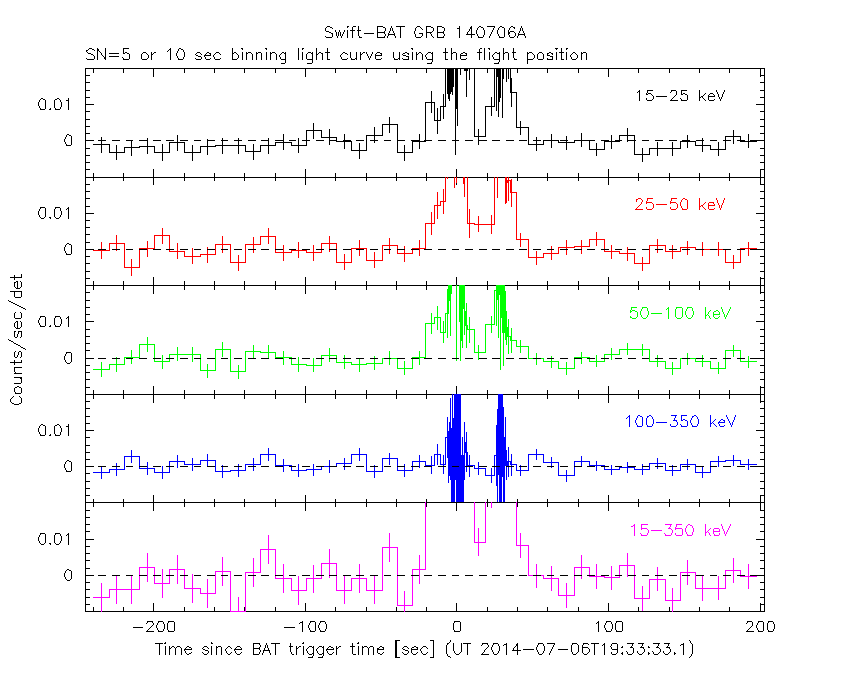
Lightcurves
Notes:
- 1) The mask-weighted light curves are using the flight position.
- 2) Multiple plots of different time binning/intervals are shown to cover all scenarios of short/long GRBs, rate/image triggers, and real/false positives.
- 3) For all the mask-weighted lightcurves, the y-axis units are counts/sec/det where a det is 0.4 x 0.4 = 0.16 sq cm.
- 4) The verticle lines correspond to following: green dotted lines are T50 interval, black dotted lines are T90 interval, blue solid line(s) is a spacecraft slew start time, and orange solid line(s) is a spacecraft slew end time.
- 5) Time of each bin is in the middle of the bin.
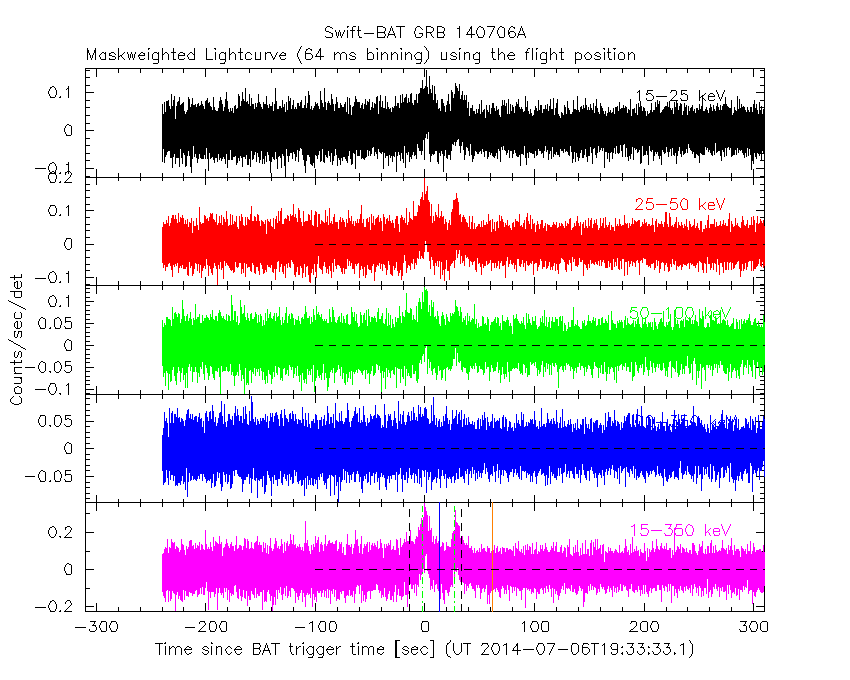
1 s binning
From T0-310 s to T0+310 s
From T100_start - 20 s to T100_end + 30 s
Full time interval
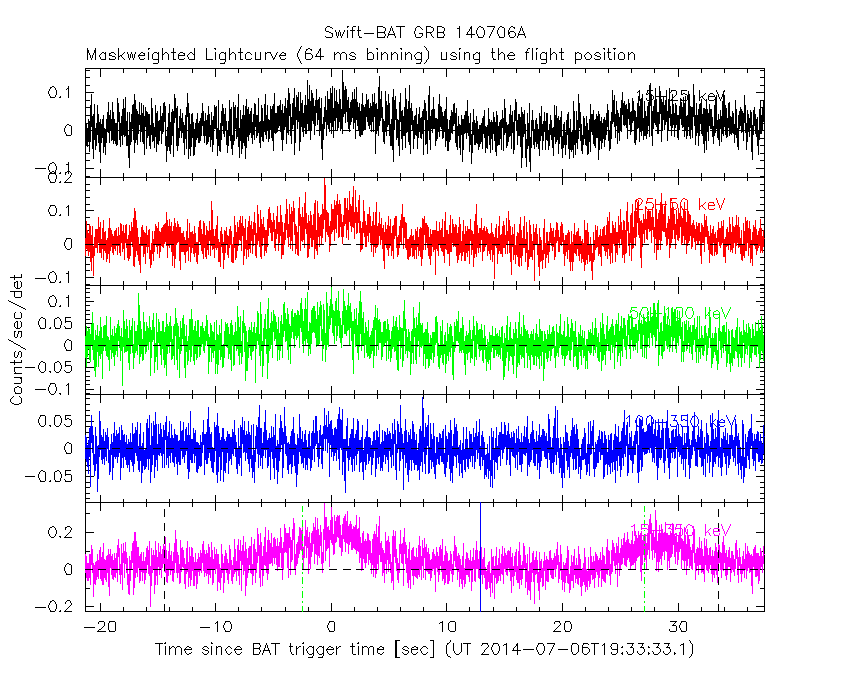
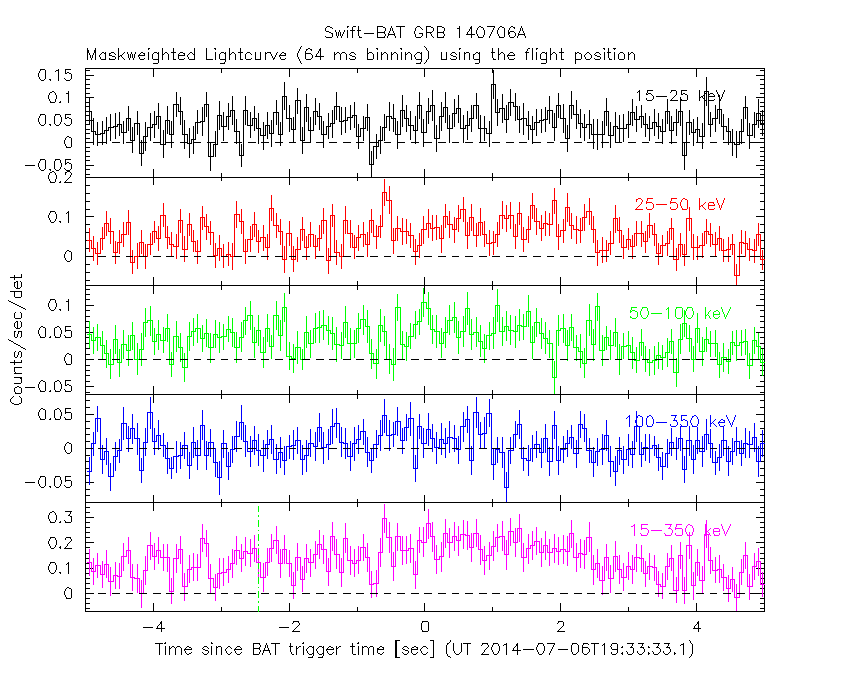
64 ms binning
Full time interval
From T100_start to T100_end
From T0-5 sec to T0+5 sec
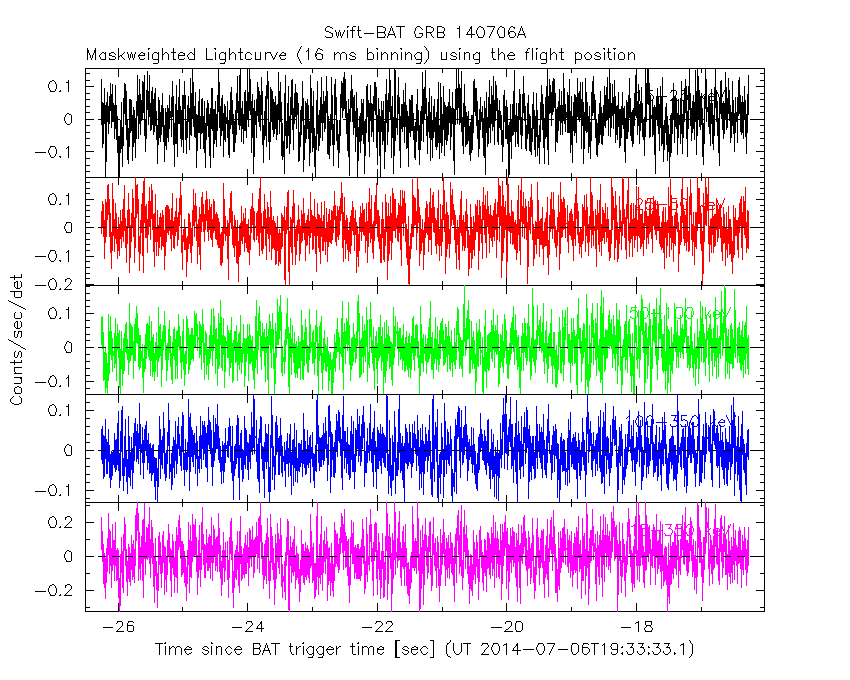
16 ms binning
From T100_start-5 s to T100_start+5 s
Blue+Cyan dotted lines: Time interval of the scaled map
From 0.000000 to 1.024000
8 ms binning
From T100_start-3 s to T100_start+3 s
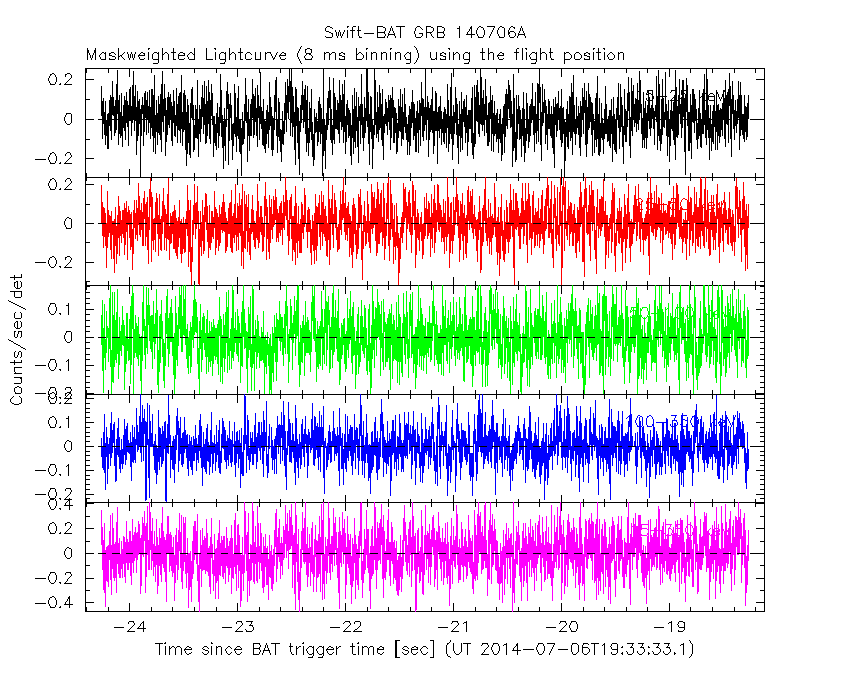
Blue+Cyan dotted lines: Time interval of the scaled map
From 0.000000 to 1.024000
2 ms binning
From T100_start-1 s to T100_start+1 s
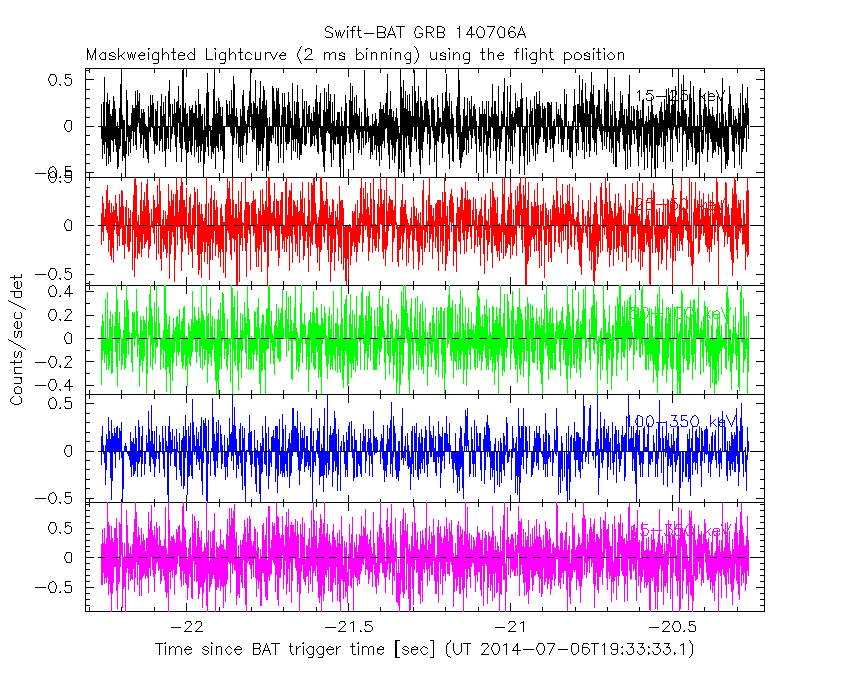
Blue+Cyan dotted lines: Time interval of the scaled map
From 0.000000 to 1.024000
SN=5 or 10 sec. binning (whichever binning is satisfied first)

SN=5 or 10 sec. binning (T < 200 sec)
Quad-rate summed light curves (from T0-300s to T0+1000s)

Spectral Evolution

Spectra
Notes:
- 1) The fitting includes the systematic errors.
- 2) When the burst includes telescope slew time periods, the fitting uses an average response file made from multiple 5-s response files through out the slew time plus single time preiod for the non-slew times, and weighted by the total counts in the corresponding time period using addrmf. An average response file is needed becuase a spectral fit using the pre-slew DRM will introduce some errors in both a spectral shape and a normalization if the PHA file contains a lot of the slew/post-slew time interval.
- 3) For fits to more complicated models (e.g. a power-law over a cutoff power-law), the BAT team has decided to require a chi-square improvement of more than 6 for each extra dof.
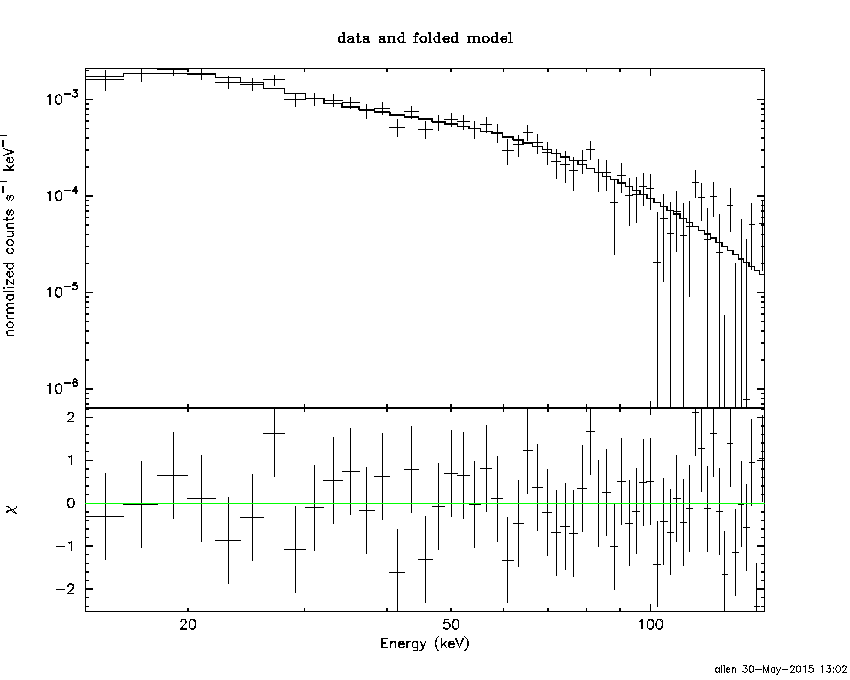
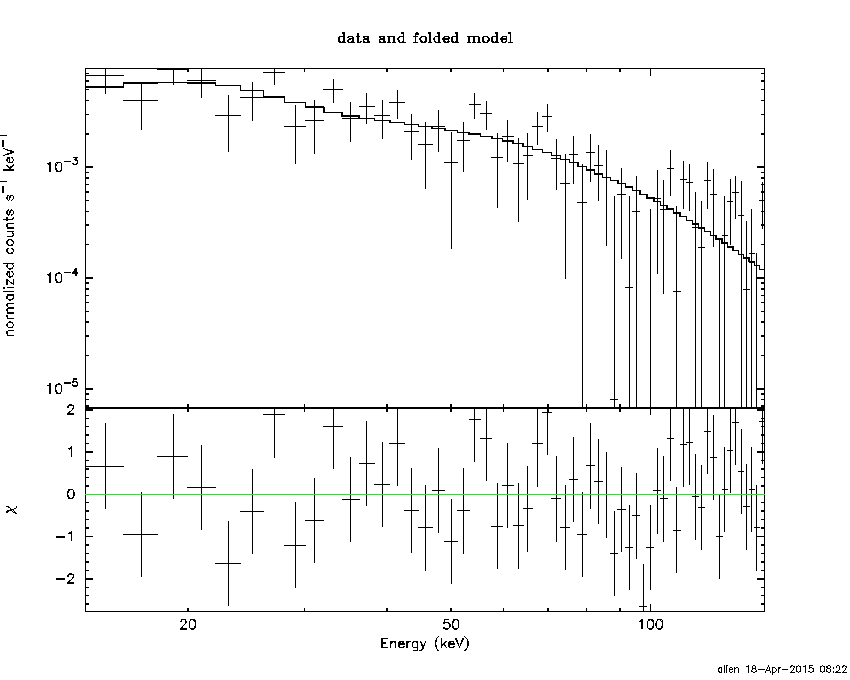
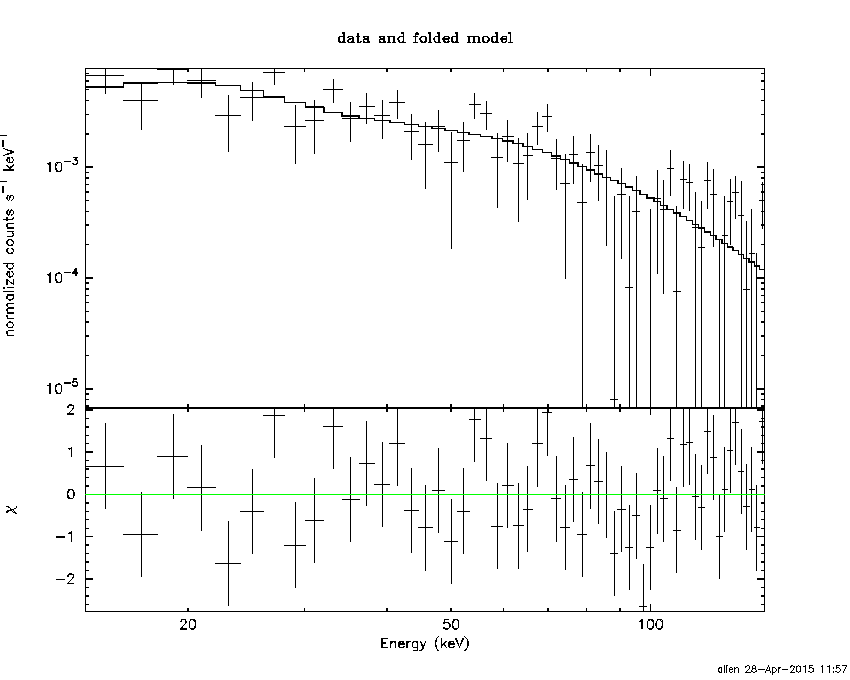
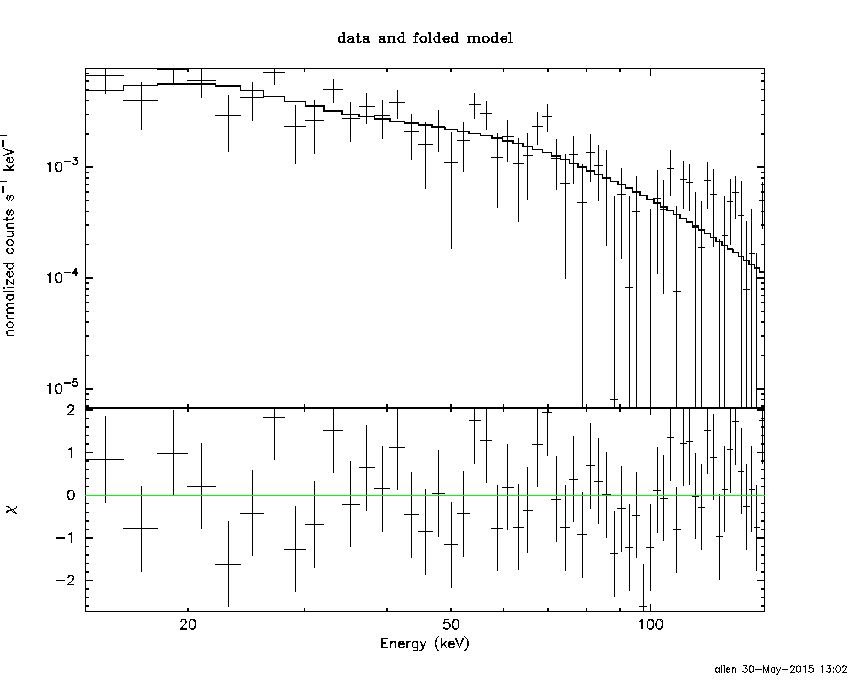
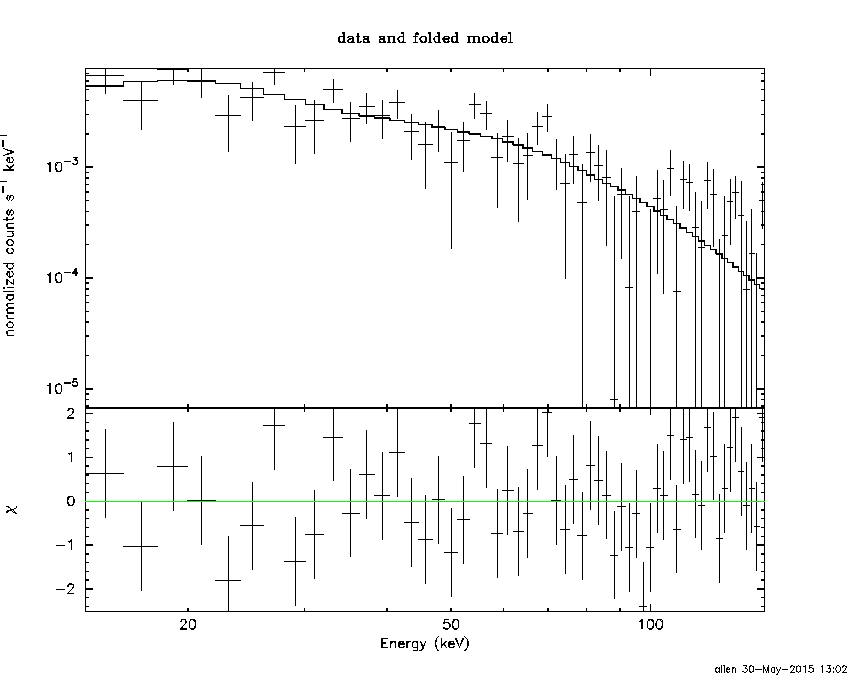
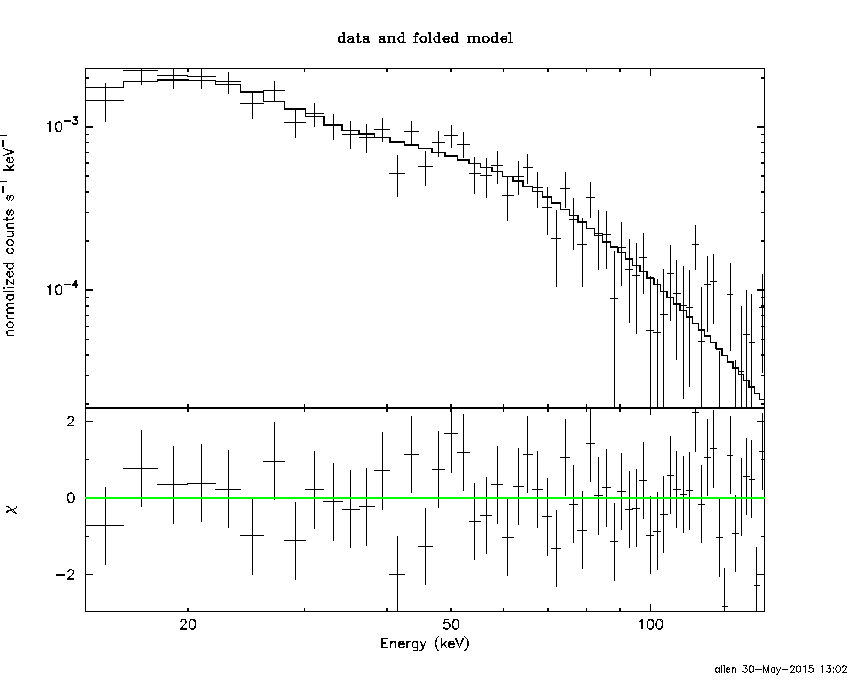
Time averaged spectrum fit using the average DRM
Power-law model
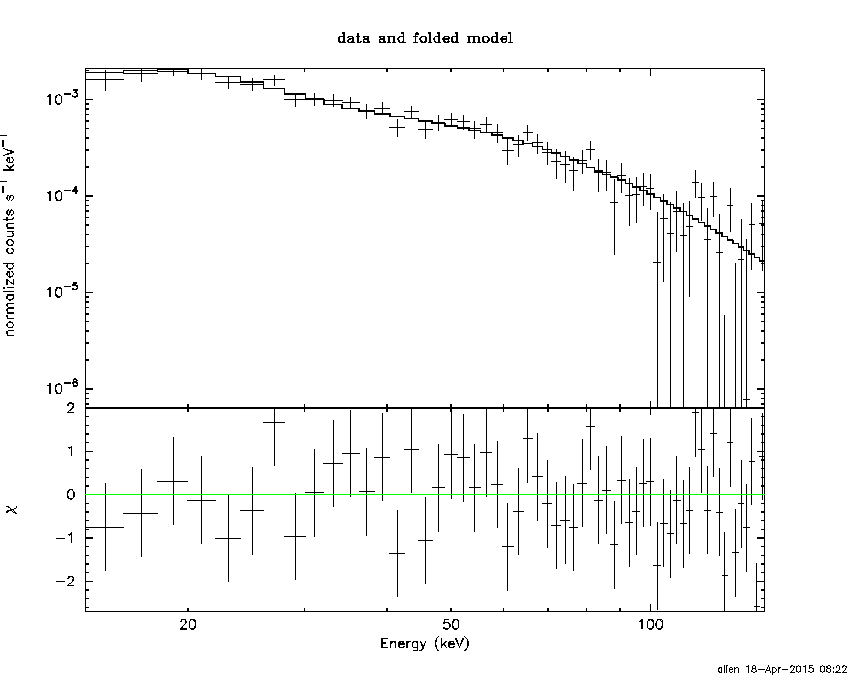
Time interval is from  -21.264 sec. to   37.480 sec.

Spectral model in power-law:
------------------------------------------------------------
Parameters  : value       lower 90%   higher 90%
Photon index: 1.75219     ( -0.0924718   0.093609 )
Norm@50keV  : 3.60471E-03    ( -0.000192508   0.000191355 )
------------------------------------------------------------
#Fit statistic : Chi-Squared =          51.14 using 59 PHA bins.
# Reduced chi-squared =         0.8973 for     57 degrees of freedom
# Null hypothesis probability =   6.933845e-01

Photon flux (15-150 keV)    in 58.74 sec: 0.487811 ( -0.0251745  0.0252222 ) ph/cm2/s
Energy fluence (15-150 keV)             : 1.95357e-06 ( -1.07843e-07  1.08464e-07 ) ergs/cm2
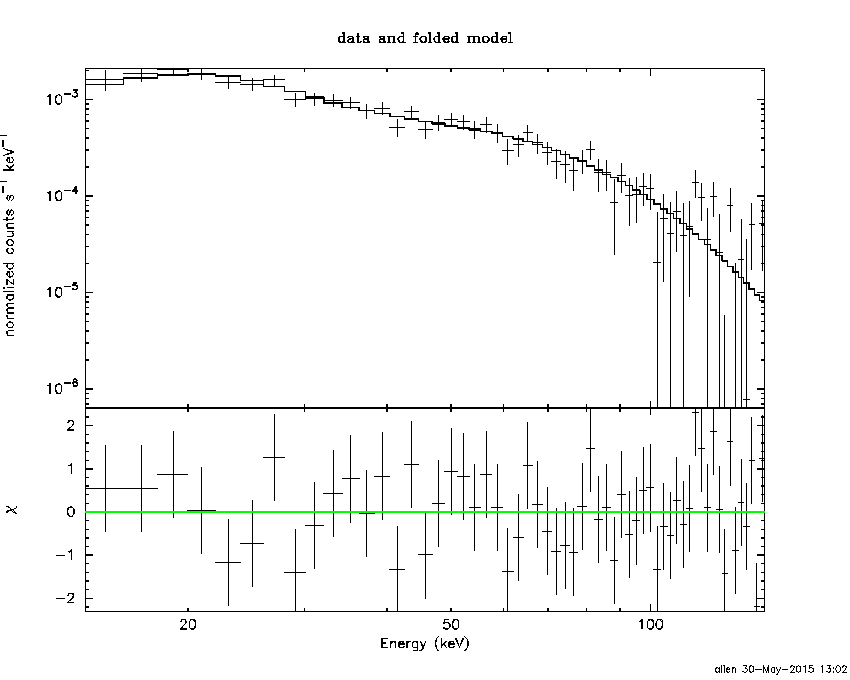
Cutoff power-law model

Time interval is from  -21.264 sec. to   37.480 sec.
Spectral model in the cutoff power-law:
------------------------------------------------------------
Parameters  : value       lower 90%   higher 90%
Photon index: 1.42796     ( -0.390223   0.35404 )
Epeak [keV] : 84.7167      ( -23.6172 -84.7167 )
Norm@50keV  : 5.30476E-03    ( -0.00176272   0.00306434 )
------------------------------------------------------------
#Fit statistic : Chi-Squared =          48.76 using 59 PHA bins.
# Reduced chi-squared =         0.8707 for     56 degrees of freedom
# Null hypothesis probability =   7.429883e-01

Photon flux (15-150 keV)    in 58.74 sec: 0.478541 ( -0.027079  0.027084 ) ph/cm2/s
Energy fluence (15-150 keV)             : 1.89908e-06 ( -1.23865e-07  1.23918e-07 ) ergs/cm2
Band function
Time interval is from  -21.264 sec. to   37.480 sec.

Spectral model in the Band function:
------------------------------------------------------------
Parameters  : value       lower 90%   higher 90%
alpha       : -1.42796   ( -0.255851   0.263754 )
beta        : -10.0000    ( 10   7.4607e-14 )
Epeak [keV] : 84.7031      ( -20.3144 -84.7031 )
Norm@50keV   : 5.30388E-03    ( -0.00176306   0.0030653 )
------------------------------------------------------------
#Fit statistic : Chi-Squared =          48.76 using 59 PHA bins.
# Reduced chi-squared =         0.8865 for     55 degrees of freedom
# Null hypothesis probability =   7.106009e-01

Photon flux (15-150 keV)    in 58.74 sec: 0.479050 (    ) ph/cm2/s
Energy fluence (15-150 keV)             : 1.89721e-06 ( 0  0 ) ergs/cm2
Single BB
Spectral model blackbody:
------------------------------------------------------------
Parameters  : value    Lower 90%  Upper 90%
kT [keV]    : 12.8827  (  )
R^2/D10^2   : 8.80825E-02  (   )
(R is the radius in km and D10 is the distance to the source in units of 10 kpc)
------------------------------------------------------------
#Fit statistic : Chi-Squared =         135.13 using 59 PHA bins.
# Reduced chi-squared =         2.3707 for     57 degrees of freedom
# Null hypothesis probability =   2.725053e-08

Energy  Fluence     90% Error
[keV]   [erg/cm2]   [erg/cm2]
15- 25  1.821e-07   1.774e-08
25- 50  6.212e-07   3.977e-08
50-150  6.483e-07   7.730e-08
15-150  1.452e-06   8.752e-08
Thermal bremsstrahlung (OTTB)
Spectral model: thermal bremsstrahlung
------------------------------------------------------------
Parameters  : value         Lower 90%    Upper 90%
kT [keV]    : 122.766       (-25.5599      30.585)
Norm        : 2.03236       (-0.129972     0.167081)
------------------------------------------------------------
#Fit statistic : Chi-Squared =          49.26 using 59 PHA bins.
# Reduced chi-squared =         0.8642 for     57 degrees of freedom
# Null hypothesis probability =   7.572405e-01

Energy  Fluence     90% Error
[keV]   [erg/cm2]   [erg/cm2]
15- 25  3.106e-07   2.543e-08
25- 50  5.579e-07   4.024e-08
50-150  1.007e-06   3.019e-07
15-150  1.875e-06   3.216e-07
Double BB
Spectral model: bbodyrad<1> + bbodyrad<2>
------------------------------------------------------------
Parameters  : value         Lower 90%    Upper 90%
kT1 [keV]   : 6.21355        (-1.12448      1.26443)
R1^2/D10^2  : 0.832975        (-0.390417      0.922014)
kT2 [keV]   : 21.8308        (-3.28898      5.18745)
R2^2/D10^2  : 9.87431E-03    (-0.0055393   0.00908719)
------------------------------------------------------------
#Fit statistic : Chi-Squared =          52.07 using 59 PHA bins.
# Reduced chi-squared =         0.9468 for     55 degrees of freedom
# Null hypothesis probability =   5.872263e-01

Energy  Fluence     90% Error
[keV]   [erg/cm2]   [erg/cm2]
15- 25  3.148e-07   6.450e-08
25- 50  5.535e-07   8.523e-08
50-150  9.919e-07   2.035e-07
15-150  1.860e-06   3.072e-07
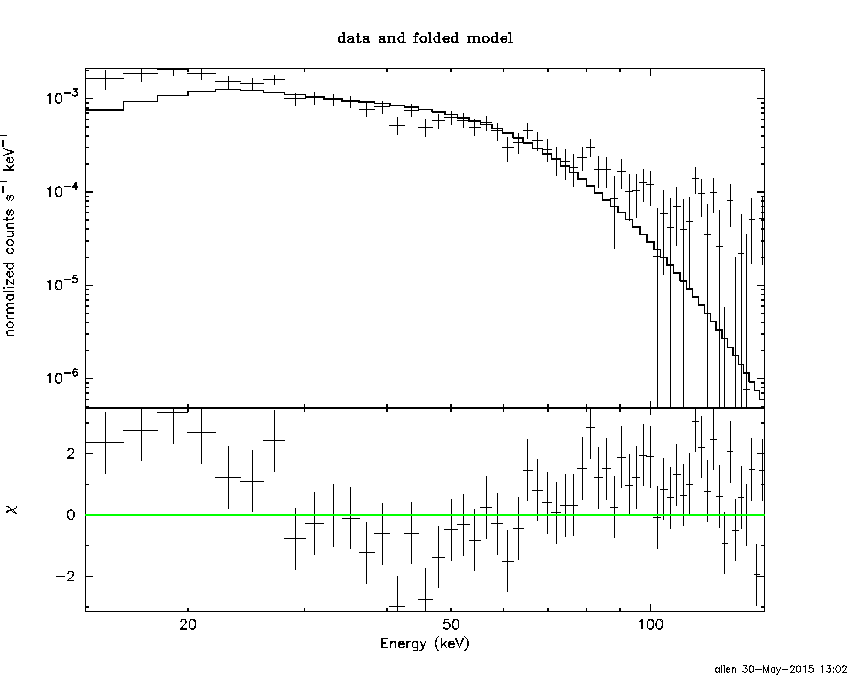
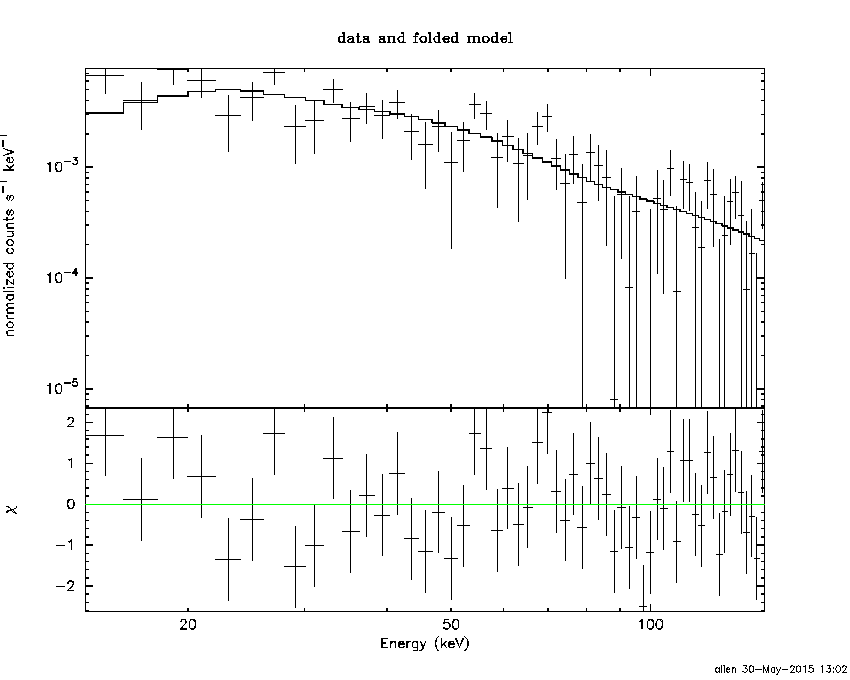
Peak spectrum fit
Power-law model
Time interval is from   -0.116 sec. to    0.884 sec.

Spectral model in power-law:
------------------------------------------------------------
Parameters  : value       lower 90%   higher 90%
Photon index: 1.45103     ( -0.187979   0.189104 )
Norm@50keV  : 1.42501E-02    ( -0.00157901   0.00157314 )
------------------------------------------------------------
#Fit statistic : Chi-Squared =          60.74 using 59 PHA bins.
# Reduced chi-squared =          1.066 for     57 degrees of freedom
# Null hypothesis probability =   3.428417e-01

Photon flux (15-150 keV)    in 1 sec: 1.75657 ( -0.196891  0.197247 ) ph/cm2/s
Energy fluence (15-150 keV)             : 1.36337e-07 ( -1.64965e-08  1.66003e-08 ) ergs/cm2
Cutoff power-law model
Time interval is from   -0.116 sec. to    0.884 sec.
Spectral model in the cutoff power-law:
------------------------------------------------------------
Parameters  : value       lower 90%   higher 90%
Photon index: 1.45389     ( -0.675499   0.186915 )
Epeak [keV] : 9999.36      ( -9999.36 -9999.36 )
Norm@50keV  : 1.42732E-02    ( -0.0104613   0.0107918 )
------------------------------------------------------------
#Fit statistic : Chi-Squared =          60.74 using 59 PHA bins.
# Reduced chi-squared =          1.085 for     56 degrees of freedom
# Null hypothesis probability =   3.090462e-01

Photon flux (15-150 keV)    in 1 sec: 1.75681 ( -0.1981  0.19643 ) ph/cm2/s
Energy fluence (15-150 keV)             : 1.36216e-07 ( -1.6998e-08  1.6674e-08 ) ergs/cm2
Band function
Time interval is from   -0.116 sec. to    0.884 sec.

Spectral model in the Band function:
------------------------------------------------------------
Parameters  : value       lower 90%   higher 90%
alpha       : -0.999930   ( 1.0148   1.0148 )
beta        : -1.52463    ( 1.52391   0.257061 )
Epeak [keV] : 83.5668      ( -92.4285 -92.4285 )
Norm@50keV   : 2.64704E-02    ( -0.0109043   0 )
------------------------------------------------------------
#Fit statistic : Chi-Squared =          60.64 using 59 PHA bins.
# Reduced chi-squared =          1.103 for     55 degrees of freedom
# Null hypothesis probability =   2.797452e-01

Photon flux (15-150 keV)    in 1 sec:  (    ) ph/cm2/s
Energy fluence (15-150 keV)             : 0 ( 0  0 ) ergs/cm2
Single BB
Spectral model blackbody:
------------------------------------------------------------
Parameters  : value    Lower 90%  Upper 90%
kT [keV]    : 15.1715  (-1.96558  2.36053)
R^2/D10^2   : 0.194698  (-0.0779401   0.122941)
(R is the radius in km and D10 is the distance to the source in units of 10 kpc)
------------------------------------------------------------
#Fit statistic : Chi-Squared =          82.36 using 59 PHA bins.
# Reduced chi-squared =          1.445 for     57 degrees of freedom
# Null hypothesis probability =   1.562394e-02

Energy  Fluence     90% Error
[keV]   [erg/cm2]   [erg/cm2]
15- 25  9.365e-09   2.010e-09
25- 50  3.760e-08   5.565e-09
50-150  5.919e-08   1.173e-08
15-150  1.061e-07   1.601e-08
Thermal bremsstrahlung (OTTB)
Spectral model: thermal bremsstrahlung
------------------------------------------------------------
Parameters  : value         Lower 90%    Upper 90%
kT [keV]    : 200.000       (      )
Norm        : 7.24383       (-0.791085     0.791036)
------------------------------------------------------------
#Fit statistic : Chi-Squared =          62.19 using 59 PHA bins.
# Reduced chi-squared =          1.091 for     57 degrees of freedom
# Null hypothesis probability =   2.966933e-01

Energy  Fluence     90% Error
[keV]   [erg/cm2]   [erg/cm2]
15- 25  1.804e-08   8.918e-09
25- 50  3.470e-08   1.524e-08
50-150  7.611e-08   4.187e-08
15-150  1.288e-07   5.889e-08
Double BB
------------------------------------------------------------
Parameters  : value         Lower 90%    Upper 90%
kT1 [keV]   : 11.1004        (-3.50138      2.33771)
R1^2/D10^2  : 0.492494        (-0.261636      1.17312)
kT2 [keV]   : 199.715        (      )
R2^2/D10^2  : 2.13038E-04    (-7.16365e-05   0.0181976)
------------------------------------------------------------
#Fit statistic : Chi-Squared =          61.69 using 59 PHA bins.
#Fit statistic : Chi-Squared =          61.62 using 59 PHA bins.
# Reduced chi-squared =          1.122 for     55 degrees of freedom
# Reduced chi-squared =          1.120 for     55 degrees of freedom
# Null hypothesis probability =   2.493377e-01
# Null hypothesis probability =   2.511344e-01

Energy  Fluence     90% Error
[keV]   [erg/cm2]   [erg/cm2]
15- 25  1.334e-08   4.777e-09
25- 50  3.838e-08   1.194e-08
50-150  8.360e-08   5.472e-08
15-150  1.353e-07   6.163e-08
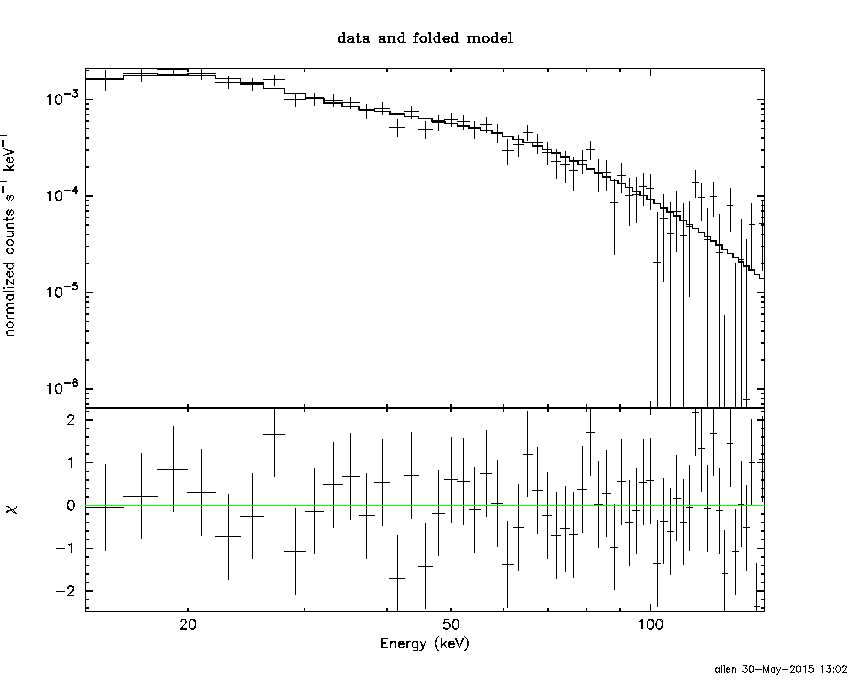
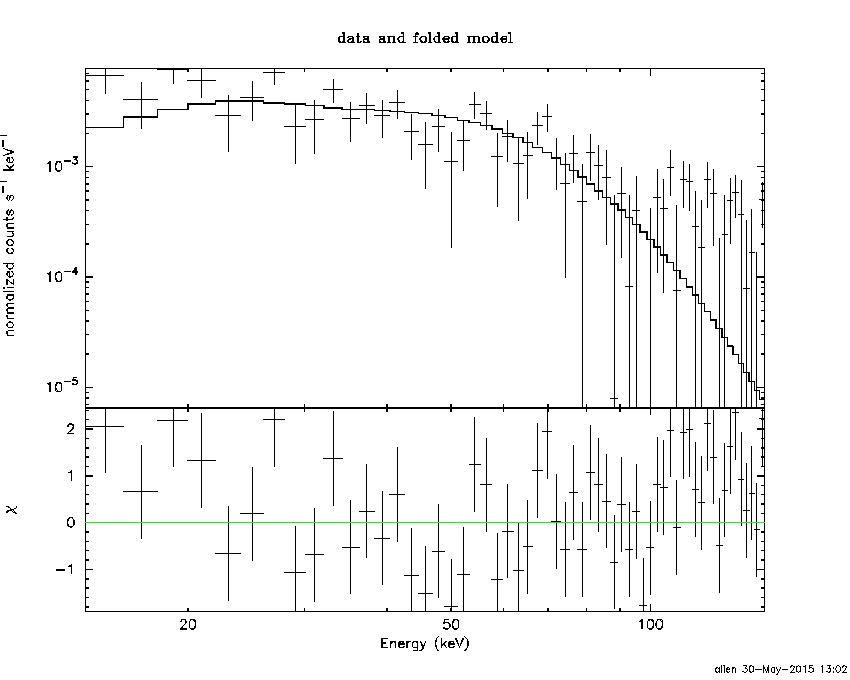
Pre-slew spectrum (Pre-slew PHA with pre-slew DRM)
Power-law model
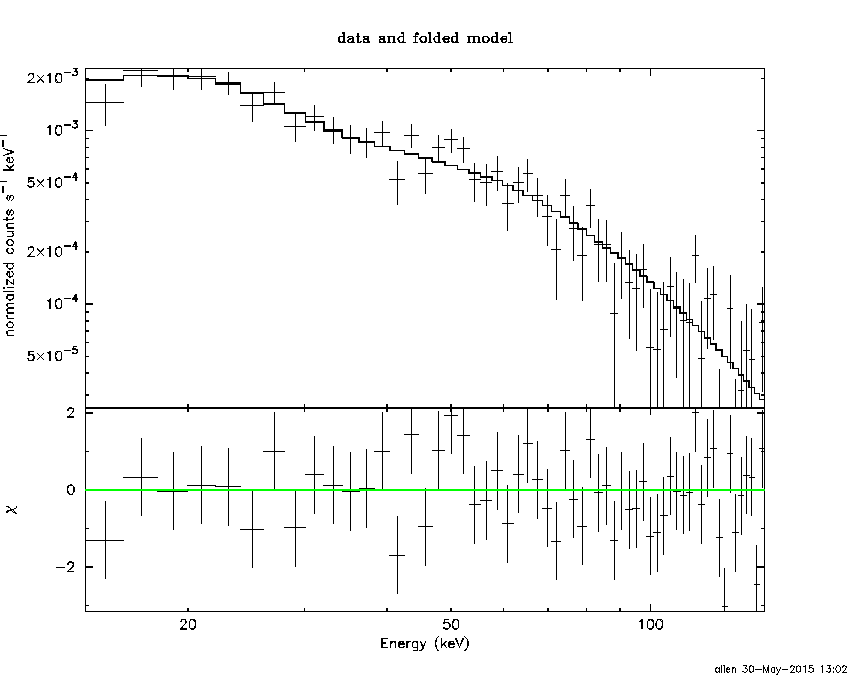
Spectral model in power-law:
------------------------------------------------------------
Parameters  : value       lower 90%   higher 90%
Photon index: 1.65097     ( -0.102781   0.103815 )
Norm@50keV  : 4.22085E-03    ( -0.000253961   0.000252693 )
------------------------------------------------------------
#Fit statistic : Chi-Squared =          59.14 using 59 PHA bins.
# Reduced chi-squared =          1.038 for     57 degrees of freedom
# Null hypothesis probability =   3.972088e-01

Photon flux (15-150 keV)    in 34.16 sec: 0.551316 ( -0.0325483  0.0325994 ) ph/cm2/s
Energy fluence (15-150 keV)             : 1.34083e-06 ( -8.54844e-08  8.60057e-08 ) ergs/cm2
Cutoff power-law model
Spectral model in the cutoff power-law:
------------------------------------------------------------
Parameters  : value       lower 90%   higher 90%
Photon index: 1.24898     ( -0.446411   0.402434 )
Epeak [keV] : 91.2346      ( -25.4843 4520.74 )
Norm@50keV  : 6.78487E-03    ( -0.00251339   0.00456421 )
------------------------------------------------------------
#Fit statistic : Chi-Squared =          56.24 using 59 PHA bins.
# Reduced chi-squared =          1.004 for     56 degrees of freedom
# Null hypothesis probability =   4.660443e-01

Photon flux (15-150 keV)    in 34.16 sec: 0.539755 ( -0.034477  0.034499 ) ph/cm2/s
Energy fluence (15-150 keV)             : 1.29794e-06 ( -9.61331e-08  9.62287e-08 ) ergs/cm2
Band function
Spectral model in the Band function:
------------------------------------------------------------
Parameters  : value       lower 90%   higher 90%
alpha       : -1.21766   ( -0.303017   1.21798 )
beta        : -2.07674    ( 2.0625   0.432806 )
Epeak [keV] : 86.4752      ( -60.3069 1207.19 )
Norm@50keV   : 7.08014E-03    ( -0.00266704   0.0407699 )
------------------------------------------------------------
#Fit statistic : Chi-Squared =          56.23 using 59 PHA bins.
# Reduced chi-squared =          1.022 for     55 degrees of freedom
# Null hypothesis probability =   4.285185e-01

Photon flux (15-150 keV)    in 34.16 sec:  (    ) ph/cm2/s
Energy fluence (15-150 keV)             : 1.29686e-06 ( 0  0 ) ergs/cm2
S(25-50 keV) vs. S(50-100 keV) plot
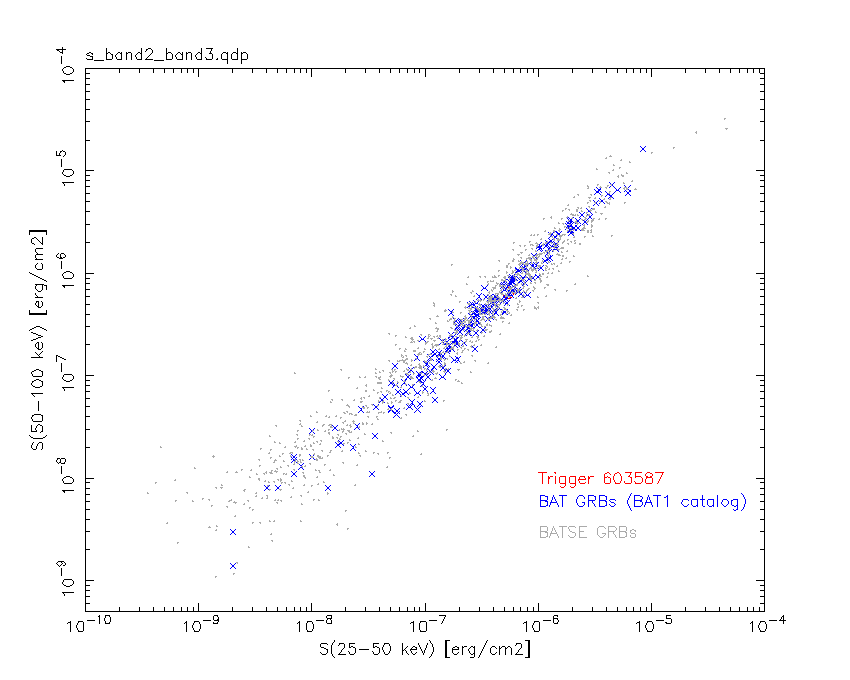
S(25-50 keV)  = 5.40e-07
S(50-100 keV) = 6.41e-07
T90 vs. Hardness ratio plot
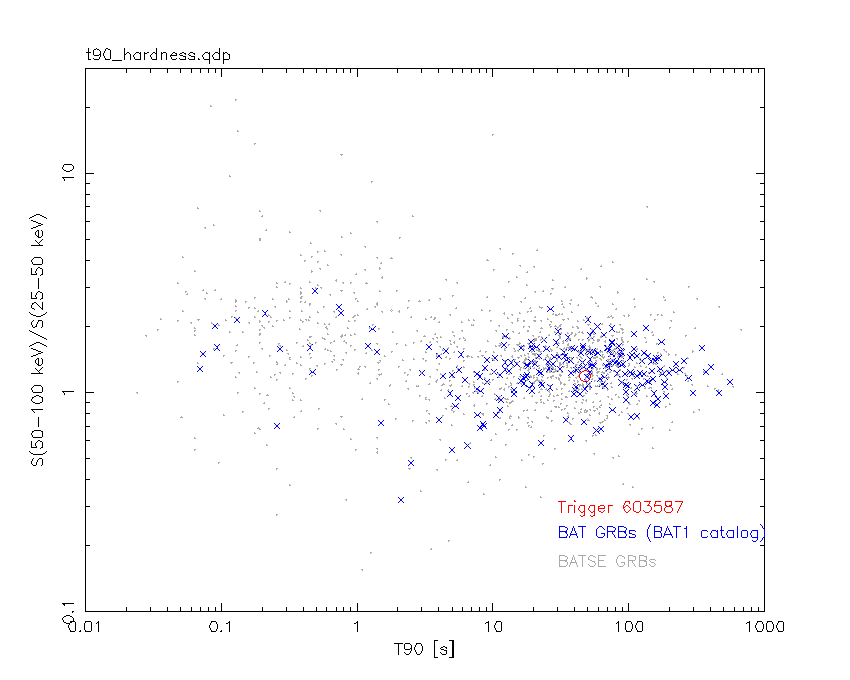
T90                                   = 47.8439999818802 sec.
Hardness ratio (energy fluence ratio) = 1.18704
Color vs. Color plot
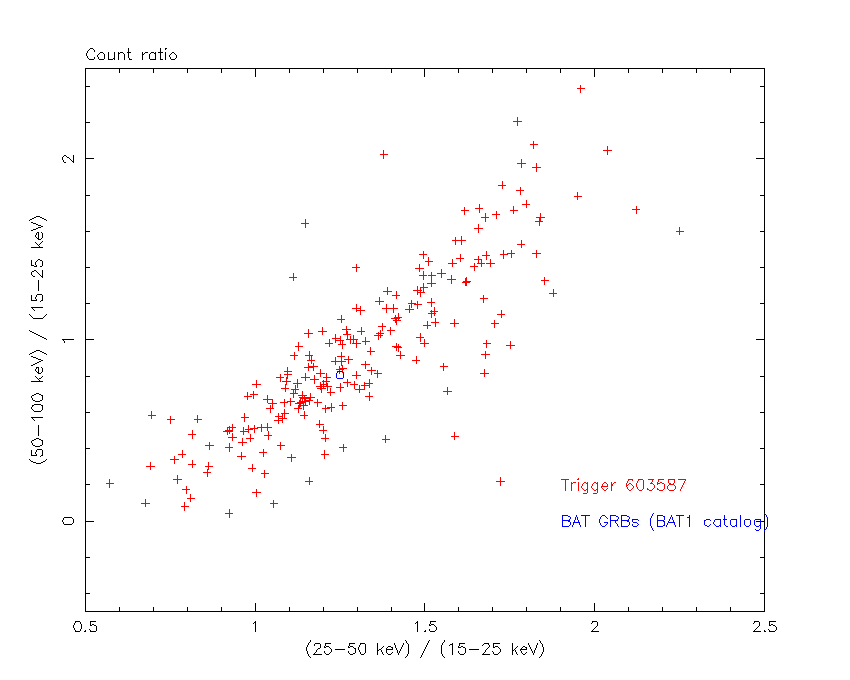
Count Ratio  (25-50 keV) / (15-25 keV) = 1.24953
Count Ratio (50-100 keV) / (15-25 keV) = 0.80615
Mask shadow pattern
IMX = -4.459586836262177E-01, IMY = 3.132597269884030E-01
TIME vs. PHA plot around the trigger time
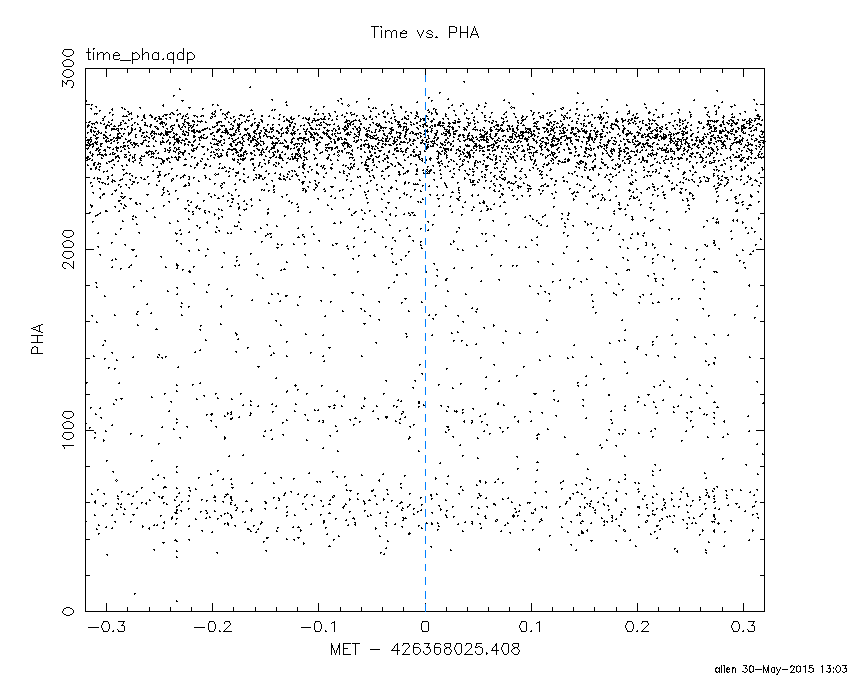
Blue+Cyan dotted lines: Time interval of the scaled map
From 0.000000 to 1.024000
TIME vs. DetID plot around the trigger time
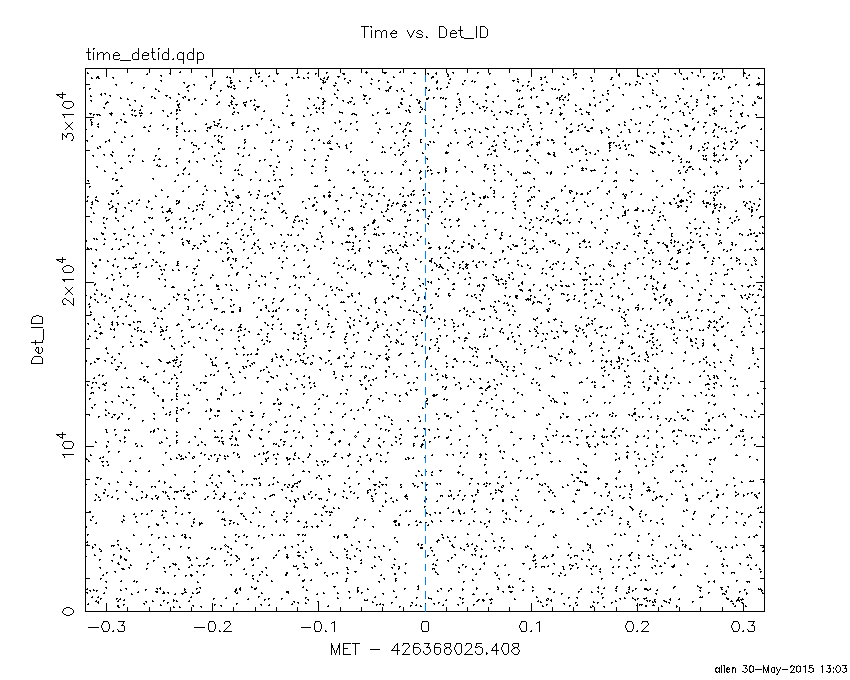
Blue+Cyan dotted lines: Time interval of the scaled map
From 0.000000 to 1.024000
100 us light curve (15-350 keV)

Blue+Cyan dotted lines: Time interval of the scaled map
From 0.000000 to 1.024000
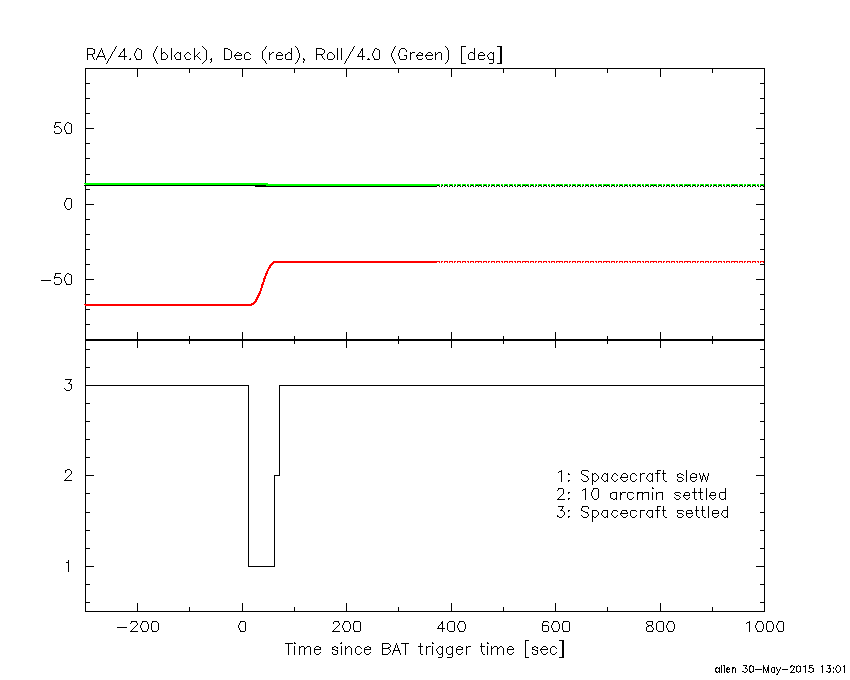
Spacecraft aspect plot
Bright source in the pre-burst/pre-slew/post-slew images
Pre-burst image of 15-350 keV band
Time interval of the image:
-239.408000 -21.264000

# RAcent  DECcent POSerr Theta    Phi  PeakCts   SNR AngSep     Name
#  [deg]    [deg]    ['] [deg]  [deg]                   [']
135.5398 -40.5553    4.0  51.8  -38.9   3.0714   2.9    0.5	Vela X-1
170.4972 -60.6793   11.8  45.5   -0.4  -0.3652  -1.0    6.3	Cen X-3
186.4113 -62.8278    5.4  46.8   10.3   0.9118   2.1    7.6	GX 301-2
 51.4055 -13.4406    3.4  53.2 -142.1   4.0294   3.4 ------	UNKNOWN
Pre-slew background subtracted image of 15-350 keV band
Time interval of the image:
-21.264000 12.892590

# RAcent  DECcent POSerr Theta    Phi  PeakCts   SNR AngSep     Name
#  [deg]    [deg]    ['] [deg]  [deg]                   [']
135.5234 -40.5665    7.5  51.8  -38.9   0.5109   1.5    0.7	Vela X-1
170.1288 -60.6043   30.8  45.5   -0.6   0.0483   0.4    5.6	Cen X-3
186.6054 -62.6105    5.5  47.0   10.3   0.3098   2.1    9.7	GX 301-2
331.7239 -51.6898    2.4  39.5  108.2   1.3487   4.9 ------	UNKNOWN
 49.2697 -38.0577    0.4  28.6 -144.9   2.2878  28.0 ------	UNKNOWN
Post-slew image of 15-350 keV band
Time interval of the image:
61.892590 962.606600

# RAcent  DECcent POSerr Theta    Phi  PeakCts   SNR AngSep     Name
#  [deg]    [deg]    ['] [deg]  [deg]                   [']
128.6916 -84.1592    3.1  51.1   31.4  11.1462   3.8 ------	UNKNOWN
127.6746 -52.4254    3.3  54.2   -8.6   5.3248   3.5 ------	UNKNOWN
 27.0454  17.1384    2.8  59.0 -166.1  15.6234   4.2 ------	UNKNOWN
 33.0969  18.6570    7.1  58.7 -159.2   7.9167   1.6 ------	UNKNOWN
111.1218 -29.3898    2.8  51.2  -41.4  13.9244   4.1 ------	UNKNOWN
Plot creation:
Sat May 30 13:03:15 EDT 2015