Click here for the BAT GCN circular template
Image
Pre-slew 15.0-350.0 keV image (Event data)

#   RAcent    DECcent   POSerr    Theta     Phi              Peak Cts       SNR   Name
  304.6659    51.2218   0.0043    36.8545    -4.4807         6.3428218     44.583 TRIG_00603810

Foreground time interval of the image:
-46.080  15.693 (delta_t =  61.773 [sec])
Background time interval of the image:
-239.408 -46.080 (delta_t = 193.328 [sec])
Lightcurves
Notes:
- 1) The mask-weighted light curves are using the flight position.
- 2) Multiple plots of different time binning/intervals are shown to cover all scenarios of short/long GRBs, rate/image triggers, and real/false positives.
- 3) For all the mask-weighted lightcurves, the y-axis units are counts/sec/det where a det is 0.4 x 0.4 = 0.16 sq cm.
- 4) The verticle lines correspond to following: green dotted lines are T50 interval, black dotted lines are T90 interval, blue solid line(s) is a spacecraft slew start time, and orange solid line(s) is a spacecraft slew end time.
- 5) Time of each bin is in the middle of the bin.
1 s binning
From T0-310 s to T0+310 s

From T100_start - 20 s to T100_end + 30 s
Full time interval

64 ms binning
Full time interval

From T100_start to T100_end
From T0-5 sec to T0+5 sec
16 ms binning
From T100_start-5 s to T100_start+5 s
Blue+Cyan dotted lines: Time interval of the scaled map
From 0.000000 to 1.024000
8 ms binning
From T100_start-3 s to T100_start+3 s

Blue+Cyan dotted lines: Time interval of the scaled map
From 0.000000 to 1.024000
2 ms binning
From T100_start-1 s to T100_start+1 s

Blue+Cyan dotted lines: Time interval of the scaled map
From 0.000000 to 1.024000
SN=5 or 10 sec. binning (whichever binning is satisfied first)
SN=5 or 10 sec. binning (T < 200 sec)

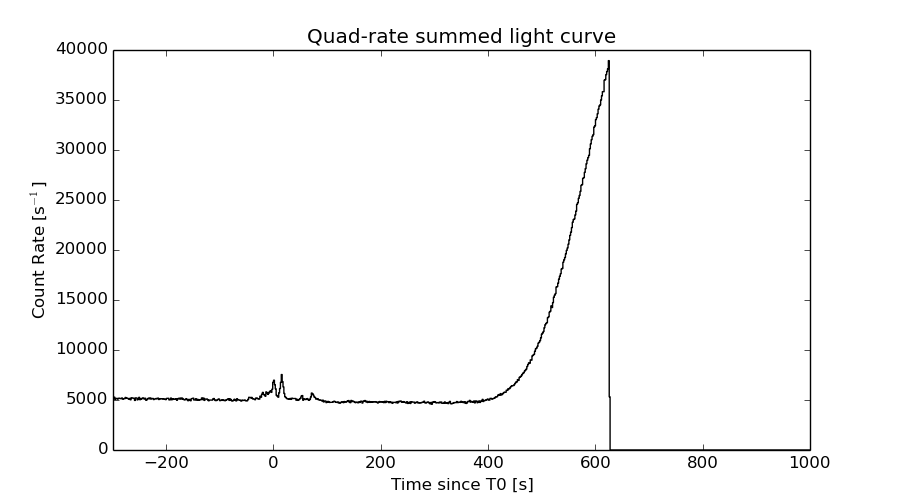
Quad-rate summed light curves (from T0-300s to T0+1000s)
Spectral Evolution

Spectra
Notes:
- 1) The fitting includes the systematic errors.
- 2) When the burst includes telescope slew time periods, the fitting uses an average response file made from multiple 5-s response files through out the slew time plus single time preiod for the non-slew times, and weighted by the total counts in the corresponding time period using addrmf. An average response file is needed becuase a spectral fit using the pre-slew DRM will introduce some errors in both a spectral shape and a normalization if the PHA file contains a lot of the slew/post-slew time interval.
- 3) For fits to more complicated models (e.g. a power-law over a cutoff power-law), the BAT team has decided to require a chi-square improvement of more than 6 for each extra dof.
Time averaged spectrum fit using the average DRM
Power-law model

Time interval is from  -46.080 sec. to   85.592 sec.

Spectral model in power-law:
------------------------------------------------------------
Parameters  : value       lower 90%   higher 90%
Photon index: 1.64498     ( -0.058949   0.0591576 )
Norm@50keV  : 4.54023E-03    ( -0.000145562   0.000145452 )
------------------------------------------------------------
#Fit statistic : Chi-Squared =          53.11 using 59 PHA bins.
# Reduced chi-squared =         0.9318 for     57 degrees of freedom
# Null hypothesis probability =   6.216123e-01

Photon flux (15-150 keV)    in 131.7 sec: 0.591865 ( -0.0205464  0.02061 ) ph/cm2/s
Energy fluence (15-150 keV)             : 5.56396e-06 ( -1.86321e-07  1.86697e-07 ) ergs/cm2
Cutoff power-law model

Time interval is from  -46.080 sec. to   85.592 sec.
Spectral model in the cutoff power-law:
------------------------------------------------------------
Parameters  : value       lower 90%   higher 90%
Photon index: 1.28409     ( -0.25531   0.241253 )
Epeak [keV] : 103.830      ( -22.9728 97.2523 )
Norm@50keV  : 6.76013E-03    ( -0.00154374   0.00214021 )
------------------------------------------------------------
#Fit statistic : Chi-Squared =          46.44 using 59 PHA bins.
# Reduced chi-squared =         0.8293 for     56 degrees of freedom
# Null hypothesis probability =   8.149764e-01

Photon flux (15-150 keV)    in 131.7 sec: 0.577007 ( -0.011292  0.022663 ) ph/cm2/s
Energy fluence (15-150 keV)             : 5.4243e-06 ( -2.10259e-07  2.09192e-07 ) ergs/cm2
Band function

Time interval is from  -46.080 sec. to   85.592 sec.

Spectral model in the Band function:
------------------------------------------------------------
Parameters  : value       lower 90%   higher 90%
alpha       : -1.06372   ( -0.416458   0.757189 )
beta        : -1.84768    ( 1.84768   0.15609 )
Epeak [keV] : 74.2152      ( -30.3536 87.392 )
Norm@50keV   : 9.08357E-03    ( -0.00360961   0.0200459 )
------------------------------------------------------------
#Fit statistic : Chi-Squared =          45.52 using 59 PHA bins.
# Reduced chi-squared =         0.8276 for     55 degrees of freedom
# Null hypothesis probability =   8.152053e-01

Photon flux (15-150 keV)    in 131.7 sec: 0.573524 ( 6.42648  -0.023227 ) ph/cm2/s
Energy fluence (15-150 keV)             : 5.41844e-06 ( -5.41752e-06  -2.06993e-07 ) ergs/cm2
Single BB

Spectral model blackbody:
------------------------------------------------------------
Parameters  : value    Lower 90%  Upper 90%
kT [keV]    : 14.8653  (  )
R^2/D10^2   : 6.50977E-02  (   )
(R is the radius in km and D10 is the distance to the source in units of 10 kpc)
------------------------------------------------------------
#Fit statistic : Chi-Squared =         232.80 using 59 PHA bins.
# Reduced chi-squared =         4.0842 for     57 degrees of freedom
# Null hypothesis probability =   4.155033e-23

Energy  Fluence     90% Error
[keV]   [erg/cm2]   [erg/cm2]
15- 25  3.972e-07   2.772e-08
25- 50  1.565e-06   6.717e-08
50-150  2.344e-06   1.534e-07
15-150  4.307e-06   1.501e-07
Thermal bremsstrahlung (OTTB)

Spectral model: thermal bremsstrahlung
------------------------------------------------------------
Parameters  : value         Lower 90%    Upper 90%
kT [keV]    : 164.587       (-24.5701      32.7388)
Norm        : 2.39995       (-0.0929502     0.0996664)
------------------------------------------------------------
#Fit statistic : Chi-Squared =          46.35 using 59 PHA bins.
# Reduced chi-squared =         0.8132 for     57 degrees of freedom
# Null hypothesis probability =   8.421728e-01

Energy  Fluence     90% Error
[keV]   [erg/cm2]   [erg/cm2]
15- 25  8.048e-07   4.906e-08
25- 50  1.511e-06   9.943e-08
50-150  3.096e-06   8.113e-07
15-150  5.412e-06   8.409e-07
Double BB

Spectral model: bbodyrad<1> + bbodyrad<2>
------------------------------------------------------------
Parameters  : value         Lower 90%    Upper 90%
kT1 [keV]   : 7.51694        (-1.01897      1.06879)
R1^2/D10^2  : 0.481912        (-0.166001      0.306413)
kT2 [keV]   : 25.7825        (-3.23687      4.77135)
R2^2/D10^2  : 6.80475E-03    (-0.00321125   0.00472654)
------------------------------------------------------------
#Fit statistic : Chi-Squared =          55.90 using 59 PHA bins.
# Reduced chi-squared =          1.016 for     55 degrees of freedom
# Null hypothesis probability =   4.408209e-01

Energy  Fluence     90% Error
[keV]   [erg/cm2]   [erg/cm2]
15- 25  7.185e-07   8.225e-08
25- 50  1.552e-06   1.218e-07
50-150  3.082e-06   3.279e-07
15-150  5.353e-06   4.162e-07
Peak spectrum fit
Power-law model

Time interval is from   15.476 sec. to   16.476 sec.

Spectral model in power-law:
------------------------------------------------------------
Parameters  : value       lower 90%   higher 90%
Photon index: 1.42653     ( -0.129823   0.129543 )
Norm@50keV  : 2.52837E-02    ( -0.00204036   0.00203877 )
------------------------------------------------------------
#Fit statistic : Chi-Squared =          63.78 using 59 PHA bins.
# Reduced chi-squared =          1.119 for     57 degrees of freedom
# Null hypothesis probability =   2.502787e-01

Photon flux (15-150 keV)    in 1 sec: 3.09814 ( -0.257596  0.25805 ) ph/cm2/s
Energy fluence (15-150 keV)             : 2.43021e-07 ( -2.10832e-08  2.11749e-08 ) ergs/cm2
Cutoff power-law model

Time interval is from   15.476 sec. to   16.476 sec.
Spectral model in the cutoff power-law:
------------------------------------------------------------
Parameters  : value       lower 90%   higher 90%
Photon index: 0.433435     ( -0.699192   0.600478 )
Epeak [keV] : 80.5771      ( -15.0822 45.9554 )
Norm@50keV  : 7.88589E-02    ( -0.0385475   0.0920968 )
------------------------------------------------------------
#Fit statistic : Chi-Squared =          55.15 using 59 PHA bins.
# Reduced chi-squared =         0.9848 for     56 degrees of freedom
# Null hypothesis probability =   5.070151e-01

Photon flux (15-150 keV)    in 1 sec: 2.99497 ( -0.26659  0.26616 ) ph/cm2/s
Energy fluence (15-150 keV)             : 2.29863e-07 ( -2.2694e-08  2.2816e-08 ) ergs/cm2
Band function

Time interval is from   15.476 sec. to   16.476 sec.

Spectral model in the Band function:
------------------------------------------------------------
Parameters  : value       lower 90%   higher 90%
alpha       : -0.241328   ( -0.725521   1.79254 )
beta        : -2.14347    ( 2.15118   0.540718 )
Epeak [keV] : 72.2824      ( -31.0904 43.3084 )
Norm@50keV   : 0.101878    ( -0.0576172   1.52672 )
------------------------------------------------------------
#Fit statistic : Chi-Squared =          54.53 using 59 PHA bins.
# Reduced chi-squared =         0.9914 for     55 degrees of freedom
# Null hypothesis probability =   4.926034e-01

Photon flux (15-150 keV)    in 1 sec:  (    ) ph/cm2/s
Energy fluence (15-150 keV)             : 2.30862e-07 ( -2.30855e-07  -2.2492e-08 ) ergs/cm2
Single BB

Spectral model blackbody:
------------------------------------------------------------
Parameters  : value    Lower 90%  Upper 90%
kT [keV]    : 15.8804  (-1.34805  1.51182)
R^2/D10^2   : 0.306199  (-0.0849476   0.113817)
(R is the radius in km and D10 is the distance to the source in units of 10 kpc)
------------------------------------------------------------
#Fit statistic : Chi-Squared =          70.64 using 59 PHA bins.
# Reduced chi-squared =          1.239 for     57 degrees of freedom
# Null hypothesis probability =   1.057581e-01

Energy  Fluence     90% Error
[keV]   [erg/cm2]   [erg/cm2]
15- 25  1.599e-08   2.490e-09
25- 50  6.686e-08   6.445e-09
50-150  1.175e-07   1.810e-08
15-150  2.004e-07   2.045e-08
Thermal bremsstrahlung (OTTB)

Spectral model: thermal bremsstrahlung
------------------------------------------------------------
Parameters  : value         Lower 90%    Upper 90%
kT [keV]    : 200.000       (      )
Norm        : 12.9273       (-1.03472     1.03467)
------------------------------------------------------------
#Fit statistic : Chi-Squared =          61.95 using 59 PHA bins.
# Reduced chi-squared =          1.087 for     57 degrees of freedom
# Null hypothesis probability =   3.039311e-01

Energy  Fluence     90% Error
[keV]   [erg/cm2]   [erg/cm2]
15- 25  3.219e-08   3.480e-09
25- 50  6.192e-08   8.250e-09
50-150  1.358e-07   5.016e-08
15-150  2.299e-07   5.305e-08
Double BB

Spectral model: bbodyrad<1> + bbodyrad<2>
------------------------------------------------------------
Parameters  : value         Lower 90%    Upper 90%
kT1 [keV]   : 7.26709        (-2.91339      5.76833)
R1^2/D10^2  : 2.03199        (-1.51774      9.40448)
kT2 [keV]   : 21.6786        (-4.24113      72.9165)
R2^2/D10^2  : 8.23094E-02    (-0.0805063   0.120017)
------------------------------------------------------------
#Fit statistic : Chi-Squared =          55.89 using 59 PHA bins.
# Reduced chi-squared =          1.016 for     55 degrees of freedom
# Null hypothesis probability =   4.411354e-01

Energy  Fluence     90% Error
[keV]   [erg/cm2]   [erg/cm2]
15- 25  2.510e-08   1.172e-08
25- 50  6.410e-08   2.549e-08
50-150  1.376e-07   6.699e-08
15-150  2.267e-07   9.595e-08
Pre-slew spectrum (Pre-slew PHA with pre-slew DRM)
Power-law model

Spectral model in power-law:
------------------------------------------------------------
Parameters  : value       lower 90%   higher 90%
Photon index: 1.56933     ( -0.064445   0.064601 )
Norm@50keV  : 6.70413E-03    ( -0.000236412   0.000236317 )
------------------------------------------------------------
#Fit statistic : Chi-Squared =          54.23 using 59 PHA bins.
# Reduced chi-squared =         0.9513 for     57 degrees of freedom
# Null hypothesis probability =   5.798201e-01

Photon flux (15-150 keV)    in 61.77 sec: 0.853527 ( -0.0326469  0.0327452 ) ph/cm2/s
Energy fluence (15-150 keV)             : 3.88809e-06 ( -1.44456e-07  1.44717e-07 ) ergs/cm2
Cutoff power-law model

Spectral model in the cutoff power-law:
------------------------------------------------------------
Parameters  : value       lower 90%   higher 90%
Photon index: 1.28704     ( -0.272877   0.256954 )
Epeak [keV] : 134.876      ( -41.4955 603.94 )
Norm@50keV  : 9.11699E-03    ( -0.00217666   0.00306548 )
------------------------------------------------------------
#Fit statistic : Chi-Squared =          50.70 using 59 PHA bins.
# Reduced chi-squared =         0.9054 for     56 degrees of freedom
# Null hypothesis probability =   6.750061e-01

Photon flux (15-150 keV)    in 61.77 sec: 0.837748 ( -0.035369  0.03553 ) ph/cm2/s
Energy fluence (15-150 keV)             : 3.81941e-06 ( -1.59157e-07  1.58422e-07 ) ergs/cm2
Band function

Spectral model in the Band function:
------------------------------------------------------------
Parameters  : value       lower 90%   higher 90%
alpha       : -1.03564   ( -0.522372   0.701928 )
beta        : -1.72788    ( 1.73033   0.150816 )
Epeak [keV] : 82.2785      ( -42.4696 138.053 )
Norm@50keV   : 1.27313E-02    ( -0.00497787   0.0268721 )
------------------------------------------------------------
#Fit statistic : Chi-Squared =          49.93 using 59 PHA bins.
# Reduced chi-squared =         0.9079 for     55 degrees of freedom
# Null hypothesis probability =   6.680559e-01

Photon flux (15-150 keV)    in 61.77 sec:  (    ) ph/cm2/s
Energy fluence (15-150 keV)             : 3.81124e-06 ( -3.81081e-06  -1.56778e-07 ) ergs/cm2
S(25-50 keV) vs. S(50-100 keV) plot

S(25-50 keV)  = 1.47e-06
S(50-100 keV) = 1.88e-06
T90 vs. Hardness ratio plot
T90                                   = 105.191999912262 sec.
Hardness ratio (energy fluence ratio) = 1.27891
Color vs. Color plot

Count Ratio  (25-50 keV) / (15-25 keV) = 1.38176
Count Ratio (50-100 keV) / (15-25 keV) = 0.994472
Mask shadow pattern

IMX = 7.472891178422966E-01, IMY = 5.855921367516614E-02
TIME vs. PHA plot around the trigger time

Blue+Cyan dotted lines: Time interval of the scaled map
From 0.000000 to 1.024000
TIME vs. DetID plot around the trigger time

Blue+Cyan dotted lines: Time interval of the scaled map
From 0.000000 to 1.024000
100 us light curve (15-350 keV)

Blue+Cyan dotted lines: Time interval of the scaled map
From 0.000000 to 1.024000
Spacecraft aspect plot

Bright source in the pre-burst/pre-slew/post-slew images
Pre-burst image of 15-350 keV band
Time interval of the image:
-239.408000 -46.080000

# RAcent  DECcent POSerr Theta    Phi  PeakCts   SNR AngSep     Name
#  [deg]    [deg]    ['] [deg]  [deg]                   [']
254.6346  35.2533    6.4   4.6  109.0   0.3264   1.8   10.2	Her X-1
299.5869  35.1769    1.6  36.5   23.2   2.0369   7.3    1.5	Cyg X-1
307.9348  41.0734    0.0  40.8   10.9   0.3100   1.0   10.8	Cyg X-3
326.1666  38.2324    4.3  54.9    7.5   2.2414   2.7    5.4	Cyg X-2
274.4683   5.1405    2.6  39.4   86.9   3.2854   4.4 ------	UNKNOWN
223.4007  13.1431    2.6  37.5  174.3   1.1892   4.5 ------	UNKNOWN
210.4738  13.2635    2.8  46.0 -171.7   1.3912   4.1 ------	UNKNOWN
Pre-slew background subtracted image of 15-350 keV band
Time interval of the image:
-46.080000 15.692600

# RAcent  DECcent POSerr Theta    Phi  PeakCts   SNR AngSep     Name
#  [deg]    [deg]    ['] [deg]  [deg]                   [']
254.5025  35.2649    4.4   4.6  110.3  -0.2819  -2.6    5.1	Her X-1
299.5589  35.2655    7.5  36.4   23.1  -0.2660  -1.5    4.1	Cyg X-1
308.1923  40.9984    6.3  41.0   10.9   0.3215   1.8    4.6	Cyg X-3
326.1838  38.3909    8.9  54.8    7.3  -0.6292  -1.3    4.2	Cyg X-2
304.6659  51.2218    0.3  36.9   -4.5   6.3426  44.6 ------	UNKNOWN
205.1652   8.1894    2.6  53.3 -171.8   1.4280   4.4 ------	UNKNOWN
Post-slew image of 15-350 keV band
Time interval of the image:
72.092600 662.882000

# RAcent  DECcent POSerr Theta    Phi  PeakCts   SNR AngSep     Name
#  [deg]    [deg]    ['] [deg]  [deg]                   [']
254.4458  35.4653    5.5  38.8  160.5  -7.9274  -2.1    7.4	Her X-1
299.4933  35.2179    7.0  16.4   89.5   4.0031   1.6    4.9	Cyg X-1
308.1937  40.9203    3.2  10.6   59.7   7.0504   3.6    4.2	Cyg X-3
326.2733  38.1673   12.0  20.0   16.7  -2.0127  -1.0   10.4	Cyg X-2
278.4092  22.0450    2.4  35.6  119.2  22.2215   4.8 ------	UNKNOWN
354.6008  14.7434    4.0  54.0    8.2  19.5123   2.9 ------	UNKNOWN
220.3019  45.2515    2.4  53.3 -166.4  34.0914   4.9 ------	UNKNOWN
 13.7800  26.5886    3.1  56.7  -17.7  31.5050   3.8 ------	UNKNOWN
Plot creation:
Sat May 30 13:01:33 EDT 2015