Click here for the BAT GCN circular template
Image
Pre-slew 15.0-350.0 keV image (Event data)
#   RAcent    DECcent   POSerr    Theta     Phi              Peak Cts       SNR   Name
  146.0490    63.5356   0.0052    10.3626  -125.1465         3.8749109     36.517 TRIG_00603866

Foreground time interval of the image:
-18.496  50.053 (delta_t =  68.549 [sec])
Background time interval of the image:
-608.047 -590.677 (delta_t =  17.371 [sec])
-239.248 -18.496 (delta_t = 220.752 [sec])
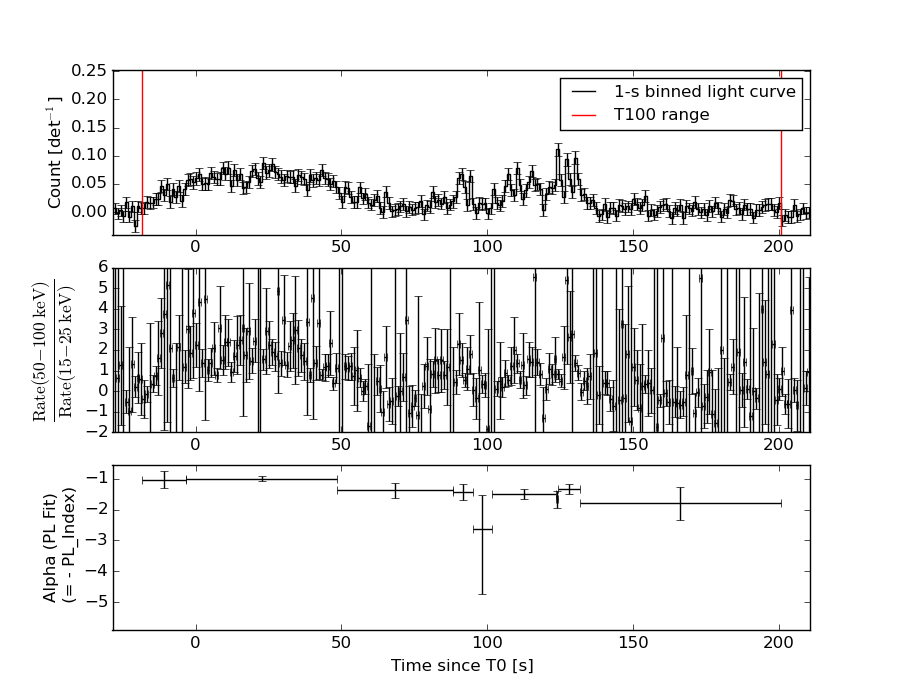
Lightcurves
Notes:
- 1) The mask-weighted light curves are using the flight position.
- 2) Multiple plots of different time binning/intervals are shown to cover all scenarios of short/long GRBs, rate/image triggers, and real/false positives.
- 3) For all the mask-weighted lightcurves, the y-axis units are counts/sec/det where a det is 0.4 x 0.4 = 0.16 sq cm.
- 4) The verticle lines correspond to following: green dotted lines are T50 interval, black dotted lines are T90 interval, blue solid line(s) is a spacecraft slew start time, and orange solid line(s) is a spacecraft slew end time.
- 5) Time of each bin is in the middle of the bin.
1 s binning
From T0-310 s to T0+310 s
From T100_start - 20 s to T100_end + 30 s
Full time interval

64 ms binning
Full time interval

From T100_start to T100_end

From T0-5 sec to T0+5 sec
16 ms binning
From T100_start-5 s to T100_start+5 s
Blue+Cyan dotted lines: Time interval of the scaled map
From 0.000000 to 4.096000
8 ms binning
From T100_start-3 s to T100_start+3 s
Blue+Cyan dotted lines: Time interval of the scaled map
From 0.000000 to 4.096000
2 ms binning
From T100_start-1 s to T100_start+1 s
Blue+Cyan dotted lines: Time interval of the scaled map
From 0.000000 to 4.096000
SN=5 or 10 sec. binning (whichever binning is satisfied first)

SN=5 or 10 sec. binning (T < 200 sec)

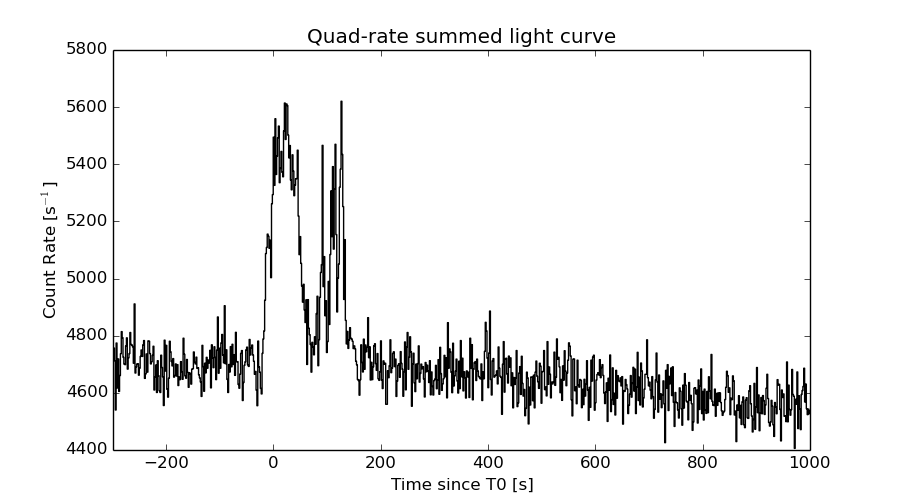
Quad-rate summed light curves (from T0-300s to T0+1000s)
Spectral Evolution
Spectra
Notes:
- 1) The fitting includes the systematic errors.
- 2) When the burst includes telescope slew time periods, the fitting uses an average response file made from multiple 5-s response files through out the slew time plus single time preiod for the non-slew times, and weighted by the total counts in the corresponding time period using addrmf. An average response file is needed becuase a spectral fit using the pre-slew DRM will introduce some errors in both a spectral shape and a normalization if the PHA file contains a lot of the slew/post-slew time interval.
- 3) For fits to more complicated models (e.g. a power-law over a cutoff power-law), the BAT team has decided to require a chi-square improvement of more than 6 for each extra dof.
Time averaged spectrum fit using the average DRM
Power-law model
Time interval is from  -18.496 sec. to  200.720 sec.

Spectral model in power-law:
------------------------------------------------------------
Parameters  : value       lower 90%   higher 90%
Photon index: 1.23408     ( -0.0726564   0.0723124 )
Norm@50keV  : 1.96688E-03    ( -7.746e-05   7.74547e-05 )
------------------------------------------------------------
#Fit statistic : Chi-Squared =          56.42 using 59 PHA bins.
# Reduced chi-squared =         0.9898 for     57 degrees of freedom
# Null hypothesis probability =   4.967663e-01

Photon flux (15-150 keV)    in 219.2 sec: 0.232040 ( -0.0095934  0.00961092 ) ph/cm2/s
Energy fluence (15-150 keV)             : 4.33317e-06 ( -1.8714e-07  1.87753e-07 ) ergs/cm2
Cutoff power-law model
Time interval is from  -18.496 sec. to  200.720 sec.
Spectral model in the cutoff power-law:
------------------------------------------------------------
Parameters  : value       lower 90%   higher 90%
Photon index: 0.838804     ( -0.311596   0.290594 )
Epeak [keV] : 162.081      ( -48.0138 267.65 )
Norm@50keV  : 2.98271E-03    ( -0.000768864   0.0011179 )
------------------------------------------------------------
#Fit statistic : Chi-Squared =          50.90 using 59 PHA bins.
# Reduced chi-squared =         0.9090 for     56 degrees of freedom
# Null hypothesis probability =   6.676338e-01

Photon flux (15-150 keV)    in 219.2 sec: 0.226650 ( -0.010321  0.010332 ) ph/cm2/s
Energy fluence (15-150 keV)             : 4.22074e-06 ( -2.07319e-07  2.06421e-07 ) ergs/cm2
Band function

Time interval is from  -18.496 sec. to  200.720 sec.

Spectral model in the Band function:
------------------------------------------------------------
Parameters  : value       lower 90%   higher 90%
alpha       : -0.838822   ( -0.209045   0.269667 )
beta        : -10.0000    ( 10   1.77636e-15 )
Epeak [keV] : 162.063      ( -27.1926 265.922 )
Norm@50keV   : 2.98248E-03    ( -0.00076866   0.00111762 )
------------------------------------------------------------
#Fit statistic : Chi-Squared =          50.90 using 59 PHA bins.
# Reduced chi-squared =         0.9255 for     55 degrees of freedom
# Null hypothesis probability =   6.317957e-01

Photon flux (15-150 keV)    in 219.2 sec: 0.226780 (    ) ph/cm2/s
Energy fluence (15-150 keV)             : 0 ( 0  0 ) ergs/cm2
Single BB
Spectral model blackbody:
------------------------------------------------------------
Parameters  : value    Lower 90%  Upper 90%
kT [keV]    : 18.8606  (  )
R^2/D10^2   : 1.26506E-02  (   )
(R is the radius in km and D10 is the distance to the source in units of 10 kpc)
------------------------------------------------------------
#Fit statistic : Chi-Squared =         143.59 using 59 PHA bins.
# Reduced chi-squared =         2.5191 for     57 degrees of freedom
# Null hypothesis probability =   2.031537e-09

Energy  Fluence     90% Error
[keV]   [erg/cm2]   [erg/cm2]
15- 25  1.944e-07   1.639e-08
25- 50  9.302e-07   5.601e-08
50-150  2.428e-06   1.830e-07
15-150  3.553e-06   1.797e-07
Thermal bremsstrahlung (OTTB)

Spectral model: thermal bremsstrahlung
------------------------------------------------------------
Parameters  : value         Lower 90%    Upper 90%
kT [keV]    : 200.000       (      )
Norm        : 0.971524       (-0.038822     0.0388095)
------------------------------------------------------------
#Fit statistic : Chi-Squared =         107.43 using 59 PHA bins.
# Reduced chi-squared =         1.8847 for     57 degrees of freedom
# Null hypothesis probability =   6.135074e-05

Energy  Fluence     90% Error
[keV]   [erg/cm2]   [erg/cm2]
15- 25  5.304e-07   2.411e-08
25- 50  1.020e-06   4.252e-08
50-150  2.238e-06   9.711e-08
15-150  3.789e-06   1.600e-07
Double BB
Spectral model: bbodyrad<1> + bbodyrad<2>
------------------------------------------------------------
Parameters  : value         Lower 90%    Upper 90%
kT1 [keV]   : 8.32235        (-1.43563      1.58267)
R1^2/D10^2  : 0.104366        (-0.0412831      0.0841396)
kT2 [keV]   : 30.1675        (-4.18996      6.75373)
R2^2/D10^2  : 2.20640E-03    (-0.00109281   0.0015461)
------------------------------------------------------------
#Fit statistic : Chi-Squared =          51.65 using 59 PHA bins.
# Reduced chi-squared =         0.9391 for     55 degrees of freedom
# Null hypothesis probability =   6.033050e-01

Energy  Fluence     90% Error
[keV]   [erg/cm2]   [erg/cm2]
15- 25  3.632e-07   6.938e-08
25- 50  9.758e-07   1.310e-07
50-150  2.886e-06   4.372e-07
15-150  4.225e-06   6.565e-07
Peak spectrum fit
Power-law model
Time interval is from  123.632 sec. to  124.632 sec.

Spectral model in power-law:
------------------------------------------------------------
Parameters  : value       lower 90%   higher 90%
Photon index: 1.64014     ( -0.251072   0.262587 )
Norm@50keV  : 7.02225E-03    ( -0.00123796   0.00121348 )
------------------------------------------------------------
#Fit statistic : Chi-Squared =          55.12 using 59 PHA bins.
# Reduced chi-squared =         0.9669 for     57 degrees of freedom
# Null hypothesis probability =   5.460780e-01

Photon flux (15-150 keV)    in 1 sec: 0.913973 ( -0.142263  0.142269 ) ph/cm2/s
Energy fluence (15-150 keV)             : 6.5376e-08 ( -1.20983e-08  1.24082e-08 ) ergs/cm2
Cutoff power-law model
Time interval is from  123.632 sec. to  124.632 sec.
Spectral model in the cutoff power-law:
------------------------------------------------------------
Parameters  : value       lower 90%   higher 90%
Photon index: 0.244266     ( -2.4239   1.35262 )
Epeak [keV] : 52.3294      ( -13.0298 214.275 )
Norm@50keV  : 4.53207E-02    ( -0.045502   1.29303 )
------------------------------------------------------------
#Fit statistic : Chi-Squared =          52.02 using 59 PHA bins.
# Reduced chi-squared =         0.9289 for     56 degrees of freedom
# Null hypothesis probability =   6.263992e-01

Photon flux (15-150 keV)    in 1 sec: 0.877074 ( -0.150397  0.148446 ) ph/cm2/s
Energy fluence (15-150 keV)             : 5.6367e-08 ( -1.40056e-08  1.5345e-08 ) ergs/cm2
Band function
Time interval is from  123.632 sec. to  124.632 sec.

Spectral model in the Band function:
------------------------------------------------------------
Parameters  : value       lower 90%   higher 90%
alpha       : 0.797159   ( -1.76604   -0.827275 )
beta        : -2.42207    ( 2.42511   0.721116 )
Epeak [keV] : 42.7906      ( -14.7869 25.8948 )
Norm@50keV   : 0.214831    ( -0.251046   93.6383 )
------------------------------------------------------------
#Fit statistic : Chi-Squared =          49.86 using 59 PHA bins.
# Reduced chi-squared =         0.9065 for     55 degrees of freedom
# Null hypothesis probability =   6.707905e-01

Photon flux (15-150 keV)    in 1 sec:  (    ) ph/cm2/s
Energy fluence (15-150 keV)             : 5.89211e-08 ( -5.89141e-08  -1.30723e-08 ) ergs/cm2
Single BB
Spectral model blackbody:
------------------------------------------------------------
Parameters  : value    Lower 90%  Upper 90%
kT [keV]    : 11.1854  (-1.68345  2.09046)
R^2/D10^2   : 0.303833  (-0.141808   0.245957)
(R is the radius in km and D10 is the distance to the source in units of 10 kpc)
------------------------------------------------------------
#Fit statistic : Chi-Squared =          53.88 using 59 PHA bins.
# Reduced chi-squared =         0.9453 for     57 degrees of freedom
# Null hypothesis probability =   5.927086e-01

Energy  Fluence     90% Error
[keV]   [erg/cm2]   [erg/cm2]
15- 25  7.968e-09   1.956e-09
25- 50  2.302e-08   4.945e-09
50-150  1.647e-08   6.666e-09
15-150  4.746e-08   1.101e-08
Thermal bremsstrahlung (OTTB)
Spectral model: thermal bremsstrahlung
------------------------------------------------------------
Parameters  : value         Lower 90%    Upper 90%
kT [keV]    : 131.493       (-60.0243      -129.876)
Norm        : 3.87397       (-0.658085     0.858514)
------------------------------------------------------------
#Fit statistic : Chi-Squared =          53.40 using 59 PHA bins.
# Reduced chi-squared =         0.9368 for     57 degrees of freedom
# Null hypothesis probability =   6.109445e-01

Energy  Fluence     90% Error
[keV]   [erg/cm2]   [erg/cm2]
15- 25  1.004e-08   5.659e-09
25- 50  1.825e-08   1.005e-08
50-150  3.401e-08   2.186e-08
15-150  6.230e-08   3.700e-08
Double BB
------------------------------------------------------------
Parameters  : value         Lower 90%    Upper 90%
kT1 [keV]   : 9.60078        (-2.17709      2.38664)
R1^2/D10^2  : 0.469385        (-0.207125      0.512193)
kT2 [keV]   : 59.7130        (-34.8967      -52.4878)
R2^2/D10^2  : 5.89812E-04    (   )
------------------------------------------------------------
#Fit statistic : Chi-Squared =          48.73 using 59 PHA bins.
#Fit statistic : Chi-Squared =          48.69 using 59 PHA bins.
# Reduced chi-squared =         0.8860 for     55 degrees of freedom
# Reduced chi-squared =         0.8853 for     55 degrees of freedom
# Null hypothesis probability =   7.115729e-01
# Null hypothesis probability =   7.128531e-01

Energy  Fluence     90% Error
[keV]   [erg/cm2]   [erg/cm2]
15- 25  8.957e-09   3.828e-09
25- 50  2.179e-08   1.038e-08
50-150  3.194e-08   1.582e-08
15-150  6.269e-08   2.858e-08
Pre-slew spectrum (Pre-slew PHA with pre-slew DRM)
Power-law model

Spectral model in power-law:
------------------------------------------------------------
Parameters  : value       lower 90%   higher 90%
Photon index: 1.00447     ( -0.0731467   0.0722922 )
Norm@50keV  : 3.53811E-03    ( -0.000143235   0.000142932 )
------------------------------------------------------------
#Fit statistic : Chi-Squared =          60.47 using 59 PHA bins.
# Reduced chi-squared =          1.061 for     57 degrees of freedom
# Null hypothesis probability =   3.518394e-01

Photon flux (15-150 keV)    in 68.55 sec: 0.407406 ( -0.0168489  0.0169435 ) ph/cm2/s
Energy fluence (15-150 keV)             : 2.6185e-06 ( -1.11375e-07  1.11707e-07 ) ergs/cm2
Cutoff power-law model
Spectral model in the cutoff power-law:
------------------------------------------------------------
Parameters  : value       lower 90%   higher 90%
Photon index: 0.606274     ( -0.312491   0.290488 )
Epeak [keV] : 206.114      ( -64.8067 353.959 )
Norm@50keV  : 5.24466E-03    ( -0.0012789   0.00181371 )
------------------------------------------------------------
#Fit statistic : Chi-Squared =          54.85 using 59 PHA bins.
# Reduced chi-squared =         0.9794 for     56 degrees of freedom
# Null hypothesis probability =   5.185706e-01

Photon flux (15-150 keV)    in 68.55 sec: 0.398873 ( -0.01795  0.017965 ) ph/cm2/s
Energy fluence (15-150 keV)             : 2.56705e-06 ( -1.19743e-07  1.19181e-07 ) ergs/cm2
Band function
Spectral model in the Band function:
------------------------------------------------------------
Parameters  : value       lower 90%   higher 90%
alpha       : 4.99998   ( -4.99998   -4.99998 )
beta        : -1.02267    ( -0.0758669   0.0760288 )
Epeak [keV] : 24.2749      ( -24.2749 5.49774 )
Norm@50keV   : 282.336    ( -11.1125   493326 )
------------------------------------------------------------
#Fit statistic : Chi-Squared =          59.44 using 59 PHA bins.
# Reduced chi-squared =          1.081 for     55 degrees of freedom
# Null hypothesis probability =   3.171845e-01

Photon flux (15-150 keV)    in 68.55 sec:  (    ) ph/cm2/s
Energy fluence (15-150 keV)             : 0 ( 0  0 ) ergs/cm2
S(25-50 keV) vs. S(50-100 keV) plot
S(25-50 keV)  = 9.29e-07
S(50-100 keV) = 1.58e-06
T90 vs. Hardness ratio plot

T90                                   = 156.731999993324 sec.
Hardness ratio (energy fluence ratio) = 1.70075
Color vs. Color plot
Count Ratio  (25-50 keV) / (15-25 keV) = 1.67776
Count Ratio (50-100 keV) / (15-25 keV) = 1.4583
Mask shadow pattern

IMX = -1.052671011381097E-01, IMY = 1.495215824736000E-01
TIME vs. PHA plot around the trigger time
Blue+Cyan dotted lines: Time interval of the scaled map
From 0.000000 to 4.096000
TIME vs. DetID plot around the trigger time
Blue+Cyan dotted lines: Time interval of the scaled map
From 0.000000 to 4.096000
100 us light curve (15-350 keV)

Blue+Cyan dotted lines: Time interval of the scaled map
From 0.000000 to 4.096000
Spacecraft aspect plot
Bright source in the pre-burst/pre-slew/post-slew images
Pre-burst image of 15-350 keV band
Time interval of the image:
-608.047400 -590.676500
-239.248000 -18.496000

# RAcent  DECcent POSerr Theta    Phi  PeakCts   SNR AngSep     Name
#  [deg]    [deg]    ['] [deg]  [deg]                   [']
 28.1447  49.6000    2.7  51.5   -7.5   1.8589   4.3 ------	UNKNOWN
171.5777  16.7686    2.7  57.6 -165.4   3.9147   4.3 ------	UNKNOWN
166.2272  15.2050    6.0  58.7 -159.2   2.7033   1.9 ------	UNKNOWN
Pre-slew background subtracted image of 15-350 keV band
Time interval of the image:
-18.496000 50.052600

# RAcent  DECcent POSerr Theta    Phi  PeakCts   SNR AngSep     Name
#  [deg]    [deg]    ['] [deg]  [deg]                   [']
146.0497  63.5348    0.3  10.4 -125.1   3.9183  36.9 ------	UNKNOWN
Post-slew image of 15-350 keV band
Time interval of the image:
80.052600 962.908800

# RAcent  DECcent POSerr Theta    Phi  PeakCts   SNR AngSep     Name
#  [deg]    [deg]    ['] [deg]  [deg]                   [']
359.9812  59.5313    3.2  54.3   21.0  11.6961   3.6 ------	UNKNOWN
210.0336  84.3587    1.9  24.5   53.7   3.7402   5.9 ------	UNKNOWN
145.9665  63.4294    2.2   0.1 -109.8   2.5765   5.1 ------	UNKNOWN
 92.0341  70.6823    2.7  21.4   -6.0   2.0160   4.2 ------	UNKNOWN
 63.0314  56.4103    2.6  39.2  -19.1   2.9178   4.5 ------	UNKNOWN
163.6630   6.1962    4.2  58.7 -159.2  12.2227   2.8 ------	UNKNOWN
 88.5822  34.9279    2.7  44.9  -60.0   9.5818   4.2 ------	UNKNOWN
Plot creation:
Sat May 30 12:59:36 EDT 2015