Special notes of this burst
Image
Pre-slew 15.0-350.0 keV image (Event data)
#   RAcent    DECcent   POSerr    Theta     Phi              Peak Cts       SNR   Name
   41.0866    35.4987   0.0150    36.6899  -152.2813         0.4147422     12.824 TRIG_00603954

Foreground time interval of the image:
 -0.288   3.712 (delta_t =   4.000 [sec])
Background time interval of the image:
-617.787 -528.074 (delta_t =  89.713 [sec])
-239.288  -0.288 (delta_t = 239.000 [sec])
Lightcurves
Notes:
- 1) The mask-weighted light curves are using the flight position.
- 2) Multiple plots of different time binning/intervals are shown to cover all scenarios of short/long GRBs, rate/image triggers, and real/false positives.
- 3) For all the mask-weighted lightcurves, the y-axis units are counts/sec/det where a det is 0.4 x 0.4 = 0.16 sq cm.
- 4) The verticle lines correspond to following: green dotted lines are T50 interval, black dotted lines are T90 interval, blue solid line(s) is a spacecraft slew start time, and orange solid line(s) is a spacecraft slew end time.
- 5) Time of each bin is in the middle of the bin.
1 s binning
From T0-310 s to T0+310 s
From T100_start - 20 s to T100_end + 30 s
Full time interval

64 ms binning
Full time interval
From T100_start to T100_end

From T0-5 sec to T0+5 sec

16 ms binning
From T100_start-5 s to T100_start+5 s
Blue+Cyan dotted lines: Time interval of the scaled map
From 0.000000 to 1.024000
8 ms binning
From T100_start-3 s to T100_start+3 s

Blue+Cyan dotted lines: Time interval of the scaled map
From 0.000000 to 1.024000
2 ms binning
From T100_start-1 s to T100_start+1 s
Blue+Cyan dotted lines: Time interval of the scaled map
From 0.000000 to 1.024000
SN=5 or 10 sec. binning (whichever binning is satisfied first)

SN=5 or 10 sec. binning (T < 200 sec)
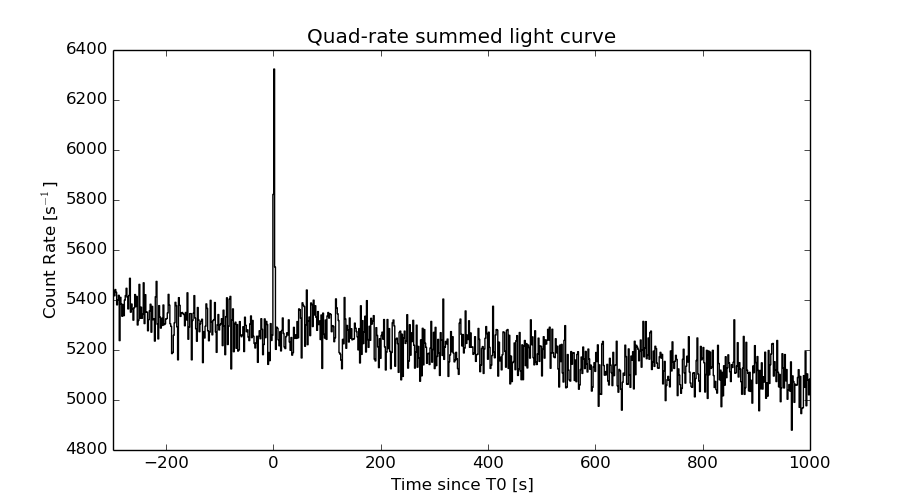
Quad-rate summed light curves (from T0-300s to T0+1000s)
Spectral Evolution

Spectra
Notes:
- 1) The fitting includes the systematic errors.
- 2) When the burst includes telescope slew time periods, the fitting uses an average response file made from multiple 5-s response files through out the slew time plus single time preiod for the non-slew times, and weighted by the total counts in the corresponding time period using addrmf. An average response file is needed becuase a spectral fit using the pre-slew DRM will introduce some errors in both a spectral shape and a normalization if the PHA file contains a lot of the slew/post-slew time interval.
- 3) For fits to more complicated models (e.g. a power-law over a cutoff power-law), the BAT team has decided to require a chi-square improvement of more than 6 for each extra dof.
Time averaged spectrum fit using the average DRM
Power-law model

Time interval is from   -0.288 sec. to    3.712 sec.

Spectral model in power-law:
------------------------------------------------------------
Parameters  : value       lower 90%   higher 90%
Photon index: 2.03718     ( -0.221124   0.237655 )
Norm@50keV  : 6.19134E-03    ( -0.00100561   0.000980248 )
------------------------------------------------------------
#Fit statistic : Chi-Squared =          50.36 using 59 PHA bins.
# Reduced chi-squared =         0.8835 for     57 degrees of freedom
# Null hypothesis probability =   7.206078e-01

Photon flux (15-150 keV)    in 4 sec: 0.944939 ( -0.117073  0.117085 ) ph/cm2/s
Energy fluence (15-150 keV)             : 2.28904e-07 ( -3.40528e-08  3.48968e-08 ) ergs/cm2
Cutoff power-law model
Time interval is from   -0.288 sec. to    3.712 sec.
Spectral model in the cutoff power-law:
------------------------------------------------------------
Parameters  : value       lower 90%   higher 90%
Photon index: 0.963811     ( -1.27918   1.00968 )
Epeak [keV] : 39.5551      (   )
Norm@50keV  : 2.62392E-02    (     )
------------------------------------------------------------
#Fit statistic : Chi-Squared =          47.04 using 59 PHA bins.
# Reduced chi-squared =         0.8401 for     56 degrees of freedom
# Null hypothesis probability =   7.973538e-01

Photon flux (15-150 keV)    in 4 sec: 0.915105 ( -0.119791  0.120125 ) ph/cm2/s
Energy fluence (15-150 keV)             : 2.09014e-07 ( -3.49048e-08  3.84756e-08 ) ergs/cm2
Band function

Time interval is from   -0.288 sec. to    3.712 sec.

Spectral model in the Band function:
------------------------------------------------------------
Parameters  : value       lower 90%   higher 90%
alpha       : -0.847539   ( -1.09015   0.859583 )
beta        : -3.60653    ( 3.18596   11.3956 )
Epeak [keV] : 41.0600      ( -16.9077 20.2736 )
Norm@50keV   : 2.94764E-02    ( -0.0172138   0.566089 )
------------------------------------------------------------
#Fit statistic : Chi-Squared =          47.09 using 59 PHA bins.
# Reduced chi-squared =         0.8562 for     55 degrees of freedom
# Null hypothesis probability =   7.670975e-01

Photon flux (15-150 keV)    in 4 sec:  (    ) ph/cm2/s
Energy fluence (15-150 keV)             : 2.10438e-07 ( 0  0 ) ergs/cm2
Single BB
Spectral model blackbody:
------------------------------------------------------------
Parameters  : value    Lower 90%  Upper 90%
kT [keV]    : 10.0038  (-1.34156  1.51857)
R^2/D10^2   : 0.448578  (-0.187776   0.32979)
(R is the radius in km and D10 is the distance to the source in units of 10 kpc)
------------------------------------------------------------
#Fit statistic : Chi-Squared =          55.52 using 59 PHA bins.
# Reduced chi-squared =         0.9741 for     57 degrees of freedom
# Null hypothesis probability =   5.306830e-01

Energy  Fluence     90% Error
[keV]   [erg/cm2]   [erg/cm2]
15- 25  3.658e-08   8.390e-09
25- 50  9.099e-08   1.466e-08
50-150  4.754e-08   1.473e-08
15-150  1.751e-07   2.908e-08
Thermal bremsstrahlung (OTTB)
Spectral model: thermal bremsstrahlung
------------------------------------------------------------
Parameters  : value         Lower 90%    Upper 90%
kT [keV]    : 60.6981       (-18.0092      30.5526)
Norm        : 4.97035       (-0.927684     1.12714)
------------------------------------------------------------
#Fit statistic : Chi-Squared =          47.34 using 59 PHA bins.
# Reduced chi-squared =         0.8306 for     57 degrees of freedom
# Null hypothesis probability =   8.153905e-01

Energy  Fluence     90% Error
[keV]   [erg/cm2]   [erg/cm2]
15- 25  5.006e-08   8.240e-09
25- 50  7.646e-08   1.120e-08
50-150  8.784e-08   3.368e-08
15-150  2.144e-07   3.470e-08
Double BB
Spectral model: bbodyrad<1> + bbodyrad<2>
------------------------------------------------------------
Parameters  : value         Lower 90%    Upper 90%
kT1 [keV]   : 4.32095        (-2.16115      1.51679)
R1^2/D10^2  : 5.99914        (-4.98992      216.47)
kT2 [keV]   : 13.4424        (-2.91924      7.09096)
R2^2/D10^2  : 0.116239    (-0.100556   0.133317)
------------------------------------------------------------
#Fit statistic : Chi-Squared =          46.63 using 59 PHA bins.
# Reduced chi-squared =         0.8479 for     55 degrees of freedom
# Null hypothesis probability =   7.816586e-01

Energy  Fluence     90% Error
[keV]   [erg/cm2]   [erg/cm2]
15- 25  4.914e-08   2.624e-08
25- 50  7.754e-08   4.028e-08
50-150  7.423e-08   4.476e-08
15-150  2.009e-07   1.027e-07
Peak spectrum fit
Power-law model

Time interval is from   -0.288 sec. to    0.712 sec.

Spectral model in power-law:
------------------------------------------------------------
Parameters  : value       lower 90%   higher 90%
Photon index: 1.65760     ( -0.27066   0.28488 )
Norm@50keV  : 1.12700E-02    ( -0.00202067   0.00197989 )
------------------------------------------------------------
#Fit statistic : Chi-Squared =          76.71 using 59 PHA bins.
# Reduced chi-squared =          1.346 for     57 degrees of freedom
# Null hypothesis probability =   4.194527e-02

Photon flux (15-150 keV)    in 1 sec: 1.47529 ( -0.243119  0.243303 ) ph/cm2/s
Energy fluence (15-150 keV)             : 1.04738e-07 ( -1.96128e-08  1.99268e-08 ) ergs/cm2
Cutoff power-law model
Time interval is from   -0.288 sec. to    0.712 sec.
Spectral model in the cutoff power-law:
------------------------------------------------------------
Parameters  : value       lower 90%   higher 90%
Photon index: 0.621732     ( -1.8554   1.2166 )
Epeak [keV] : 64.2870      ( -14.6998 -64.2788 )
Norm@50keV  : 3.90582E-02    ( -0.039091   0.28642 )
------------------------------------------------------------
#Fit statistic : Chi-Squared =          74.97 using 59 PHA bins.
# Reduced chi-squared =          1.339 for     56 degrees of freedom
# Null hypothesis probability =   4.607907e-02

Photon flux (15-150 keV)    in 1 sec: 1.42661 ( -0.25766  0.25334 ) ph/cm2/s
Energy fluence (15-150 keV)             : 9.85911e-08 ( -2.03064e-08  2.14299e-08 ) ergs/cm2
Band function

Time interval is from   -0.288 sec. to    0.712 sec.

Spectral model in the Band function:
------------------------------------------------------------
Parameters  : value       lower 90%   higher 90%
alpha       : -0.755033   ( 0.75479   2.20366 )
beta        : -2.51489    ( 2.47768   3.08106 )
Epeak [keV] : 65.9141      ( -65.7562 434.608 )
Norm@50keV   : 3.34741E-02    ( -0.0394148   1.63392e+06 )
------------------------------------------------------------
#Fit statistic : Chi-Squared =          74.90 using 59 PHA bins.
# Reduced chi-squared =          1.362 for     55 degrees of freedom
# Null hypothesis probability =   3.840507e-02

Photon flux (15-150 keV)    in 1 sec:  (    ) ph/cm2/s
Energy fluence (15-150 keV)             : 9.91798e-08 ( 0  0 ) ergs/cm2
Single BB
Spectral model blackbody:
------------------------------------------------------------
Parameters  : value    Lower 90%  Upper 90%
kT [keV]    : 13.9405  (-2.12681  2.53027)
R^2/D10^2   : 0.223513  (-0.102243   0.180999)
(R is the radius in km and D10 is the distance to the source in units of 10 kpc)
------------------------------------------------------------
#Fit statistic : Chi-Squared =          77.97 using 59 PHA bins.
# Reduced chi-squared =          1.368 for     57 degrees of freedom
# Null hypothesis probability =   3.395781e-02

Energy  Fluence     90% Error
[keV]   [erg/cm2]   [erg/cm2]
15- 25  9.179e-09   2.721e-09
25- 50  3.400e-08   8.455e-09
50-150  4.340e-08   1.627e-08
15-150  8.658e-08   1.938e-08
Thermal bremsstrahlung (OTTB)

Spectral model: thermal bremsstrahlung
------------------------------------------------------------
Parameters  : value         Lower 90%    Upper 90%
kT [keV]    : 149.105       (-71.505      -146.407)
Norm        : 6.10798       (-1.07533     1.44935)
------------------------------------------------------------
#Fit statistic : Chi-Squared =          75.63 using 59 PHA bins.
# Reduced chi-squared =          1.327 for     57 degrees of freedom
# Null hypothesis probability =   4.991289e-02

Energy  Fluence     90% Error
[keV]   [erg/cm2]   [erg/cm2]
15- 25  1.570e-08   8.890e-09
25- 50  2.907e-08   1.595e-08
50-150  5.723e-08   3.434e-08
15-150  1.020e-07   5.770e-08
Double BB

Spectral model: bbodyrad<1> + bbodyrad<2>
------------------------------------------------------------
Parameters  : value         Lower 90%    Upper 90%
kT1 [keV]   : 2.77181        (-2.06339      2.14189)
R1^2/D10^2  : 74.1679        (-68.9555      1.57849e+08)
kT2 [keV]   : 15.6694        (-2.67574      3.66415)
R2^2/D10^2  : 0.135842    (-0.0748035   0.131337)
------------------------------------------------------------
#Fit statistic : Chi-Squared =          71.12 using 59 PHA bins.
# Reduced chi-squared =          1.293 for     55 degrees of freedom
# Null hypothesis probability =   7.070752e-02

Energy  Fluence     90% Error
[keV]   [erg/cm2]   [erg/cm2]
15- 25  1.527e-08   7.097e-09
25- 50  2.954e-08   1.162e-08
50-150  4.873e-08   2.162e-08
15-150  9.353e-08   3.626e-08
Pre-slew spectrum (Pre-slew PHA with pre-slew DRM)
Power-law model

Spectral model in power-law:
------------------------------------------------------------
Parameters  : value       lower 90%   higher 90%
Photon index: 2.03718     ( -0.221124   0.237655 )
Norm@50keV  : 6.19134E-03    ( -0.00100561   0.000980248 )
------------------------------------------------------------
#Fit statistic : Chi-Squared =          50.36 using 59 PHA bins.
# Reduced chi-squared =         0.8835 for     57 degrees of freedom
# Null hypothesis probability =   7.206078e-01

Photon flux (15-150 keV)    in 4 sec: 0.944939 ( -0.117073  0.117085 ) ph/cm2/s
Energy fluence (15-150 keV)             : 2.28904e-07 ( -3.40528e-08  3.48968e-08 ) ergs/cm2
Cutoff power-law model

Spectral model in the cutoff power-law:
------------------------------------------------------------
Parameters  : value       lower 90%   higher 90%
Photon index: 0.963811     ( -1.27918   1.00968 )
Epeak [keV] : 39.5551      (   )
Norm@50keV  : 2.62392E-02    (     )
------------------------------------------------------------
#Fit statistic : Chi-Squared =          47.04 using 59 PHA bins.
# Reduced chi-squared =         0.8401 for     56 degrees of freedom
# Null hypothesis probability =   7.973538e-01

Photon flux (15-150 keV)    in 4 sec: 0.915105 ( -0.119791  0.120125 ) ph/cm2/s
Energy fluence (15-150 keV)             : 2.09014e-07 ( -3.49048e-08  3.84756e-08 ) ergs/cm2
Band function
Spectral model in the Band function:
------------------------------------------------------------
Parameters  : value       lower 90%   higher 90%
alpha       : -0.847539   ( -1.09015   0.859583 )
beta        : -3.60653    ( 3.18596   11.3956 )
Epeak [keV] : 41.0600      ( -16.9077 20.2736 )
Norm@50keV   : 2.94764E-02    ( -0.0172138   337.824 )
------------------------------------------------------------
#Fit statistic : Chi-Squared =          47.09 using 59 PHA bins.
# Reduced chi-squared =         0.8562 for     55 degrees of freedom
# Null hypothesis probability =   7.670975e-01

Photon flux (15-150 keV)    in 4 sec:  (    ) ph/cm2/s
Energy fluence (15-150 keV)             : 2.10438e-07 ( 0  0 ) ergs/cm2
S(25-50 keV) vs. S(50-100 keV) plot

S(25-50 keV)  = 6.96e-08
S(50-100 keV) = 6.79e-08
T90 vs. Hardness ratio plot
T90                                   = 3 sec.
Hardness ratio (energy fluence ratio) = 0.975575
Color vs. Color plot

Count Ratio  (25-50 keV) / (15-25 keV) = 0.991344
Count Ratio (50-100 keV) / (15-25 keV) = 0.467555
Mask shadow pattern

IMX = -6.595959057654972E-01, IMY = 3.465701845356184E-01
TIME vs. PHA plot around the trigger time
Blue+Cyan dotted lines: Time interval of the scaled map
From 0.000000 to 1.024000
TIME vs. DetID plot around the trigger time
Blue+Cyan dotted lines: Time interval of the scaled map
From 0.000000 to 1.024000
100 us light curve (15-350 keV)
Blue+Cyan dotted lines: Time interval of the scaled map
From 0.000000 to 1.024000
Spacecraft aspect plot

Bright source in the pre-burst/pre-slew/post-slew images
Pre-burst image of 15-350 keV band
Time interval of the image:
-617.787410 -528.074300
-239.288000 -0.288000

# RAcent  DECcent POSerr Theta    Phi  PeakCts   SNR AngSep     Name
#  [deg]    [deg]    ['] [deg]  [deg]                   [']
 34.9368 -36.5817    3.5  37.4   51.1   1.8086   3.3 ------	UNKNOWN
 12.1687  12.9981    2.4  37.0  148.6   2.1714   4.7 ------	UNKNOWN
 70.4000 -34.1562    2.5  40.0    4.4   1.6834   4.5 ------	UNKNOWN
Pre-slew background subtracted image of 15-350 keV band
Time interval of the image:
-0.288000 3.712000

# RAcent  DECcent POSerr Theta    Phi  PeakCts   SNR AngSep     Name
#  [deg]    [deg]    ['] [deg]  [deg]                   [']
 20.4456  40.6399    2.7  47.9 -171.5   0.2094   4.3 ------	UNKNOWN
 85.5386 -26.3960    2.2  45.2  -16.8   0.2222   5.2 ------	UNKNOWN
 41.0866  35.4987    0.9  36.7 -152.3   0.4147  12.8 ------	UNKNOWN
 15.0094  51.7186    2.7  59.0 -166.9   0.6259   4.2 ------	UNKNOWN
 88.5484   0.9607    1.9  41.8  -56.9   0.4047   6.1 ------	UNKNOWN
Post-slew image of 15-350 keV band
Time interval of the image:
82.012590 653.112600

# RAcent  DECcent POSerr Theta    Phi  PeakCts   SNR AngSep     Name
#  [deg]    [deg]    ['] [deg]  [deg]                   [']
 83.6306  22.0131    0.6  39.3  -74.2  23.2987  19.4    0.2	Crab
338.9420  52.4758    2.6  46.2  139.3   7.4422   4.4 ------	UNKNOWN
 20.6628  10.3706    2.7  31.2   49.0   2.4809   4.3 ------	UNKNOWN
339.5967  62.9115    2.9  46.1  153.8   3.9823   3.9 ------	UNKNOWN
 28.9823  62.0574    2.5  27.6  175.4   1.8919   4.5 ------	UNKNOWN
 48.0960   1.0510    3.7  35.0   -4.8   1.5152   3.1 ------	UNKNOWN
169.7148  83.0760    3.3  59.0 -166.1   9.0209   3.5 ------	UNKNOWN
Plot creation:
Sat May 30 12:57:50 EDT 2015