Click here for the BAT GCN circular template
Image
Pre-slew 15.0-350.0 keV image (Event data)

#   RAcent    DECcent   POSerr    Theta     Phi              Peak Cts       SNR   Name
  281.1414    59.6227   0.0080    19.2825    -6.4141         0.7235869     24.019 TRIG_00604232

Foreground time interval of the image:
 -0.108   6.676 (delta_t =   6.784 [sec])
Background time interval of the image:
-232.475  -0.108 (delta_t = 232.367 [sec])
Lightcurves
Notes:
- 1) The mask-weighted light curves are using the flight position.
- 2) Multiple plots of different time binning/intervals are shown to cover all scenarios of short/long GRBs, rate/image triggers, and real/false positives.
- 3) For all the mask-weighted lightcurves, the y-axis units are counts/sec/det where a det is 0.4 x 0.4 = 0.16 sq cm.
- 4) The verticle lines correspond to following: green dotted lines are T50 interval, black dotted lines are T90 interval, blue solid line(s) is a spacecraft slew start time, and orange solid line(s) is a spacecraft slew end time.
- 5) Time of each bin is in the middle of the bin.
1 s binning
From T0-310 s to T0+310 s
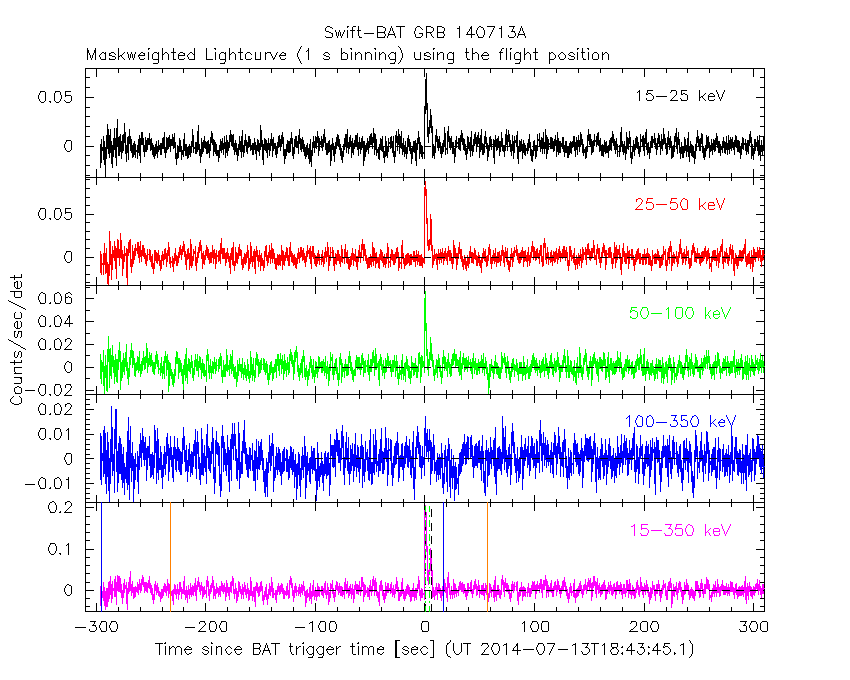
From T100_start - 20 s to T100_end + 30 s

Full time interval

64 ms binning
Full time interval

From T100_start to T100_end
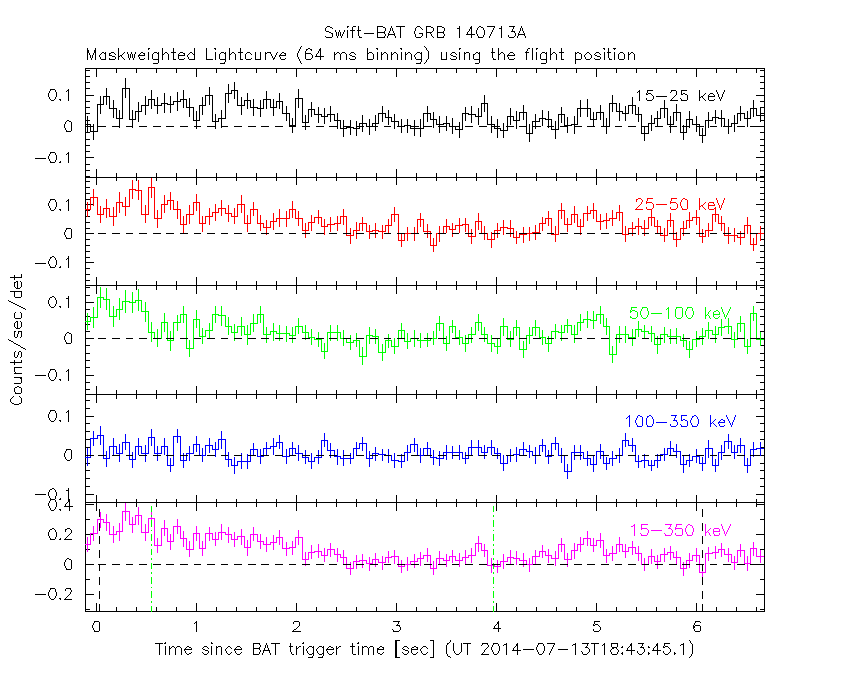
From T0-5 sec to T0+5 sec

16 ms binning
From T100_start-5 s to T100_start+5 s

Blue+Cyan dotted lines: Time interval of the scaled map
From 0.000000 to 0.512000
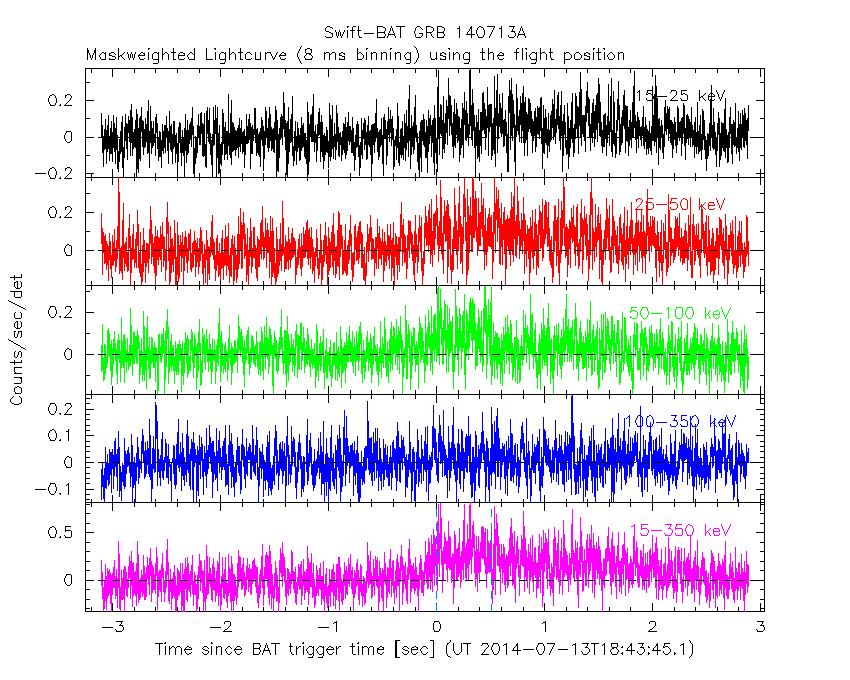
8 ms binning
From T100_start-3 s to T100_start+3 s
Blue+Cyan dotted lines: Time interval of the scaled map
From 0.000000 to 0.512000
2 ms binning
From T100_start-1 s to T100_start+1 s

Blue+Cyan dotted lines: Time interval of the scaled map
From 0.000000 to 0.512000
SN=5 or 10 sec. binning (whichever binning is satisfied first)
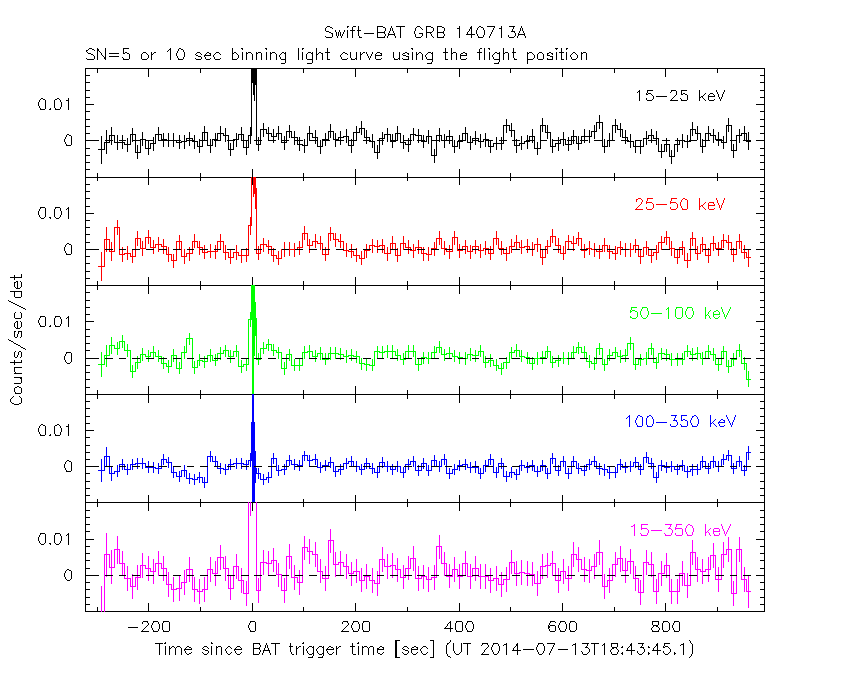
SN=5 or 10 sec. binning (T < 200 sec)

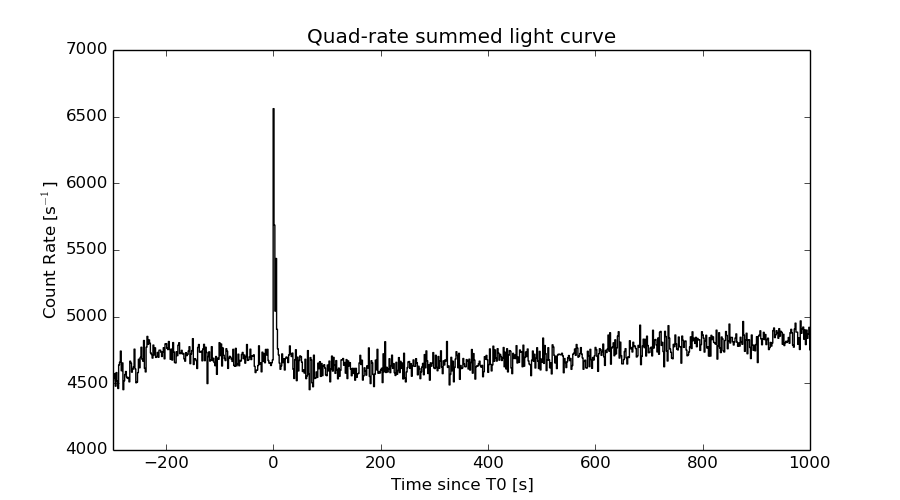
Quad-rate summed light curves (from T0-300s to T0+1000s)
Spectral Evolution

Spectra
Notes:
- 1) The fitting includes the systematic errors.
- 2) When the burst includes telescope slew time periods, the fitting uses an average response file made from multiple 5-s response files through out the slew time plus single time preiod for the non-slew times, and weighted by the total counts in the corresponding time period using addrmf. An average response file is needed becuase a spectral fit using the pre-slew DRM will introduce some errors in both a spectral shape and a normalization if the PHA file contains a lot of the slew/post-slew time interval.
- 3) For fits to more complicated models (e.g. a power-law over a cutoff power-law), the BAT team has decided to require a chi-square improvement of more than 6 for each extra dof.
Time averaged spectrum fit using the average DRM
Power-law model

Time interval is from   -0.108 sec. to    6.676 sec.

Spectral model in power-law:
------------------------------------------------------------
Parameters  : value       lower 90%   higher 90%
Photon index: 1.84272     ( -0.137866   0.141285 )
Norm@50keV  : 5.86057E-03    ( -0.000518551   0.000510705 )
------------------------------------------------------------
#Fit statistic : Chi-Squared =          79.23 using 59 PHA bins.
# Reduced chi-squared =          1.390 for     57 degrees of freedom
# Null hypothesis probability =   2.737405e-02

Photon flux (15-150 keV)    in 6.784 sec: 0.821338 ( -0.0617688  0.0617931 ) ph/cm2/s
Energy fluence (15-150 keV)             : 3.65609e-07 ( -3.23219e-08  3.27411e-08 ) ergs/cm2
Cutoff power-law model

Time interval is from   -0.108 sec. to    6.676 sec.
Spectral model in the cutoff power-law:
------------------------------------------------------------
Parameters  : value       lower 90%   higher 90%
Photon index: 1.81477     ( -0.52669   0.460764 )
Epeak [keV] : 278.986      (   )
Norm@50keV  : 6.08107E-03    (     )
------------------------------------------------------------
#Fit statistic : Chi-Squared =          79.22 using 59 PHA bins.
# Reduced chi-squared =          1.415 for     56 degrees of freedom
# Null hypothesis probability =   2.224392e-02

Photon flux (15-150 keV)    in 6.784 sec: 0.820254 ( -0.063868  0.062656 ) ph/cm2/s
Energy fluence (15-150 keV)             : 3.63576e-07 ( -3.7719e-08  3.4462e-08 ) ergs/cm2
Band function

Time interval is from   -0.108 sec. to    6.676 sec.

Spectral model in the Band function:
------------------------------------------------------------
Parameters  : value       lower 90%   higher 90%
alpha       : 4.59185   ( -5.10033   -4.59185 )
beta        : -2.04993    ( -0.202596   0.183282 )
Epeak [keV] : 25.0385      ( -3.06435 2.82877 )
Norm@50keV   : 424.903    ( -31.4647   2167.87 )
------------------------------------------------------------
#Fit statistic : Chi-Squared =          72.42 using 59 PHA bins.
# Reduced chi-squared =          1.317 for     55 degrees of freedom
# Null hypothesis probability =   5.774235e-02

Photon flux (15-150 keV)    in 6.784 sec:  (    ) ph/cm2/s
Energy fluence (15-150 keV)             : 0 ( 0  0 ) ergs/cm2
Single BB

Spectral model blackbody:
------------------------------------------------------------
Parameters  : value    Lower 90%  Upper 90%
kT [keV]    : 9.54707  (  )
R^2/D10^2   : 0.450289  (   )
(R is the radius in km and D10 is the distance to the source in units of 10 kpc)
------------------------------------------------------------
#Fit statistic : Chi-Squared =         124.02 using 59 PHA bins.
# Reduced chi-squared =         2.1758 for     57 degrees of freedom
# Null hypothesis probability =   7.056317e-07

Energy  Fluence     90% Error
[keV]   [erg/cm2]   [erg/cm2]
15- 25  5.572e-08   7.110e-09
25- 50  1.296e-07   1.140e-08
50-150  5.903e-08   1.379e-08
15-150  2.443e-07   2.283e-08
Thermal bremsstrahlung (OTTB)

Spectral model: thermal bremsstrahlung
------------------------------------------------------------
Parameters  : value         Lower 90%    Upper 90%
kT [keV]    : 89.5210       (-22.3804      36.4834)
Norm        : 3.71277       (-0.410817     0.488296)
------------------------------------------------------------
#Fit statistic : Chi-Squared =          81.66 using 59 PHA bins.
# Reduced chi-squared =          1.433 for     57 degrees of freedom
# Null hypothesis probability =   1.776922e-02

Energy  Fluence     90% Error
[keV]   [erg/cm2]   [erg/cm2]
15- 25  6.571e-08   7.625e-09
25- 50  1.110e-07   9.091e-09
50-150  1.685e-07   6.092e-08
15-150  3.452e-07   6.055e-08
Double BB

Spectral model: bbodyrad<1> + bbodyrad<2>
------------------------------------------------------------
Parameters  : value         Lower 90%    Upper 90%
kT1 [keV]   : 6.95349        (-0.815772      0.876564)
R1^2/D10^2  : 1.25793        (-0.44589      0.735657)
kT2 [keV]   : 35.4861        (-9.66801      21.5972)
R2^2/D10^2  : 2.88452E-03    (-0.00207714   0.00508901)
------------------------------------------------------------
#Fit statistic : Chi-Squared =          65.82 using 59 PHA bins.
# Reduced chi-squared =          1.197 for     55 degrees of freedom
# Null hypothesis probability =   1.505956e-01

Energy  Fluence     90% Error
[keV]   [erg/cm2]   [erg/cm2]
15- 25  6.928e-08   1.162e-08
25- 50  1.117e-07   2.151e-08
50-150  2.000e-07   9.800e-08
15-150  3.810e-07   1.163e-07
Peak spectrum fit
Power-law model

Time interval is from   -0.108 sec. to    0.892 sec.

Spectral model in power-law:
------------------------------------------------------------
Parameters  : value       lower 90%   higher 90%
Photon index: 1.45831     ( -0.153052   0.154072 )
Norm@50keV  : 1.56299E-02    ( -0.00145405   0.00144564 )
------------------------------------------------------------
#Fit statistic : Chi-Squared =          60.40 using 59 PHA bins.
# Reduced chi-squared =          1.060 for     57 degrees of freedom
# Null hypothesis probability =   3.538872e-01

Photon flux (15-150 keV)    in 1 sec: 1.93018 ( -0.174696  0.174793 ) ph/cm2/s
Energy fluence (15-150 keV)             : 1.49341e-07 ( -1.53756e-08  1.55249e-08 ) ergs/cm2
Cutoff power-law model

Time interval is from   -0.108 sec. to    0.892 sec.
Spectral model in the cutoff power-law:
------------------------------------------------------------
Parameters  : value       lower 90%   higher 90%
Photon index: 1.23268     ( -0.608103   0.315473 )
Epeak [keV] : 164.058      ( -164.065 -164.065 )
Norm@50keV  : 2.05551E-02    ( -0.00698221   0.0218212 )
------------------------------------------------------------
#Fit statistic : Chi-Squared =          59.91 using 59 PHA bins.
# Reduced chi-squared =          1.070 for     56 degrees of freedom
# Null hypothesis probability =   3.359586e-01

Photon flux (15-150 keV)    in 1 sec: 1.91508 ( -0.1784  0.17828 ) ph/cm2/s
Energy fluence (15-150 keV)             : 1.46525e-07 ( -1.7153e-08  1.6784e-08 ) ergs/cm2
Band function

Time interval is from   -0.108 sec. to    0.892 sec.

Spectral model in the Band function:
------------------------------------------------------------
Parameters  : value       lower 90%   higher 90%
alpha       : 3.80748   ( -12.1345   -4.36687 )
beta        : -1.63439    ( -0.254393   0.195193 )
Epeak [keV] : 28.9391      ( -9.47454 5.06091 )
Norm@50keV   : 104.520    ( -104.533   228.841 )
------------------------------------------------------------
#Fit statistic : Chi-Squared =          56.32 using 59 PHA bins.
# Reduced chi-squared =          1.024 for     55 degrees of freedom
# Null hypothesis probability =   4.254059e-01

Photon flux (15-150 keV)    in 1 sec: 1.90147 ( 5.09853  -0.17791 ) ph/cm2/s
Energy fluence (15-150 keV)             : 0 ( 0  0 ) ergs/cm2
Single BB

Spectral model blackbody:
------------------------------------------------------------
Parameters  : value    Lower 90%  Upper 90%
kT [keV]    : 13.6281  (-1.66663  2.02788)
R^2/D10^2   : 0.305665  (-0.117419   0.179403)
(R is the radius in km and D10 is the distance to the source in units of 10 kpc)
------------------------------------------------------------
#Fit statistic : Chi-Squared =          91.78 using 59 PHA bins.
# Reduced chi-squared =          1.610 for     57 degrees of freedom
# Null hypothesis probability =   2.387899e-03

Energy  Fluence     90% Error
[keV]   [erg/cm2]   [erg/cm2]
15- 25  1.202e-08   1.994e-09
25- 50  4.350e-08   5.010e-09
50-150  5.245e-08   1.121e-08
15-150  1.080e-07   1.200e-08
Thermal bremsstrahlung (OTTB)

Spectral model: thermal bremsstrahlung
------------------------------------------------------------
Parameters  : value         Lower 90%    Upper 90%
kT [keV]    : 200.000       (      )
Norm        : 7.90160       (-0.709564     0.709564)
------------------------------------------------------------
#Fit statistic : Chi-Squared =          60.67 using 59 PHA bins.
# Reduced chi-squared =          1.064 for     57 degrees of freedom
# Null hypothesis probability =   3.449681e-01

Energy  Fluence     90% Error
[keV]   [erg/cm2]   [erg/cm2]
15- 25  1.974e-08   2.355e-09
25- 50  3.796e-08   9.070e-09
50-150  8.326e-08   3.979e-08
15-150  1.410e-07   4.385e-08
Double BB

Spectral model: bbodyrad<1> + bbodyrad<2>
------------------------------------------------------------
Parameters  : value         Lower 90%    Upper 90%
kT1 [keV]   : 8.12129        (-1.47818      1.65802)
R1^2/D10^2  : 1.38342        (-0.622688      1.274)
kT2 [keV]   : 36.0497        (-10.5062      30.282)
R2^2/D10^2  : 8.48760E-03    (-0.00681857   0.0180124)
------------------------------------------------------------
#Fit statistic : Chi-Squared =          54.15 using 59 PHA bins.
# Reduced chi-squared =         0.9845 for     55 degrees of freedom
# Null hypothesis probability =   5.072273e-01

Energy  Fluence     90% Error
[keV]   [erg/cm2]   [erg/cm2]
15- 25  1.821e-08   5.959e-09
25- 50  4.007e-08   1.157e-08
50-150  9.270e-08   4.605e-08
15-150  1.510e-07   5.887e-08
Pre-slew spectrum (Pre-slew PHA with pre-slew DRM)
Power-law model

Spectral model in power-law:
------------------------------------------------------------
Parameters  : value       lower 90%   higher 90%
Photon index: 1.84272     ( -0.137866   0.141285 )
Norm@50keV  : 5.86057E-03    ( -0.000518551   0.000510705 )
------------------------------------------------------------
#Fit statistic : Chi-Squared =          79.23 using 59 PHA bins.
# Reduced chi-squared =          1.390 for     57 degrees of freedom
# Null hypothesis probability =   2.737405e-02

Photon flux (15-150 keV)    in 6.784 sec: 0.821338 ( -0.0617688  0.0617931 ) ph/cm2/s
Energy fluence (15-150 keV)             : 3.65609e-07 ( -3.23219e-08  3.27411e-08 ) ergs/cm2
Cutoff power-law model

Spectral model in the cutoff power-law:
------------------------------------------------------------
Parameters  : value       lower 90%   higher 90%
Photon index: 1.81477     ( -0.52669   0.460764 )
Epeak [keV] : 278.986      (   )
Norm@50keV  : 6.08107E-03    (     )
------------------------------------------------------------
#Fit statistic : Chi-Squared =          79.22 using 59 PHA bins.
# Reduced chi-squared =          1.415 for     56 degrees of freedom
# Null hypothesis probability =   2.224392e-02

Photon flux (15-150 keV)    in 6.784 sec: 0.820254 ( -0.063868  0.062656 ) ph/cm2/s
Energy fluence (15-150 keV)             : 3.63576e-07 ( -3.7719e-08  3.4462e-08 ) ergs/cm2
Band function

Spectral model in the Band function:
------------------------------------------------------------
Parameters  : value       lower 90%   higher 90%
alpha       : 4.59185   ( -5.10033   -4.59185 )
beta        : -2.04993    ( -0.202596   0.183282 )
Epeak [keV] : 25.0385      ( -3.06435 2.82877 )
Norm@50keV   : 424.903    ( -31.4647   2167.87 )
------------------------------------------------------------
#Fit statistic : Chi-Squared =          72.42 using 59 PHA bins.
# Reduced chi-squared =          1.317 for     55 degrees of freedom
# Null hypothesis probability =   5.774235e-02

Photon flux (15-150 keV)    in 6.784 sec:  (    ) ph/cm2/s
Energy fluence (15-150 keV)             : 0 ( 0  0 ) ergs/cm2
S(25-50 keV) vs. S(50-100 keV) plot

S(25-50 keV)  = 1.05e-07
S(50-100 keV) = 1.17e-07
T90 vs. Hardness ratio plot
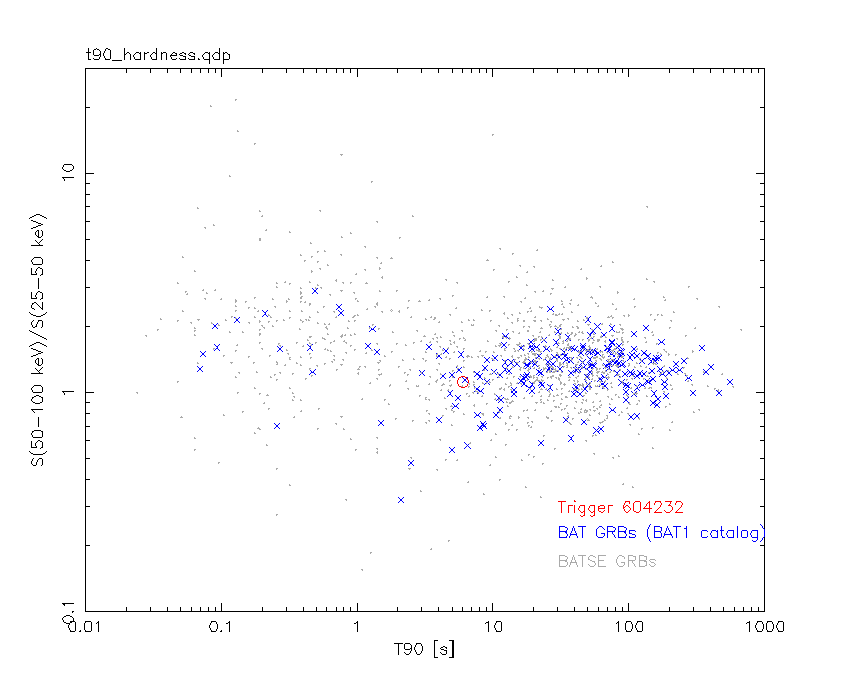
T90                                   = 6.01599997282028 sec.
Hardness ratio (energy fluence ratio) = 1.11429
Color vs. Color plot

Count Ratio  (25-50 keV) / (15-25 keV) = 1.18994
Count Ratio (50-100 keV) / (15-25 keV) = 0.591482
Mask shadow pattern

IMX = 3.476618081882924E-01, IMY = 3.908299903426914E-02
TIME vs. PHA plot around the trigger time

Blue+Cyan dotted lines: Time interval of the scaled map
From 0.000000 to 0.512000
TIME vs. DetID plot around the trigger time

Blue+Cyan dotted lines: Time interval of the scaled map
From 0.000000 to 0.512000
100 us light curve (15-350 keV)

Blue+Cyan dotted lines: Time interval of the scaled map
From 0.000000 to 0.512000
Spacecraft aspect plot

Bright source in the pre-burst/pre-slew/post-slew images
Pre-burst image of 15-350 keV band
Time interval of the image:
-232.475400 -0.108000

# RAcent  DECcent POSerr Theta    Phi  PeakCts   SNR AngSep     Name
#  [deg]    [deg]    ['] [deg]  [deg]                   [']
254.5010  35.3674   99.0  14.6  116.7  -0.0250  -0.1    2.6	Her X-1
299.5915  35.2156    1.2  37.3   39.7   3.8961   9.7    0.8	Cyg X-1
308.0847  40.9501    2.3  39.5   26.0   1.8611   4.9    1.2	Cyg X-3
326.0415  38.4416    0.0  52.2   17.7  -2.0285  -2.6    9.4	Cyg X-2
251.7967  52.8548    3.1   3.0  -56.0   0.7028   3.7 ------	UNKNOWN
288.1304  60.7790    2.5  22.9   -7.1   0.9622   4.6 ------	UNKNOWN
211.4953  23.4468    2.6  41.0 -169.9   1.4195   4.4 ------	UNKNOWN
342.2398  67.8101    2.9  45.1  -22.6   1.4403   4.0 ------	UNKNOWN
Pre-slew background subtracted image of 15-350 keV band
Time interval of the image:
-0.108000 6.676000

# RAcent  DECcent POSerr Theta    Phi  PeakCts   SNR AngSep     Name
#  [deg]    [deg]    ['] [deg]  [deg]                   [']
254.2039  35.3866    0.0  14.6  117.7   0.0571   1.7   12.7	Her X-1
299.4219  35.2151    3.5  37.2   39.9   0.2059   3.3    8.3	Cyg X-1
308.3002  40.9345    7.5  39.6   25.9  -0.0925  -1.5    8.7	Cyg X-3
326.2380  38.2814    8.8  52.4   17.7  -0.1973  -1.3    3.9	Cyg X-2
244.4540   3.1140    2.2  47.2  135.3   0.7754   5.2 ------	UNKNOWN
234.3331   6.3573    2.4  45.9  149.8   0.4271   4.8 ------	UNKNOWN
328.1057  40.4909    2.3  52.2   14.4   0.6045   5.0 ------	UNKNOWN
328.8664  40.9995    1.8  52.3   13.4   0.7643   6.5 ------	UNKNOWN
281.1414  59.6227    0.5  19.3   -6.4   0.7236  24.0 ------	UNKNOWN
198.1105  15.3003    2.5  55.3 -163.7   0.4485   4.7 ------	UNKNOWN
189.4874  20.6794    2.2  56.7 -152.0   0.8825   5.3 ------	UNKNOWN
Post-slew image of 15-350 keV band
Time interval of the image:
57.124600 962.645500

# RAcent  DECcent POSerr Theta    Phi  PeakCts   SNR AngSep     Name
#  [deg]    [deg]    ['] [deg]  [deg]                   [']
254.3366  35.4438    6.8  29.8  149.0   1.4877   1.7    8.5	Her X-1
299.6127  35.2094    0.6  27.2   66.8  16.0016  19.4    1.2	Cyg X-1
308.0687  40.9946    1.7  25.0   47.4   5.1274   6.9    3.1	Cyg X-3
326.0561  38.4576    6.4  35.2   27.8   1.6134   1.8    9.8	Cyg X-2
246.4775  36.4639    2.4  32.1  160.7   4.1978   4.7 ------	UNKNOWN
354.3413  37.9714    2.7  49.8    2.7   6.0248   4.3 ------	UNKNOWN
  2.1146  34.1192    2.8  56.7   -0.5  11.2084   4.2 ------	UNKNOWN
353.1772  48.8426    3.0  41.2   -6.9   3.4563   3.8 ------	UNKNOWN
 18.3603  40.2213    3.9  59.4  -17.1  13.6595   3.0 ------	UNKNOWN
200.6303  31.2551    4.7  58.7 -159.2  13.5458   2.5 ------	UNKNOWN
 55.0507  71.6849    3.0  44.9  -60.0  12.0660   3.8 ------	UNKNOWN
Plot creation:
Sat May 30 12:55:59 EDT 2015