Click here for the BAT GCN circular template
Image
Pre-slew 15.0-350.0 keV image (Event data)
#   RAcent    DECcent   POSerr    Theta     Phi              Peak Cts       SNR   Name
   56.3380   -66.5779   0.0176     2.6316   -73.5043         0.7161204     10.934 TRIG_00607742

Foreground time interval of the image:
-14.808  29.736 (delta_t =  44.544 [sec])
Background time interval of the image:
-408.347 -392.077 (delta_t =  16.270 [sec])
-239.648 -14.808 (delta_t = 224.840 [sec])
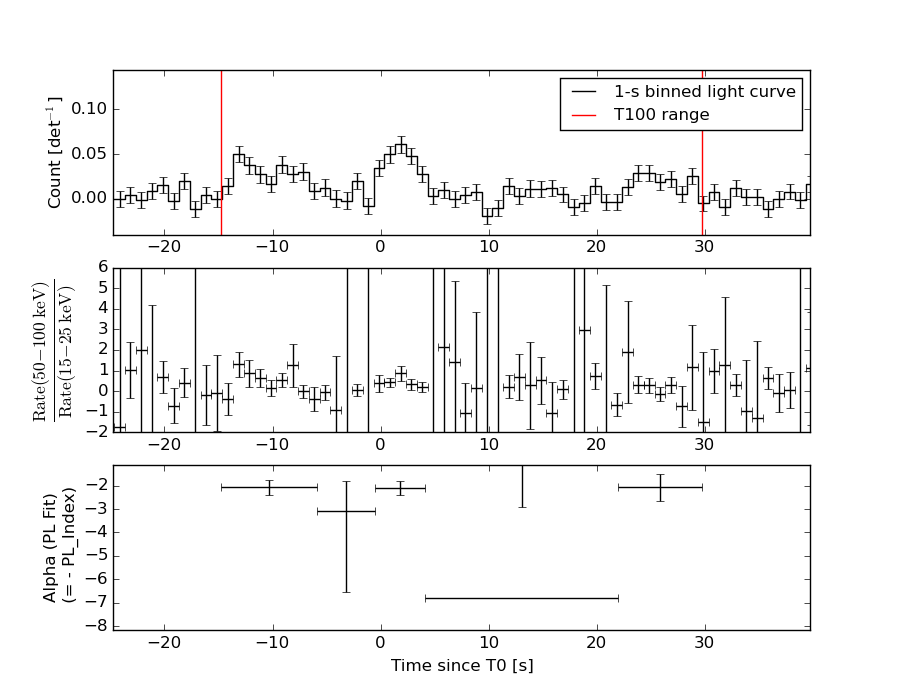
Lightcurves
Notes:
- 1) The mask-weighted light curves are using the flight position.
- 2) Multiple plots of different time binning/intervals are shown to cover all scenarios of short/long GRBs, rate/image triggers, and real/false positives.
- 3) For all the mask-weighted lightcurves, the y-axis units are counts/sec/det where a det is 0.4 x 0.4 = 0.16 sq cm.
- 4) The verticle lines correspond to following: green dotted lines are T50 interval, black dotted lines are T90 interval, blue solid line(s) is a spacecraft slew start time, and orange solid line(s) is a spacecraft slew end time.
- 5) Time of each bin is in the middle of the bin.
1 s binning
From T0-310 s to T0+310 s

From T100_start - 20 s to T100_end + 30 s
Full time interval

64 ms binning
Full time interval

From T100_start to T100_end

From T0-5 sec to T0+5 sec
16 ms binning
From T100_start-5 s to T100_start+5 s
Blue+Cyan dotted lines: Time interval of the scaled map
From 0.000000 to 2.048000
8 ms binning
From T100_start-3 s to T100_start+3 s
Blue+Cyan dotted lines: Time interval of the scaled map
From 0.000000 to 2.048000
2 ms binning
From T100_start-1 s to T100_start+1 s
Blue+Cyan dotted lines: Time interval of the scaled map
From 0.000000 to 2.048000
SN=5 or 10 sec. binning (whichever binning is satisfied first)

SN=5 or 10 sec. binning (T < 200 sec)
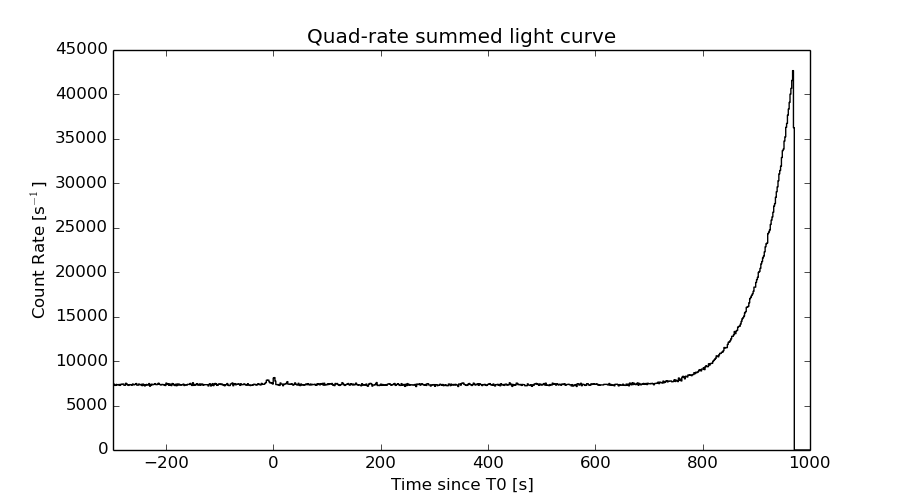
Quad-rate summed light curves (from T0-300s to T0+1000s)
Spectral Evolution
Spectra
Notes:
- 1) The fitting includes the systematic errors.
- 2) When the burst includes telescope slew time periods, the fitting uses an average response file made from multiple 5-s response files through out the slew time plus single time preiod for the non-slew times, and weighted by the total counts in the corresponding time period using addrmf. An average response file is needed becuase a spectral fit using the pre-slew DRM will introduce some errors in both a spectral shape and a normalization if the PHA file contains a lot of the slew/post-slew time interval.
- 3) For fits to more complicated models (e.g. a power-law over a cutoff power-law), the BAT team has decided to require a chi-square improvement of more than 6 for each extra dof.
Time averaged spectrum fit using the average DRM
Power-law model

Time interval is from  -14.808 sec. to   29.736 sec.

Spectral model in power-law:
------------------------------------------------------------
Parameters  : value       lower 90%   higher 90%
Photon index: 2.38503     ( -0.284369   0.320494 )
Norm@50keV  : 6.94875E-04    ( -0.000160536   0.000158827 )
------------------------------------------------------------
#Fit statistic : Chi-Squared =          69.25 using 59 PHA bins.
# Reduced chi-squared =          1.215 for     57 degrees of freedom
# Null hypothesis probability =   1.280882e-01

Photon flux (15-150 keV)    in 44.54 sec: 0.127451 ( -0.0171553  0.0171649 ) ph/cm2/s
Energy fluence (15-150 keV)             : 3.00894e-07 ( -5.28436e-08  5.58042e-08 ) ergs/cm2
Cutoff power-law model

Time interval is from  -14.808 sec. to   29.736 sec.
Spectral model in the cutoff power-law:
------------------------------------------------------------
Parameters  : value       lower 90%   higher 90%
Photon index: 1.67826     ( -1.61568   0.324812 )
Epeak [keV] : 16.2237      (   )
Norm@50keV  : 1.95564E-03    (     )
------------------------------------------------------------
#Fit statistic : Chi-Squared =          68.25 using 59 PHA bins.
# Reduced chi-squared =          1.219 for     56 degrees of freedom
# Null hypothesis probability =   1.262717e-01

Photon flux (15-150 keV)    in 44.54 sec: 0.124724 ( -0.017453  0.017648 ) ph/cm2/s
Energy fluence (15-150 keV)             : 2.78332e-07 ( -5.52768e-08  6.65931e-08 ) ergs/cm2
Band function

Time interval is from  -14.808 sec. to   29.736 sec.

Spectral model in the Band function:
------------------------------------------------------------
Parameters  : value       lower 90%   higher 90%
alpha       : -1.67836   ( -2.57623   0.965565 )
beta        : -10.0000    ( 10   2.13163e-14 )
Epeak [keV] : 16.2207      ( -11.676 17.2696 )
Norm@50keV   : 1.95473E-03    ( -0.00100935   0.0204807 )
------------------------------------------------------------
#Fit statistic : Chi-Squared =          68.25 using 59 PHA bins.
# Reduced chi-squared =          1.241 for     55 degrees of freedom
# Null hypothesis probability =   1.081750e-01

Photon flux (15-150 keV)    in 44.54 sec: 0.125023 ( 6.87498  -0.017661 ) ph/cm2/s
Energy fluence (15-150 keV)             : 2.80255e-07 ( 0  0 ) ergs/cm2
Single BB

Spectral model blackbody:
------------------------------------------------------------
Parameters  : value    Lower 90%  Upper 90%
kT [keV]    : 7.47179  (-1.14829  1.31713)
R^2/D10^2   : 0.182288  (-0.0874848   0.17768)
(R is the radius in km and D10 is the distance to the source in units of 10 kpc)
------------------------------------------------------------
#Fit statistic : Chi-Squared =          76.70 using 59 PHA bins.
# Reduced chi-squared =          1.346 for     57 degrees of freedom
# Null hypothesis probability =   4.200651e-02

Energy  Fluence     90% Error
[keV]   [erg/cm2]   [erg/cm2]
15- 25  7.753e-08   1.900e-08
25- 50  1.201e-07   2.675e-08
50-150  2.506e-08   1.200e-08
15-150  2.227e-07   4.574e-08
Thermal bremsstrahlung (OTTB)
Spectral model: thermal bremsstrahlung
------------------------------------------------------------
Parameters  : value         Lower 90%    Upper 90%
kT [keV]    : 35.5383       (-10.578      17.1577)
Norm        : 0.894462       (-0.219519     0.318208)
------------------------------------------------------------
#Fit statistic : Chi-Squared =          68.42 using 59 PHA bins.
# Reduced chi-squared =          1.200 for     57 degrees of freedom
# Null hypothesis probability =   1.429340e-01

Energy  Fluence     90% Error
[keV]   [erg/cm2]   [erg/cm2]
15- 25  8.758e-08   1.581e-08
25- 50  1.092e-07   2.218e-08
50-150  7.384e-08   3.295e-08
15-150  2.706e-07   5.944e-08
Double BB
Spectral model: bbodyrad<1> + bbodyrad<2>
------------------------------------------------------------
Parameters  : value         Lower 90%    Upper 90%
kT1 [keV]   : 4.02356        (-2.90478      2.17781)
R1^2/D10^2  : 1.52833        (-1.21821      738.767)
kT2 [keV]   : 11.9391        (-3.85203      10.5226)
R2^2/D10^2  : 1.95205E-02    (-0.0183602   0.0844837)
------------------------------------------------------------
#Fit statistic : Chi-Squared =          68.24 using 59 PHA bins.
# Reduced chi-squared =          1.241 for     55 degrees of freedom
# Null hypothesis probability =   1.083317e-01

Energy  Fluence     90% Error
[keV]   [erg/cm2]   [erg/cm2]
15- 25  8.990e-08   4.761e-08
25- 50  1.054e-07   5.643e-08
50-150  7.031e-08   4.325e-08
15-150  2.655e-07   1.352e-07
Peak spectrum fit
Power-law model

Time interval is from    0.980 sec. to    1.980 sec.

Spectral model in power-law:
------------------------------------------------------------
Parameters  : value       lower 90%   higher 90%
Photon index: 1.54705     ( -0.337849   0.347265 )
Norm@50keV  : 4.34529E-03    ( -0.000992843   0.000977363 )
------------------------------------------------------------
#Fit statistic : Chi-Squared =          53.93 using 59 PHA bins.
# Reduced chi-squared =         0.9461 for     57 degrees of freedom
# Null hypothesis probability =   5.909909e-01

Photon flux (15-150 keV)    in 1 sec: 0.549624 ( -0.11676  0.116824 ) ph/cm2/s
Energy fluence (15-150 keV)             : 4.09213e-08 ( -9.93418e-09  1.02715e-08 ) ergs/cm2
Cutoff power-law model
Time interval is from    0.980 sec. to    1.980 sec.
Spectral model in the cutoff power-law:
------------------------------------------------------------
Parameters  : value       lower 90%   higher 90%
Photon index: 0.168058     ( -2.01975   1.41498 )
Epeak [keV] : 58.3451      ( -17.1685 2195.89 )
Norm@50keV  : 2.56131E-02    ( -0.0256068   0.336185 )
------------------------------------------------------------
#Fit statistic : Chi-Squared =          51.18 using 59 PHA bins.
# Reduced chi-squared =         0.9139 for     56 degrees of freedom
# Null hypothesis probability =   6.576753e-01

Photon flux (15-150 keV)    in 1 sec: 0.527630 ( -0.059996  0.118327 ) ph/cm2/s
Energy fluence (15-150 keV)             : 3.593e-08 ( -9.9893e-09  1.12833e-08 ) ergs/cm2
Band function
Time interval is from    0.980 sec. to    1.980 sec.

Spectral model in the Band function:
------------------------------------------------------------
Parameters  : value       lower 90%   higher 90%
alpha       : 5.00000   ( -6.08793   -5 )
beta        : -1.95930    ( -0.788987   0.486065 )
Epeak [keV] : 29.3562      ( -8.0819 7.57581 )
Norm@50keV   : 205.124    ( -41.9706   1237.06 )
------------------------------------------------------------
#Fit statistic : Chi-Squared =          49.50 using 59 PHA bins.
# Reduced chi-squared =         0.9000 for     55 degrees of freedom
# Null hypothesis probability =   6.840342e-01

Photon flux (15-150 keV)    in 1 sec:  (    ) ph/cm2/s
Energy fluence (15-150 keV)             : 3.60382e-08 ( 0  0 ) ergs/cm2
Single BB
Spectral model blackbody:
------------------------------------------------------------
Parameters  : value    Lower 90%  Upper 90%
kT [keV]    : 12.7988  (-2.9085  3.81367)
R^2/D10^2   : 0.113008  (-0.0685642   0.171221)
(R is the radius in km and D10 is the distance to the source in units of 10 kpc)
------------------------------------------------------------
#Fit statistic : Chi-Squared =          53.34 using 59 PHA bins.
# Reduced chi-squared =         0.9359 for     57 degrees of freedom
# Null hypothesis probability =   6.130242e-01

Energy  Fluence     90% Error
[keV]   [erg/cm2]   [erg/cm2]
15- 25  3.926e-09   1.679e-09
25- 50  1.330e-08   4.144e-09
50-150  1.364e-08   6.877e-09
15-150  3.086e-08   1.213e-08
Thermal bremsstrahlung (OTTB)
Spectral model: thermal bremsstrahlung
------------------------------------------------------------
Parameters  : value         Lower 90%    Upper 90%
kT [keV]    : 166.175       (-95.8589      -164.999)
Norm        : 2.28818       (-0.493772     0.644986)
------------------------------------------------------------
#Fit statistic : Chi-Squared =          52.69 using 59 PHA bins.
# Reduced chi-squared =         0.9244 for     57 degrees of freedom
# Null hypothesis probability =   6.372588e-01

Energy  Fluence     90% Error
[keV]   [erg/cm2]   [erg/cm2]
15- 25  5.821e-09   3.366e-09
25- 50  1.094e-08   6.010e-09
50-150  2.250e-08   1.347e-08
15-150  3.927e-08   2.278e-08
Double BB

Spectral model: bbodyrad<1> + bbodyrad<2>
------------------------------------------------------------
Parameters  : value         Lower 90%    Upper 90%
kT1 [keV]   : 7.14913        (-3.08565      6.12045)
R1^2/D10^2  : 0.499801        (-0.236064      4.04353)
kT2 [keV]   : 20.1381        (-16.8006      -20.1151)
R2^2/D10^2  : 1.57540E-02    (-0.0154052   0.106196)
------------------------------------------------------------
#Fit statistic : Chi-Squared =          50.32 using 59 PHA bins.
# Reduced chi-squared =         0.9148 for     55 degrees of freedom
# Null hypothesis probability =   6.539311e-01

Energy  Fluence     90% Error
[keV]   [erg/cm2]   [erg/cm2]
15- 25  5.421e-09   3.220e-09
25- 50  1.212e-08   6.710e-09
50-150  1.956e-08   1.203e-08
15-150  3.711e-08   1.905e-08
Pre-slew spectrum (Pre-slew PHA with pre-slew DRM)
Power-law model
Spectral model in power-law:
------------------------------------------------------------
Parameters  : value       lower 90%   higher 90%
Photon index: 2.38503     ( -0.284369   0.320494 )
Norm@50keV  : 6.94875E-04    ( -0.000160536   0.000158827 )
------------------------------------------------------------
#Fit statistic : Chi-Squared =          69.25 using 59 PHA bins.
# Reduced chi-squared =          1.215 for     57 degrees of freedom
# Null hypothesis probability =   1.280882e-01

Photon flux (15-150 keV)    in 44.54 sec: 0.127451 ( -0.0171553  0.0171649 ) ph/cm2/s
Energy fluence (15-150 keV)             : 3.00894e-07 ( -5.28436e-08  5.58042e-08 ) ergs/cm2
Cutoff power-law model
Spectral model in the cutoff power-law:
------------------------------------------------------------
Parameters  : value       lower 90%   higher 90%
Photon index: 1.67826     ( -1.61568   0.324812 )
Epeak [keV] : 16.2237      (   )
Norm@50keV  : 1.95564E-03    (     )
------------------------------------------------------------
#Fit statistic : Chi-Squared =          68.25 using 59 PHA bins.
# Reduced chi-squared =          1.219 for     56 degrees of freedom
# Null hypothesis probability =   1.262717e-01

Photon flux (15-150 keV)    in 44.54 sec: 0.124724 ( -0.017453  0.017648 ) ph/cm2/s
Energy fluence (15-150 keV)             : 2.78332e-07 ( -5.52768e-08  6.65931e-08 ) ergs/cm2
Band function

Spectral model in the Band function:
------------------------------------------------------------
Parameters  : value       lower 90%   higher 90%
alpha       : -1.67836   ( -2.57623   0.965565 )
beta        : -10.0000    ( 10   3.55271e-15 )
Epeak [keV] : 16.2207      ( -11.6759 17.2696 )
Norm@50keV   : 1.95473E-03    ( -0.00100935   0.0204807 )
------------------------------------------------------------
#Fit statistic : Chi-Squared =          68.25 using 59 PHA bins.
# Reduced chi-squared =          1.241 for     55 degrees of freedom
# Null hypothesis probability =   1.081750e-01

Photon flux (15-150 keV)    in 44.54 sec: 0.125023 ( 6.87498  -0.017661 ) ph/cm2/s
Energy fluence (15-150 keV)             : 2.80255e-07 ( 0  0 ) ergs/cm2
S(25-50 keV) vs. S(50-100 keV) plot
S(25-50 keV)  = 9.85e-08
S(50-100 keV) = 7.54e-08
T90 vs. Hardness ratio plot

T90                                   = 40.8959999680519 sec.
Hardness ratio (energy fluence ratio) = 0.765482
Color vs. Color plot

Count Ratio  (25-50 keV) / (15-25 keV) = 0.816296
Count Ratio (50-100 keV) / (15-25 keV) = 0.286563
Mask shadow pattern
IMX = 1.305061566609116E-02, IMY = 4.407026265860486E-02
TIME vs. PHA plot around the trigger time
Blue+Cyan dotted lines: Time interval of the scaled map
From 0.000000 to 2.048000
TIME vs. DetID plot around the trigger time

Blue+Cyan dotted lines: Time interval of the scaled map
From 0.000000 to 2.048000
100 us light curve (15-350 keV)
Blue+Cyan dotted lines: Time interval of the scaled map
From 0.000000 to 2.048000
Spacecraft aspect plot
Bright source in the pre-burst/pre-slew/post-slew images
Pre-burst image of 15-350 keV band
Time interval of the image:
-408.347400 -392.077100
-239.648000 -14.808000

# RAcent  DECcent POSerr Theta    Phi  PeakCts   SNR AngSep     Name
#  [deg]    [deg]    ['] [deg]  [deg]                   [']
170.3042 -60.6656   19.4  45.5  -22.1   0.1846   0.6    2.6	Cen X-3
186.6749 -62.7941    4.0  46.9  -11.1   0.9127   2.9    1.5	GX 301-2
257.2833 -60.7289    2.8  51.1   31.1   4.5034   4.0 ------	UNKNOWN
216.4583 -68.5371    2.5  44.5    7.3   1.4394   4.6 ------	UNKNOWN
182.4889 -67.7225    2.1  41.7  -10.6   1.3562   5.6 ------	UNKNOWN
Pre-slew background subtracted image of 15-350 keV band
Time interval of the image:
-14.808000 29.736000

# RAcent  DECcent POSerr Theta    Phi  PeakCts   SNR AngSep     Name
#  [deg]    [deg]    ['] [deg]  [deg]                   [']
170.4239 -60.6363   12.8  45.5  -22.0   0.1144   0.9    3.3	Cen X-3
186.7062 -62.7524    4.8  46.9  -11.1  -0.3161  -2.4    1.7	GX 301-2
273.5473 -60.7901    2.4  48.6   41.0   1.5596   4.9 ------	UNKNOWN
321.0833 -63.9083    2.3  34.1   65.9   0.6488   5.1 ------	UNKNOWN
 56.3381 -66.5778    1.1   2.6  -73.5   0.7163  10.9 ------	UNKNOWN
 59.8099 -44.4580    2.4  22.8 -147.0   0.3224   4.8 ------	UNKNOWN
129.4628 -61.6580    2.9  32.7  -45.6   0.3787   4.0 ------	UNKNOWN
Post-slew image of 15-350 keV band
Time interval of the image:
47.452600 902.447700

# RAcent  DECcent POSerr Theta    Phi  PeakCts   SNR AngSep     Name
#  [deg]    [deg]    ['] [deg]  [deg]                   [']
170.2343 -60.6682   13.0  43.9  -17.9   0.8372   0.9    3.6	Cen X-3
186.7152 -62.8839    7.1  45.6   -6.7   1.7862   1.6    7.0	GX 301-2
 13.7883 -29.7873    2.2  44.8  145.9   8.6151   5.2 ------	UNKNOWN
 30.5168 -15.0931    2.6  54.2  171.1  12.1417   4.4 ------	UNKNOWN
210.2670 -55.0679    2.8  56.8    4.9  12.7371   4.1 ------	UNKNOWN
208.0184 -67.4602    2.3  44.5    7.4   5.1451   5.0 ------	UNKNOWN
 37.1260 -50.2551    3.0  19.0  162.0   2.2130   3.8 ------	UNKNOWN
 40.3376 -32.7396    2.2  35.1  178.5   3.8961   5.2 ------	UNKNOWN
186.7112 -58.2854    2.5  49.8   -9.2   5.6694   4.5 ------	UNKNOWN
 68.1928 -41.2319    2.2  26.1 -137.2   3.2761   5.2 ------	UNKNOWN
 49.0598  -7.7292    3.0  59.0 -166.1  15.2636   3.9 ------	UNKNOWN
Plot creation:
Sat May 30 12:50:48 EDT 2015