Click here for the BAT GCN circular template
Image
Pre-slew 15.0-350.0 keV image (Event data)
#   RAcent    DECcent   POSerr    Theta     Phi              Peak Cts       SNR   Name
  127.2424    58.1908   0.0039    31.0777   -27.3774         3.9212484     49.325 TRIG_00609736

Foreground time interval of the image:
-20.328  13.141 (delta_t =  33.469 [sec])
Background time interval of the image:
-424.659 -406.185 (delta_t =  18.475 [sec])
-239.760 -20.328 (delta_t = 219.432 [sec])
Lightcurves
Notes:
- 1) The mask-weighted light curves are using the flight position.
- 2) Multiple plots of different time binning/intervals are shown to cover all scenarios of short/long GRBs, rate/image triggers, and real/false positives.
- 3) For all the mask-weighted lightcurves, the y-axis units are counts/sec/det where a det is 0.4 x 0.4 = 0.16 sq cm.
- 4) The verticle lines correspond to following: green dotted lines are T50 interval, black dotted lines are T90 interval, blue solid line(s) is a spacecraft slew start time, and orange solid line(s) is a spacecraft slew end time.
- 5) Time of each bin is in the middle of the bin.
1 s binning
From T0-310 s to T0+310 s

From T100_start - 20 s to T100_end + 30 s

Full time interval
64 ms binning
Full time interval
From T100_start to T100_end

From T0-5 sec to T0+5 sec
16 ms binning
From T100_start-5 s to T100_start+5 s
Blue+Cyan dotted lines: Time interval of the scaled map
From 0.000000 to 1.024000
8 ms binning
From T100_start-3 s to T100_start+3 s
Blue+Cyan dotted lines: Time interval of the scaled map
From 0.000000 to 1.024000
2 ms binning
From T100_start-1 s to T100_start+1 s
Blue+Cyan dotted lines: Time interval of the scaled map
From 0.000000 to 1.024000
SN=5 or 10 sec. binning (whichever binning is satisfied first)
SN=5 or 10 sec. binning (T < 200 sec)

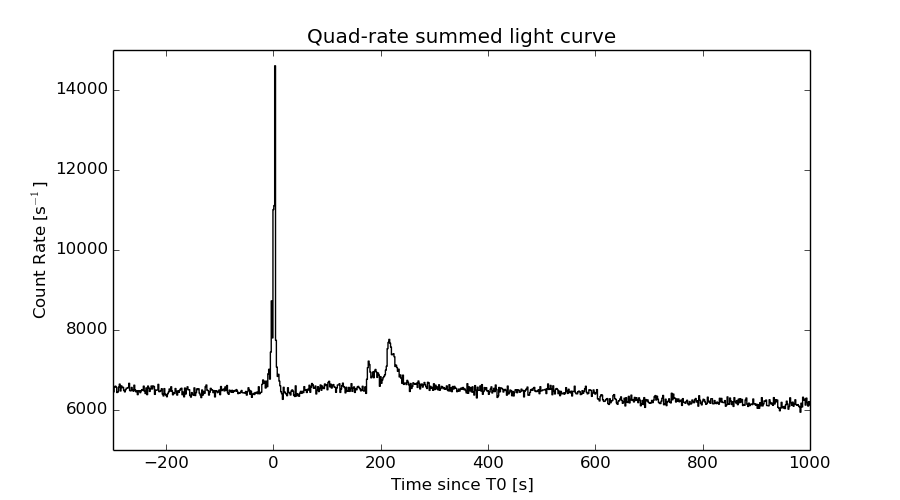
Quad-rate summed light curves (from T0-300s to T0+1000s)
Spectral Evolution

Spectra
Notes:
- 1) The fitting includes the systematic errors.
- 2) When the burst includes telescope slew time periods, the fitting uses an average response file made from multiple 5-s response files through out the slew time plus single time preiod for the non-slew times, and weighted by the total counts in the corresponding time period using addrmf. An average response file is needed becuase a spectral fit using the pre-slew DRM will introduce some errors in both a spectral shape and a normalization if the PHA file contains a lot of the slew/post-slew time interval.
- 3) For fits to more complicated models (e.g. a power-law over a cutoff power-law), the BAT team has decided to require a chi-square improvement of more than 6 for each extra dof.
Time averaged spectrum fit using the average DRM
Power-law model

Time interval is from  -20.328 sec. to  298.576 sec.

Spectral model in power-law:
------------------------------------------------------------
Parameters  : value       lower 90%   higher 90%
Photon index: 1.46886     ( -0.077997   0.0779128 )
Norm@50keV  : 1.47809E-03    ( -6.10598e-05   6.0989e-05 )
------------------------------------------------------------
#Fit statistic : Chi-Squared =          52.79 using 59 PHA bins.
# Reduced chi-squared =         0.9261 for     57 degrees of freedom
# Null hypothesis probability =   6.337330e-01

Photon flux (15-150 keV)    in 318.9 sec: 0.183022 ( -0.00796376  0.0079905 ) ph/cm2/s
Energy fluence (15-150 keV)             : 4.49528e-06 ( -2.02313e-07  2.03392e-07 ) ergs/cm2
Cutoff power-law model

Time interval is from  -20.328 sec. to  298.576 sec.
Spectral model in the cutoff power-law:
------------------------------------------------------------
Parameters  : value       lower 90%   higher 90%
Photon index: 1.45772     ( -0.26281   0.0794796 )
Epeak [keV] : 8823.13      ( -9999.36 -9999.36 )
Norm@50keV  : 1.49512E-03    ( -6.12416e-05   0.000463389 )
------------------------------------------------------------
#Fit statistic : Chi-Squared =          52.91 using 59 PHA bins.
# Reduced chi-squared =         0.9449 for     56 degrees of freedom
# Null hypothesis probability =   5.925101e-01

Photon flux (15-150 keV)    in 318.9 sec: 0.183023 ( -0.008024  0.007825 ) ph/cm2/s
Energy fluence (15-150 keV)             : 4.47914e-06 ( -2.04893e-07  2.25399e-07 ) ergs/cm2
Band function

Time interval is from  -20.328 sec. to  298.576 sec.

Spectral model in the Band function:
------------------------------------------------------------
Parameters  : value       lower 90%   higher 90%
alpha       : -1.06493   ( 1.0506   1.0506 )
beta        : -1.47167    ( 1.47222   0.0804217 )
Epeak [keV] : 51.8409      ( -52.6703 -52.6703 )
Norm@50keV   : 3.06978E-03    ( -0.00175386   0 )
------------------------------------------------------------
#Fit statistic : Chi-Squared =          52.73 using 59 PHA bins.
# Reduced chi-squared =         0.9587 for     55 degrees of freedom
# Null hypothesis probability =   5.618612e-01

Photon flux (15-150 keV)    in 318.9 sec:  (    ) ph/cm2/s
Energy fluence (15-150 keV)             : 0 ( 0  0 ) ergs/cm2
Single BB
Spectral model blackbody:
------------------------------------------------------------
Parameters  : value    Lower 90%  Upper 90%
kT [keV]    : 16.3899  (  )
R^2/D10^2   : 1.47297E-02  (   )
(R is the radius in km and D10 is the distance to the source in units of 10 kpc)
------------------------------------------------------------
#Fit statistic : Chi-Squared =         206.32 using 59 PHA bins.
# Reduced chi-squared =         3.6196 for     57 degrees of freedom
# Null hypothesis probability =   8.788472e-19

Energy  Fluence     90% Error
[keV]   [erg/cm2]   [erg/cm2]
15- 25  2.594e-07   2.176e-08
25- 50  1.114e-06   6.904e-08
50-150  2.111e-06   1.630e-07
15-150  3.484e-06   1.738e-07
Thermal bremsstrahlung (OTTB)
Spectral model: thermal bremsstrahlung
------------------------------------------------------------
Parameters  : value         Lower 90%    Upper 90%
kT [keV]    : 200.000       (      )
Norm        : 0.746776       (-0.0310922     0.031095)
------------------------------------------------------------
#Fit statistic : Chi-Squared =          61.19 using 59 PHA bins.
# Reduced chi-squared =          1.074 for     57 degrees of freedom
# Null hypothesis probability =   3.279141e-01

Energy  Fluence     90% Error
[keV]   [erg/cm2]   [erg/cm2]
15- 25  5.963e-07   2.982e-08
25- 50  1.147e-06   5.230e-08
50-150  2.516e-06   1.111e-07
15-150  4.259e-06   1.929e-07
Double BB

Spectral model: bbodyrad<1> + bbodyrad<2>
------------------------------------------------------------
Parameters  : value         Lower 90%    Upper 90%
kT1 [keV]   : 6.82636        (-0.964514      1.08087)
R1^2/D10^2  : 0.207508        (-0.082709      0.155608)
kT2 [keV]   : 28.5396        (-3.721      5.46015)
R2^2/D10^2  : 1.84488E-03    (-0.000817942   0.00116369)
------------------------------------------------------------
#Fit statistic : Chi-Squared =          56.72 using 59 PHA bins.
# Reduced chi-squared =          1.031 for     55 degrees of freedom
# Null hypothesis probability =   4.107681e-01

Energy  Fluence     90% Error
[keV]   [erg/cm2]   [erg/cm2]
15- 25  5.595e-07   9.073e-08
25- 50  1.095e-06   1.186e-07
50-150  2.828e-06   3.820e-07
15-150  4.483e-06   4.528e-07
Peak spectrum fit
Power-law model

Time interval is from    2.644 sec. to    3.644 sec.

Spectral model in power-law:
------------------------------------------------------------
Parameters  : value       lower 90%   higher 90%
Photon index: 1.04806     ( -0.0624252   0.062098 )
Norm@50keV  : 6.02843E-02    ( -0.00223215   0.00223086 )
------------------------------------------------------------
#Fit statistic : Chi-Squared =          58.62 using 59 PHA bins.
# Reduced chi-squared =          1.028 for     57 degrees of freedom
# Null hypothesis probability =   4.157897e-01

Photon flux (15-150 keV)    in 1 sec: 6.96163 ( -0.263581  0.263745 ) ph/cm2/s
Energy fluence (15-150 keV)             : 6.41134e-07 ( -2.57185e-08  2.57543e-08 ) ergs/cm2
Cutoff power-law model

Time interval is from    2.644 sec. to    3.644 sec.
Spectral model in the cutoff power-law:
------------------------------------------------------------
Parameters  : value       lower 90%   higher 90%
Photon index: 0.422173     ( -0.282665   0.265599 )
Epeak [keV] : 146.259      ( -28.221 63.2639 )
Norm@50keV  : 0.113998    ( -0.0263052   0.0364502 )
------------------------------------------------------------
#Fit statistic : Chi-Squared =          41.12 using 59 PHA bins.
# Reduced chi-squared =         0.7343 for     56 degrees of freedom
# Null hypothesis probability =   9.318322e-01

Photon flux (15-150 keV)    in 1 sec: 6.80516 ( -0.27089  0.27107 ) ph/cm2/s
Energy fluence (15-150 keV)             : 6.2677e-07 ( -2.7133e-08  2.7036e-08 ) ergs/cm2
Band function

Time interval is from    2.644 sec. to    3.644 sec.

Spectral model in the Band function:
------------------------------------------------------------
Parameters  : value       lower 90%   higher 90%
alpha       : -0.422117   ( -0.127315   0.298058 )
beta        : -10.0000    ( 10   3.55271e-15 )
Epeak [keV] : 146.234      ( -21.5111 63.2687 )
Norm@50keV   : 0.114004    ( -0.0263519   0.03646 )
------------------------------------------------------------
#Fit statistic : Chi-Squared =          41.12 using 59 PHA bins.
# Reduced chi-squared =         0.7477 for     55 degrees of freedom
# Null hypothesis probability =   9.176460e-01

Photon flux (15-150 keV)    in 1 sec:  (    ) ph/cm2/s
Energy fluence (15-150 keV)             : 0 ( 0  0 ) ergs/cm2
Single BB
Spectral model blackbody:
------------------------------------------------------------
Parameters  : value    Lower 90%  Upper 90%
kT [keV]    : 21.3536  (  )
R^2/D10^2   : 0.277422  (   )
(R is the radius in km and D10 is the distance to the source in units of 10 kpc)
------------------------------------------------------------
#Fit statistic : Chi-Squared =         120.45 using 59 PHA bins.
# Reduced chi-squared =         2.1132 for     57 degrees of freedom
# Null hypothesis probability =   1.924607e-06

Energy  Fluence     90% Error
[keV]   [erg/cm2]   [erg/cm2]
15- 25  2.373e-08   1.670e-09
25- 50  1.232e-07   6.500e-09
50-150  4.193e-07   2.580e-08
15-150  5.662e-07   2.585e-08
Thermal bremsstrahlung (OTTB)

Spectral model: thermal bremsstrahlung
------------------------------------------------------------
Parameters  : value         Lower 90%    Upper 90%
kT [keV]    : 199.363       (      )
Norm        : 28.3975       (     )
------------------------------------------------------------
#Fit statistic : Chi-Squared =         224.66 using 59 PHA bins.
# Reduced chi-squared =         3.9413 for     57 degrees of freedom
# Null hypothesis probability =   9.261375e-22

Energy  Fluence     90% Error
[keV]   [erg/cm2]   [erg/cm2]
15- 25  7.071e-08   2.790e-09
25- 50  1.360e-07   5.350e-09
50-150  2.983e-07   1.235e-08
15-150  5.051e-07   2.070e-08
Double BB
Spectral model: bbodyrad<1> + bbodyrad<2>
------------------------------------------------------------
Parameters  : value         Lower 90%    Upper 90%
kT1 [keV]   : 9.01475        (-1.78424      2.05745)
R1^2/D10^2  : 1.95647        (-0.804164      1.74647)
kT2 [keV]   : 31.2711        (-3.8787      6.43675)
R2^2/D10^2  : 6.82795E-02    (-0.0327467   0.0412946)
------------------------------------------------------------
#Fit statistic : Chi-Squared =          40.94 using 59 PHA bins.
# Reduced chi-squared =         0.7443 for     55 degrees of freedom
# Null hypothesis probability =   9.208563e-01

Energy  Fluence     90% Error
[keV]   [erg/cm2]   [erg/cm2]
15- 25  4.116e-08   7.695e-09
25- 50  1.299e-07   1.821e-08
50-150  4.587e-07   6.355e-08
15-150  6.297e-07   9.220e-08
Pre-slew spectrum (Pre-slew PHA with pre-slew DRM)
Power-law model

Spectral model in power-law:
------------------------------------------------------------
Parameters  : value       lower 90%   higher 90%
Photon index: 1.36956     ( -0.0594002   0.0592596 )
Norm@50keV  : 7.91770E-03    ( -0.000250378   0.000250372 )
------------------------------------------------------------
#Fit statistic : Chi-Squared =          44.53 using 59 PHA bins.
# Reduced chi-squared =         0.7812 for     57 degrees of freedom
# Null hypothesis probability =   8.854469e-01

Photon flux (15-150 keV)    in 33.47 sec: 0.957779 ( -0.0328372  0.0329546 ) ph/cm2/s
Energy fluence (15-150 keV)             : 2.57711e-06 ( -8.72104e-08  8.74437e-08 ) ergs/cm2
Cutoff power-law model
Spectral model in the cutoff power-law:
------------------------------------------------------------
Parameters  : value       lower 90%   higher 90%
Photon index: 1.27362     ( -0.239603   0.0957383 )
Epeak [keV] : 388.423      ( -657.987 -657.987 )
Norm@50keV  : 8.75928E-03    ( -0.0012237   0.00218992 )
------------------------------------------------------------
#Fit statistic : Chi-Squared =          44.67 using 59 PHA bins.
# Reduced chi-squared =         0.7977 for     56 degrees of freedom
# Null hypothesis probability =   8.618421e-01

Photon flux (15-150 keV)    in 33.47 sec: 0.954145 ( -0.035279  0.034979 ) ph/cm2/s
Energy fluence (15-150 keV)             : 2.56915e-06 ( -9.41879e-08  9.30433e-08 ) ergs/cm2
Band function
Spectral model in the Band function:
------------------------------------------------------------
Parameters  : value       lower 90%   higher 90%
alpha       : 0.736533   ( -0.95498   -0.95498 )
beta        : -1.39834    ( -0.0758742   0.0706056 )
Epeak [keV] : 33.2505      ( -32.0494 84.218 )
Norm@50keV   : 0.274152    ( -0.273074   377.384 )
------------------------------------------------------------
#Fit statistic : Chi-Squared =          42.75 using 59 PHA bins.
# Reduced chi-squared =         0.7773 for     55 degrees of freedom
# Null hypothesis probability =   8.855701e-01

Photon flux (15-150 keV)    in 33.47 sec:  (    ) ph/cm2/s
Energy fluence (15-150 keV)             : 0 ( 0  0 ) ergs/cm2
S(25-50 keV) vs. S(50-100 keV) plot

S(25-50 keV)  = 1.09e-06
S(50-100 keV) = 1.58e-06
T90 vs. Hardness ratio plot
T90                                   = 258.343999922276 sec.
Hardness ratio (energy fluence ratio) = 1.44954
Color vs. Color plot
Count Ratio  (25-50 keV) / (15-25 keV) = 1.32959
Count Ratio (50-100 keV) / (15-25 keV) = 1.04466
Mask shadow pattern

IMX = 5.352035358059961E-01, IMY = 2.771555482262377E-01
TIME vs. PHA plot around the trigger time
Blue+Cyan dotted lines: Time interval of the scaled map
From 0.000000 to 1.024000
TIME vs. DetID plot around the trigger time

Blue+Cyan dotted lines: Time interval of the scaled map
From 0.000000 to 1.024000
100 us light curve (15-350 keV)

Blue+Cyan dotted lines: Time interval of the scaled map
From 0.000000 to 1.024000
Spacecraft aspect plot
Bright source in the pre-burst/pre-slew/post-slew images
Pre-burst image of 15-350 keV band
Time interval of the image:
-424.659400 -406.184600
-239.760000 -20.328000

# RAcent  DECcent POSerr Theta    Phi  PeakCts   SNR AngSep     Name
#  [deg]    [deg]    ['] [deg]  [deg]                   [']
206.3212  -1.5874    3.4  58.3 -175.6   3.9366   3.4 ------	UNKNOWN
196.0964  -4.7981    3.5  59.3 -163.2   4.3632   3.3 ------	UNKNOWN
Pre-slew background subtracted image of 15-350 keV band
Time interval of the image:
-20.328000 13.140590

# RAcent  DECcent POSerr Theta    Phi  PeakCts   SNR AngSep     Name
#  [deg]    [deg]    ['] [deg]  [deg]                   [']
243.4217  40.8871    2.5  41.1  114.1   1.1560   4.6 ------	UNKNOWN
 79.6382  74.0215    2.5  42.8    7.9   0.5521   4.6 ------	UNKNOWN
127.2424  58.1908    0.2  31.1  -27.4   3.9214  49.3 ------	UNKNOWN
Post-slew image of 15-350 keV band
Time interval of the image:
78.340580 962.320900

# RAcent  DECcent POSerr Theta    Phi  PeakCts   SNR AngSep     Name
#  [deg]    [deg]    ['] [deg]  [deg]                   [']
 83.6332  22.0177    0.5  47.7   -3.9  20.9207  22.6    0.2	Crab
 62.0761  66.8625    3.7  29.7   70.4   2.2394   3.1 ------	UNKNOWN
 73.3653  25.3037    3.4  49.9    9.0   3.7913   3.4 ------	UNKNOWN
207.3119  56.4873    3.1  40.7  172.9   2.6373   3.7 ------	UNKNOWN
195.4208  56.7307    2.4  35.1  178.6   2.6352   4.7 ------	UNKNOWN
127.2352  58.2099    1.2   0.1  119.1   4.1290   9.3 ------	UNKNOWN
209.4260  32.3856    3.2  59.0 -166.2  11.6842   3.7 ------	UNKNOWN
102.7481  13.5334    2.3  48.3  -31.0   5.0040   5.0 ------	UNKNOWN
112.3840   8.6608    3.9  50.8  -44.6   7.1467   3.0 ------	UNKNOWN
Plot creation:
Sat May 30 12:48:54 EDT 2015