Special notes of this burst
Image
Pre-slew 15.0-350.0 keV image (Event data)
#   RAcent    DECcent   POSerr    Theta     Phi              Peak Cts       SNR   Name
  142.0319    14.5707   0.0094    38.1020   -60.1641         2.5010720     20.699 TRIG_00610953

Foreground time interval of the image:
 -6.708  18.316 (delta_t =  25.024 [sec])
Background time interval of the image:
-239.496  -6.708 (delta_t = 232.788 [sec])
Lightcurves
Notes:
- 1) The mask-weighted light curves are using the flight position.
- 2) Multiple plots of different time binning/intervals are shown to cover all scenarios of short/long GRBs, rate/image triggers, and real/false positives.
- 3) For all the mask-weighted lightcurves, the y-axis units are counts/sec/det where a det is 0.4 x 0.4 = 0.16 sq cm.
- 4) The verticle lines correspond to following: green dotted lines are T50 interval, black dotted lines are T90 interval, blue solid line(s) is a spacecraft slew start time, and orange solid line(s) is a spacecraft slew end time.
- 5) Time of each bin is in the middle of the bin.
1 s binning
From T0-310 s to T0+310 s
From T100_start - 20 s to T100_end + 30 s
Full time interval
64 ms binning
Full time interval
From T100_start to T100_end
From T0-5 sec to T0+5 sec
16 ms binning
From T100_start-5 s to T100_start+5 s
Blue+Cyan dotted lines: Time interval of the scaled map
From 0.000000 to 1.024000
8 ms binning
From T100_start-3 s to T100_start+3 s
Blue+Cyan dotted lines: Time interval of the scaled map
From 0.000000 to 1.024000
2 ms binning
From T100_start-1 s to T100_start+1 s
Blue+Cyan dotted lines: Time interval of the scaled map
From 0.000000 to 1.024000
SN=5 or 10 sec. binning (whichever binning is satisfied first)
SN=5 or 10 sec. binning (T < 200 sec)
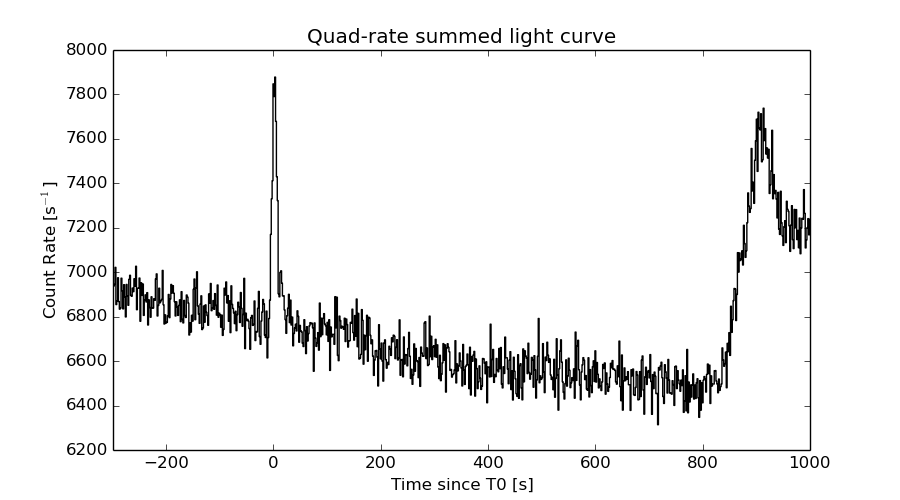
Quad-rate summed light curves (from T0-300s to T0+1000s)
Spectral Evolution
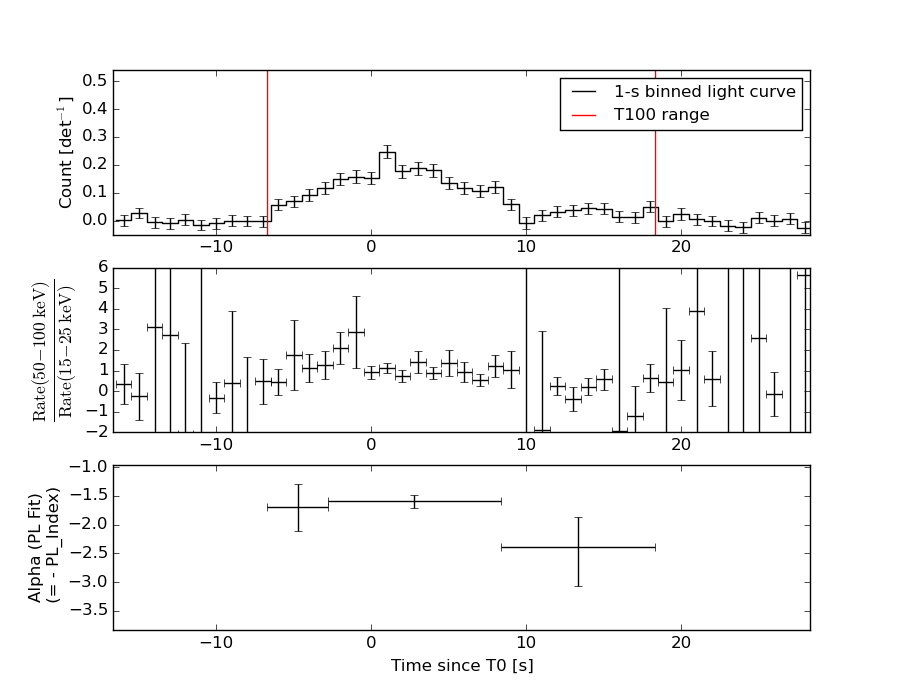
Spectra
Notes:
- 1) The fitting includes the systematic errors.
- 2) When the burst includes telescope slew time periods, the fitting uses an average response file made from multiple 5-s response files through out the slew time plus single time preiod for the non-slew times, and weighted by the total counts in the corresponding time period using addrmf. An average response file is needed becuase a spectral fit using the pre-slew DRM will introduce some errors in both a spectral shape and a normalization if the PHA file contains a lot of the slew/post-slew time interval.
- 3) For fits to more complicated models (e.g. a power-law over a cutoff power-law), the BAT team has decided to require a chi-square improvement of more than 6 for each extra dof.
Time averaged spectrum fit using the average DRM
Power-law model

Time interval is from   -6.708 sec. to   18.316 sec.

Spectral model in power-law:
------------------------------------------------------------
Parameters  : value       lower 90%   higher 90%
Photon index: 1.72921     ( -0.123863   0.126522 )
Norm@50keV  : 6.38423E-03    ( -0.000502301   0.000497927 )
------------------------------------------------------------
#Fit statistic : Chi-Squared =          65.25 using 59 PHA bins.
# Reduced chi-squared =          1.145 for     57 degrees of freedom
# Null hypothesis probability =   2.119278e-01

Photon flux (15-150 keV)    in 25.02 sec: 0.856733 ( -0.0624457  0.0625025 ) ph/cm2/s
Energy fluence (15-150 keV)             : 1.47582e-06 ( -1.20433e-07  1.21503e-07 ) ergs/cm2
Cutoff power-law model
Time interval is from   -6.708 sec. to   18.316 sec.
Spectral model in the cutoff power-law:
------------------------------------------------------------
Parameters  : value       lower 90%   higher 90%
Photon index: 0.795101     ( -0.653584   0.570356 )
Epeak [keV] : 59.7894      ( -9.44257 24.3325 )
Norm@50keV  : 2.01132E-02    ( -0.00998719   0.0241893 )
------------------------------------------------------------
#Fit statistic : Chi-Squared =          56.84 using 59 PHA bins.
# Reduced chi-squared =          1.015 for     56 degrees of freedom
# Null hypothesis probability =   4.435145e-01

Photon flux (15-150 keV)    in 25.02 sec: 0.823137 ( -0.065606  0.065582 ) ph/cm2/s
Energy fluence (15-150 keV)             : 1.36932e-06 ( -1.32233e-07  1.35723e-07 ) ergs/cm2
Band function

Time interval is from   -6.708 sec. to   18.316 sec.

Spectral model in the Band function:
------------------------------------------------------------
Parameters  : value       lower 90%   higher 90%
alpha       : -0.821096   ( -0.591341   0.871479 )
beta        : -2.57163    ( 2.65073   0.698199 )
Epeak [keV] : 59.6982      ( -14.6774 23.5146 )
Norm@50keV   : 1.95654E-02    ( -0.0110669   0.0494816 )
------------------------------------------------------------
#Fit statistic : Chi-Squared =          56.65 using 59 PHA bins.
# Reduced chi-squared =          1.030 for     55 degrees of freedom
# Null hypothesis probability =   4.132374e-01

Photon flux (15-150 keV)    in 25.02 sec:  (    ) ph/cm2/s
Energy fluence (15-150 keV)             : 0 ( 0  0 ) ergs/cm2
Single BB
Spectral model blackbody:
------------------------------------------------------------
Parameters  : value    Lower 90%  Upper 90%
kT [keV]    : 12.7672  (-1.00474  1.09089)
R^2/D10^2   : 0.168799  (-0.0440658   0.0592687)
(R is the radius in km and D10 is the distance to the source in units of 10 kpc)
------------------------------------------------------------
#Fit statistic : Chi-Squared =          81.03 using 59 PHA bins.
# Reduced chi-squared =          1.422 for     57 degrees of freedom
# Null hypothesis probability =   1.992856e-02

Energy  Fluence     90% Error
[keV]   [erg/cm2]   [erg/cm2]
15- 25  1.460e-07   2.033e-08
25- 50  4.931e-07   3.853e-08
50-150  5.027e-07   8.269e-08
15-150  1.142e-06   1.036e-07
Thermal bremsstrahlung (OTTB)
Spectral model: thermal bremsstrahlung
------------------------------------------------------------
Parameters  : value         Lower 90%    Upper 90%
kT [keV]    : 111.716       (-25.9488      46.5638)
Norm        : 3.73674       (-0.352273     0.37464)
------------------------------------------------------------
#Fit statistic : Chi-Squared =          58.83 using 59 PHA bins.
# Reduced chi-squared =          1.032 for     57 degrees of freedom
# Null hypothesis probability =   4.083972e-01

Energy  Fluence     90% Error
[keV]   [erg/cm2]   [erg/cm2]
15- 25  2.441e-07   2.651e-08
25- 50  4.311e-07   3.978e-08
50-150  7.420e-07   2.595e-07
15-150  1.417e-06   2.798e-07
Double BB
Spectral model: bbodyrad<1> + bbodyrad<2>
------------------------------------------------------------
Parameters  : value         Lower 90%    Upper 90%
kT1 [keV]   : 5.27272        (-1.50945      2.15462)
R1^2/D10^2  : 2.08582        (-1.40948      5.2023)
kT2 [keV]   : 16.9395        (-2.40492      4.47456)
R2^2/D10^2  : 4.93152E-02    (-0.0316567   0.0351866)
------------------------------------------------------------
#Fit statistic : Chi-Squared =          56.70 using 59 PHA bins.
# Reduced chi-squared =          1.031 for     55 degrees of freedom
# Null hypothesis probability =   4.114747e-01

Energy  Fluence     90% Error
[keV]   [erg/cm2]   [erg/cm2]
15- 25  2.284e-07   9.999e-08
25- 50  4.345e-07   1.416e-07
50-150  6.577e-07   1.948e-07
15-150  1.321e-06   3.301e-07
Peak spectrum fit
Power-law model
Time interval is from    0.496 sec. to    1.496 sec.

Spectral model in power-law:
------------------------------------------------------------
Parameters  : value       lower 90%   higher 90%
Photon index: 1.71495     ( -0.228024   0.239993 )
Norm@50keV  : 1.67282E-02    ( -0.002673   0.00262152 )
------------------------------------------------------------
#Fit statistic : Chi-Squared =          56.09 using 59 PHA bins.
# Reduced chi-squared =         0.9840 for     57 degrees of freedom
# Null hypothesis probability =   5.092634e-01

Photon flux (15-150 keV)    in 1 sec: 2.23343 ( -0.314539  0.314598 ) ph/cm2/s
Energy fluence (15-150 keV)             : 1.5471e-07 ( -2.54585e-08  2.5961e-08 ) ergs/cm2
Cutoff power-law model

Time interval is from    0.496 sec. to    1.496 sec.
Spectral model in the cutoff power-law:
------------------------------------------------------------
Parameters  : value       lower 90%   higher 90%
Photon index: 0.800227     ( -1.07628   0.863975 )
Epeak [keV] : 60.2027      ( -16.1183 154.543 )
Norm@50keV  : 5.27532E-02    ( -0.0527259   0.151758 )
------------------------------------------------------------
#Fit statistic : Chi-Squared =          52.73 using 59 PHA bins.
# Reduced chi-squared =         0.9417 for     56 degrees of freedom
# Null hypothesis probability =   5.992406e-01

Photon flux (15-150 keV)    in 1 sec: 2.18315 ( -0.3173  0.31766 ) ph/cm2/s
Energy fluence (15-150 keV)             : 1.45468e-07 ( -2.6487e-08  2.7425e-08 ) ergs/cm2
Band function
Time interval is from    0.496 sec. to    1.496 sec.

Spectral model in the Band function:
------------------------------------------------------------
Parameters  : value       lower 90%   higher 90%
alpha       : -0.798387   ( -0.54871   1.42034 )
beta        : -10.0000    ( 10   7.10543e-15 )
Epeak [keV] : 60.1533      ( -16.019 153.39 )
Norm@50keV   : 5.28787E-02    ( -0.0335034   0.151704 )
------------------------------------------------------------
#Fit statistic : Chi-Squared =          52.73 using 59 PHA bins.
# Reduced chi-squared =         0.9588 for     55 degrees of freedom
# Null hypothesis probability =   5.616566e-01

Photon flux (15-150 keV)    in 1 sec: 2.19695 ( 4.80305  -0.30569 ) ph/cm2/s
Energy fluence (15-150 keV)             : 1.47693e-07 ( -1.47686e-07  -2.8787e-08 ) ergs/cm2
Single BB
Spectral model blackbody:
------------------------------------------------------------
Parameters  : value    Lower 90%  Upper 90%
kT [keV]    : 12.1983  (-2.11214  2.5927)
R^2/D10^2   : 0.527113  (-0.264068   0.523722)
(R is the radius in km and D10 is the distance to the source in units of 10 kpc)
------------------------------------------------------------
#Fit statistic : Chi-Squared =          62.33 using 59 PHA bins.
# Reduced chi-squared =          1.093 for     57 degrees of freedom
# Null hypothesis probability =   2.925073e-01

Energy  Fluence     90% Error
[keV]   [erg/cm2]   [erg/cm2]
15- 25  1.661e-08   4.265e-09
25- 50  5.328e-08   1.115e-08
50-150  4.819e-08   1.595e-08
15-150  1.181e-07   2.417e-08
Thermal bremsstrahlung (OTTB)
Spectral model: thermal bremsstrahlung
------------------------------------------------------------
Parameters  : value         Lower 90%    Upper 90%
kT [keV]    : 117.026       (-46.4167      -115.988)
Norm        : 9.65095       (-1.53038     1.99072)
------------------------------------------------------------
#Fit statistic : Chi-Squared =          53.54 using 59 PHA bins.
# Reduced chi-squared =         0.9393 for     57 degrees of freedom
# Null hypothesis probability =   6.057627e-01

Energy  Fluence     90% Error
[keV]   [erg/cm2]   [erg/cm2]
15- 25  2.516e-08   5.530e-09
25- 50  4.482e-08   1.342e-08
50-150  7.899e-08   4.754e-08
15-150  1.490e-07   7.024e-08
Double BB
Spectral model: bbodyrad<1> + bbodyrad<2>
------------------------------------------------------------
Parameters  : value         Lower 90%    Upper 90%
kT1 [keV]   : 6.27919        (-2.01884      2.58306)
R1^2/D10^2  : 3.56163        (-2.44657      11.7559)
kT2 [keV]   : 20.5334        (-5.33122      10.3789)
R2^2/D10^2  : 5.91880E-02    (-0.0487578   0.144625)
------------------------------------------------------------
#Fit statistic : Chi-Squared =          50.93 using 59 PHA bins.
# Reduced chi-squared =         0.9260 for     55 degrees of freedom
# Null hypothesis probability =   6.307686e-01

Energy  Fluence     90% Error
[keV]   [erg/cm2]   [erg/cm2]
15- 25  2.462e-08   1.352e-08
25- 50  4.595e-08   2.378e-08
50-150  7.803e-08   4.416e-08
15-150  1.486e-07   7.770e-08
Pre-slew spectrum (Pre-slew PHA with pre-slew DRM)
Power-law model
Spectral model in power-law:
------------------------------------------------------------
Parameters  : value       lower 90%   higher 90%
Photon index: 1.72921     ( -0.123863   0.126522 )
Norm@50keV  : 6.38423E-03    ( -0.000502301   0.000497927 )
------------------------------------------------------------
#Fit statistic : Chi-Squared =          65.25 using 59 PHA bins.
# Reduced chi-squared =          1.145 for     57 degrees of freedom
# Null hypothesis probability =   2.119278e-01

Photon flux (15-150 keV)    in 25.02 sec: 0.856733 ( -0.0624457  0.0625025 ) ph/cm2/s
Energy fluence (15-150 keV)             : 1.47582e-06 ( -1.20433e-07  1.21503e-07 ) ergs/cm2
Cutoff power-law model

Spectral model in the cutoff power-law:
------------------------------------------------------------
Parameters  : value       lower 90%   higher 90%
Photon index: 0.795101     ( -0.653584   0.570356 )
Epeak [keV] : 59.7894      ( -9.44257 24.3325 )
Norm@50keV  : 2.01132E-02    ( -0.00998719   0.0241893 )
------------------------------------------------------------
#Fit statistic : Chi-Squared =          56.84 using 59 PHA bins.
# Reduced chi-squared =          1.015 for     56 degrees of freedom
# Null hypothesis probability =   4.435145e-01

Photon flux (15-150 keV)    in 25.02 sec: 0.823137 ( -0.065606  0.065582 ) ph/cm2/s
Energy fluence (15-150 keV)             : 1.36932e-06 ( -1.32233e-07  1.35723e-07 ) ergs/cm2
Band function
Spectral model in the Band function:
------------------------------------------------------------
Parameters  : value       lower 90%   higher 90%
alpha       : -0.821096   ( -0.591341   0.871479 )
beta        : -2.57163    ( 2.65073   0.698199 )
Epeak [keV] : 59.6982      ( -14.6774 23.5146 )
Norm@50keV   : 1.95654E-02    ( -0.0110669   0.0494816 )
------------------------------------------------------------
#Fit statistic : Chi-Squared =          56.65 using 59 PHA bins.
# Reduced chi-squared =          1.030 for     55 degrees of freedom
# Null hypothesis probability =   4.132374e-01

Photon flux (15-150 keV)    in 25.02 sec:  (    ) ph/cm2/s
Energy fluence (15-150 keV)             : 0 ( 0  0 ) ergs/cm2
S(25-50 keV) vs. S(50-100 keV) plot
S(25-50 keV)  = 4.04e-07
S(50-100 keV) = 4.88e-07
T90 vs. Hardness ratio plot
T90                                   = 19.1480000019073 sec.
Hardness ratio (energy fluence ratio) = 1.20792
Color vs. Color plot
Count Ratio  (25-50 keV) / (15-25 keV) = 1.40452
Count Ratio (50-100 keV) / (15-25 keV) = 0.920302
Mask shadow pattern
IMX = 3.901322941736836E-01, IMY = 6.802207809030785E-01
TIME vs. PHA plot around the trigger time
Blue+Cyan dotted lines: Time interval of the scaled map
From 0.000000 to 1.024000
TIME vs. DetID plot around the trigger time
Blue+Cyan dotted lines: Time interval of the scaled map
From 0.000000 to 1.024000
100 us light curve (15-350 keV)
Blue+Cyan dotted lines: Time interval of the scaled map
From 0.000000 to 1.024000
Spacecraft aspect plot
Bright source in the pre-burst/pre-slew/post-slew images
Pre-burst image of 15-350 keV band
Time interval of the image:
-239.496000 -6.708000

# RAcent  DECcent POSerr Theta    Phi  PeakCts   SNR AngSep     Name
#  [deg]    [deg]    ['] [deg]  [deg]                   [']
 83.6299  22.0084    0.5  42.7   31.8   9.9746  23.9    0.4	Crab
 92.9809   3.2604    3.1  53.9    8.1   2.9080   3.7 ------	UNKNOWN
223.7665  48.7589    3.1  59.3 -163.3   5.2775   3.7 ------	UNKNOWN
Pre-slew background subtracted image of 15-350 keV band
Time interval of the image:
-6.708000 18.316000

# RAcent  DECcent POSerr Theta    Phi  PeakCts   SNR AngSep     Name
#  [deg]    [deg]    ['] [deg]  [deg]                   [']
 83.4978  22.1172   21.6  42.6   32.0  -0.0649  -0.5    9.7	Crab
 72.2379  26.8873    2.0  46.0   47.5   1.3455   5.7 ------	UNKNOWN
253.1212  74.9958    2.2  50.4  162.8   0.9108   5.2 ------	UNKNOWN
243.8160  80.3096    1.9  45.4  159.4   0.7854   6.1 ------	UNKNOWN
124.7541  29.3537    2.8  20.7  -32.3   0.2211   4.1 ------	UNKNOWN
151.4314  40.8115    2.5  20.7 -106.3   0.3021   4.7 ------	UNKNOWN
114.0465  -8.3612    2.2  59.1  -20.1   1.7338   5.4 ------	UNKNOWN
142.0319  14.5706    0.6  38.1  -60.2   2.5007  20.7 ------	UNKNOWN
Post-slew image of 15-350 keV band
Time interval of the image:
274.204600 815.404610

# RAcent  DECcent POSerr Theta    Phi  PeakCts   SNR AngSep     Name
#  [deg]    [deg]    ['] [deg]  [deg]                   [']
254.3645  35.5112    8.6  44.8   50.6  -2.0026  -1.3   11.1	Her X-1
249.5644  29.3340    3.2  40.1   59.0   3.8592   3.6 ------	UNKNOWN
257.9235  50.6884    4.0  50.9   31.4   5.2275   2.9 ------	UNKNOWN
239.2438  51.9061    2.4  41.2   22.1   2.8450   4.8 ------	UNKNOWN
202.5725 -27.7441    3.0  47.3  176.7   2.4944   3.9 ------	UNKNOWN
206.2435  -5.8254    2.9  25.3  172.8   1.3923   3.9 ------	UNKNOWN
183.4243 -35.2964    2.2  59.0 -166.1  10.5755   5.3 ------	UNKNOWN
175.6977 -29.8293    3.3  57.6 -156.3   8.0730   3.5 ------	UNKNOWN
Plot creation:
Sat May 30 12:43:25 EDT 2015