Special notes of this burst
Image
Pre-slew 15.0-350.0 keV image (Event data)

#   RAcent    DECcent   POSerr    Theta     Phi              Peak Cts       SNR   Name
  238.0212    27.6076   0.0066    16.8108   122.4311         0.2810077     28.980 TRIG_00611599

Foreground time interval of the image:
 -0.012   0.348 (delta_t =   0.360 [sec])
Background time interval of the image:
-153.999  -0.012 (delta_t = 153.987 [sec])
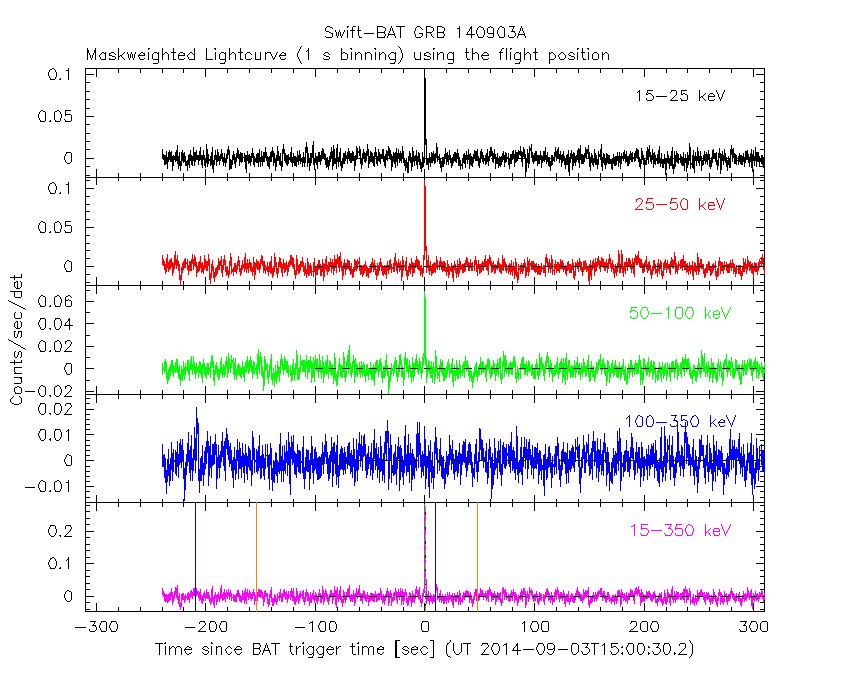
Lightcurves
Notes:
- 1) The mask-weighted light curves are using the flight position.
- 2) Multiple plots of different time binning/intervals are shown to cover all scenarios of short/long GRBs, rate/image triggers, and real/false positives.
- 3) For all the mask-weighted lightcurves, the y-axis units are counts/sec/det where a det is 0.4 x 0.4 = 0.16 sq cm.
- 4) The verticle lines correspond to following: green dotted lines are T50 interval, black dotted lines are T90 interval, blue solid line(s) is a spacecraft slew start time, and orange solid line(s) is a spacecraft slew end time.
- 5) Time of each bin is in the middle of the bin.
1 s binning
From T0-310 s to T0+310 s
From T100_start - 20 s to T100_end + 30 s

Full time interval

64 ms binning
Full time interval

From T100_start to T100_end

From T0-5 sec to T0+5 sec

16 ms binning
From T100_start-5 s to T100_start+5 s

8 ms binning
From T100_start-3 s to T100_start+3 s

2 ms binning
From T100_start-1 s to T100_start+1 s

SN=5 or 10 sec. binning (whichever binning is satisfied first)

SN=5 or 10 sec. binning (T < 200 sec)

Quad-rate summed light curves (from T0-300s to T0+1000s)

Spectral Evolution

Spectra
Notes:
- 1) The fitting includes the systematic errors.
- 2) When the burst includes telescope slew time periods, the fitting uses an average response file made from multiple 5-s response files through out the slew time plus single time preiod for the non-slew times, and weighted by the total counts in the corresponding time period using addrmf. An average response file is needed becuase a spectral fit using the pre-slew DRM will introduce some errors in both a spectral shape and a normalization if the PHA file contains a lot of the slew/post-slew time interval.
- 3) For fits to more complicated models (e.g. a power-law over a cutoff power-law), the BAT team has decided to require a chi-square improvement of more than 6 for each extra dof.
Time averaged spectrum fit using the average DRM
Power-law model

Time interval is from   -0.012 sec. to    0.348 sec.

Spectral model in power-law:
------------------------------------------------------------
Parameters  : value       lower 90%   higher 90%
Photon index: 1.98685     ( -0.118378   0.121846 )
Norm@50keV  : 4.06275E-02    ( -0.00321186   0.0031712 )
------------------------------------------------------------
#Fit statistic : Chi-Squared =          76.07 using 59 PHA bins.
# Reduced chi-squared =          1.335 for     57 degrees of freedom
# Null hypothesis probability =   4.651458e-02

Photon flux (15-150 keV)    in 0.36 sec: 6.05759 ( -0.407357  0.407639 ) ph/cm2/s
Energy fluence (15-150 keV)             : 1.34789e-07 ( -1.01508e-08  1.02384e-08 ) ergs/cm2
Cutoff power-law model

Time interval is from   -0.012 sec. to    0.348 sec.
Spectral model in the cutoff power-law:
------------------------------------------------------------
Parameters  : value       lower 90%   higher 90%
Photon index: 1.36140     ( -0.550402   0.483186 )
Epeak [keV] : 44.1688      ( -12.0153 16.1955 )
Norm@50keV  : 9.15838E-02    ( -0.0419691   0.0952279 )
------------------------------------------------------------
#Fit statistic : Chi-Squared =          71.01 using 59 PHA bins.
# Reduced chi-squared =          1.268 for     56 degrees of freedom
# Null hypothesis probability =   8.538761e-02

Photon flux (15-150 keV)    in 0.36 sec: 5.92004 ( -0.41985  0.42008 ) ph/cm2/s
Energy fluence (15-150 keV)             : 1.27848e-07 ( -1.1232e-08  1.1434e-08 ) ergs/cm2
Band function

Time interval is from   -0.012 sec. to    0.348 sec.

Spectral model in the Band function:
------------------------------------------------------------
Parameters  : value       lower 90%   higher 90%
alpha       : -1.36127   ( -0.483837   0.539802 )
beta        : -10.0000    ( 10   20 )
Epeak [keV] : 44.1613      ( -11.9865 16.1941 )
Norm@50keV   : 9.15857E-02    ( -0.0434802   0.0952863 )
------------------------------------------------------------
#Fit statistic : Chi-Squared =          71.01 using 59 PHA bins.
# Reduced chi-squared =          1.291 for     55 degrees of freedom
# Null hypothesis probability =   7.198335e-02

Photon flux (15-150 keV)    in 0.36 sec:  (    ) ph/cm2/s
Energy fluence (15-150 keV)             : 1.29457e-07 ( -1.29455e-07  -1.07262e-08 ) ergs/cm2
Single BB

Spectral model blackbody:
------------------------------------------------------------
Parameters  : value    Lower 90%  Upper 90%
kT [keV]    : 10.1993  (  )
R^2/D10^2   : 2.62156  (   )
(R is the radius in km and D10 is the distance to the source in units of 10 kpc)
------------------------------------------------------------
#Fit statistic : Chi-Squared =         114.72 using 59 PHA bins.
# Reduced chi-squared =         2.0126 for     57 degrees of freedom
# Null hypothesis probability =   9.208899e-06

Energy  Fluence     90% Error
[keV]   [erg/cm2]   [erg/cm2]
15- 25  2.012e-08   2.293e-09
25- 50  5.143e-08   3.726e-09
50-150  2.841e-08   4.532e-09
15-150  9.997e-08   8.874e-09
Thermal bremsstrahlung (OTTB)

Spectral model: thermal bremsstrahlung
------------------------------------------------------------
Parameters  : value         Lower 90%    Upper 90%
kT [keV]    : 69.5589       (-12.6623      17.3367)
Norm        : 29.8839       (-3.15625     3.5843)
------------------------------------------------------------
#Fit statistic : Chi-Squared =          70.96 using 59 PHA bins.
# Reduced chi-squared =          1.245 for     57 degrees of freedom
# Null hypothesis probability =   1.011409e-01

Energy  Fluence     90% Error
[keV]   [erg/cm2]   [erg/cm2]
15- 25  2.758e-08   2.581e-09
25- 50  4.381e-08   3.078e-09
50-150  5.601e-08   9.090e-09
15-150  1.274e-07   1.004e-08
Double BB

Spectral model: bbodyrad<1> + bbodyrad<2>
------------------------------------------------------------
Parameters  : value         Lower 90%    Upper 90%
kT1 [keV]   : 6.56295        (-1.03475      1.04426)
R1^2/D10^2  : 10.4176        (-4.15578      8.53968)
kT2 [keV]   : 21.8737        (-4.53591      7.26858)
R2^2/D10^2  : 9.02139E-02    (-0.0602866   0.146172)
------------------------------------------------------------
#Fit statistic : Chi-Squared =          67.57 using 59 PHA bins.
# Reduced chi-squared =          1.229 for     55 degrees of freedom
# Null hypothesis probability =   1.188887e-01

Energy  Fluence     90% Error
[keV]   [erg/cm2]   [erg/cm2]
15- 25  2.703e-08   5.096e-09
25- 50  4.429e-08   9.704e-09
50-150  5.810e-08   2.768e-08
15-150  1.294e-07   3.620e-08
Peak spectrum fit
Power-law model

Time interval is from   -0.330 sec. to    0.670 sec.

Spectral model in power-law:
------------------------------------------------------------
Parameters  : value       lower 90%   higher 90%
Photon index: 2.02877     ( -0.13888   0.144344 )
Norm@50keV  : 1.64052E-02    ( -0.00153568   0.00150967 )
------------------------------------------------------------
#Fit statistic : Chi-Squared =          51.79 using 59 PHA bins.
# Reduced chi-squared =         0.9085 for     57 degrees of freedom
# Null hypothesis probability =   6.704179e-01

Photon flux (15-150 keV)    in 1 sec: 2.49391 ( -0.188044  0.188149 ) ph/cm2/s
Energy fluence (15-150 keV)             : 1.51544e-07 ( -1.31908e-08  1.33512e-08 ) ergs/cm2
Cutoff power-law model

Time interval is from   -0.330 sec. to    0.670 sec.
Spectral model in the cutoff power-law:
------------------------------------------------------------
Parameters  : value       lower 90%   higher 90%
Photon index: 1.56552     ( -0.602403   0.526942 )
Epeak [keV] : 40.2503      (   )
Norm@50keV  : 3.00438E-02    (     )
------------------------------------------------------------
#Fit statistic : Chi-Squared =          49.55 using 59 PHA bins.
# Reduced chi-squared =         0.8847 for     56 degrees of freedom
# Null hypothesis probability =   7.161151e-01

Photon flux (15-150 keV)    in 1 sec: 2.44858 ( -0.19446  0.19455 ) ph/cm2/s
Energy fluence (15-150 keV)             : 1.45364e-07 ( -1.4639e-08  1.4987e-08 ) ergs/cm2
Band function

Time interval is from   -0.330 sec. to    0.670 sec.

Spectral model in the Band function:
------------------------------------------------------------
Parameters  : value       lower 90%   higher 90%
alpha       : -1.56593   ( 1.79217   0.90568 )
beta        : -10.0000    ( 10   7.10543e-15 )
Epeak [keV] : 40.2412      ( -22.4142 -40.2412 )
Norm@50keV   : 3.00221E-02    ( -0.0137728   0.0356289 )
------------------------------------------------------------
#Fit statistic : Chi-Squared =          49.55 using 59 PHA bins.
# Reduced chi-squared =         0.9008 for     55 degrees of freedom
# Null hypothesis probability =   6.823032e-01

Photon flux (15-150 keV)    in 1 sec:  (    ) ph/cm2/s
Energy fluence (15-150 keV)             : 1.45276e-07 ( -1.45269e-07  -1.4652e-08 ) ergs/cm2
Single BB

Spectral model blackbody:
------------------------------------------------------------
Parameters  : value    Lower 90%  Upper 90%
kT [keV]    : 9.91449  (-0.912784  1.01512)
R^2/D10^2   : 1.17937  (-0.370736   0.536527)
(R is the radius in km and D10 is the distance to the source in units of 10 kpc)
------------------------------------------------------------
#Fit statistic : Chi-Squared =          90.33 using 59 PHA bins.
# Reduced chi-squared =          1.585 for     57 degrees of freedom
# Null hypothesis probability =   3.246840e-03

Energy  Fluence     90% Error
[keV]   [erg/cm2]   [erg/cm2]
15- 25  2.354e-08   3.085e-09
25- 50  5.782e-08   5.135e-09
50-150  2.943e-08   5.995e-09
15-150  1.108e-07   1.029e-08
Thermal bremsstrahlung (OTTB)

Spectral model: thermal bremsstrahlung
------------------------------------------------------------
Parameters  : value         Lower 90%    Upper 90%
kT [keV]    : 65.4783       (-13.5536      18.9767)
Norm        : 12.5347       (-1.52249     1.7161)
------------------------------------------------------------
#Fit statistic : Chi-Squared =          50.06 using 59 PHA bins.
# Reduced chi-squared =         0.8782 for     57 degrees of freedom
# Null hypothesis probability =   7.308826e-01

Energy  Fluence     90% Error
[keV]   [erg/cm2]   [erg/cm2]
15- 25  3.191e-08   3.385e-09
25- 50  4.983e-08   3.655e-09
50-150  6.083e-08   1.106e-08
15-150  1.426e-07   1.325e-08
Double BB

Spectral model: bbodyrad<1> + bbodyrad<2>
------------------------------------------------------------
Parameters  : value         Lower 90%    Upper 90%
kT1 [keV]   : 5.73741        (-1.09555      1.15461)
R1^2/D10^2  : 6.95500        (-3.37467      8.66309)
kT2 [keV]   : 19.6088        (-3.9429      6.15633)
R2^2/D10^2  : 5.98357E-02    (-0.0395369   0.0924279)
------------------------------------------------------------
#Fit statistic : Chi-Squared =          47.93 using 59 PHA bins.
# Reduced chi-squared =         0.8715 for     55 degrees of freedom
# Null hypothesis probability =   7.392068e-01

Energy  Fluence     90% Error
[keV]   [erg/cm2]   [erg/cm2]
15- 25  3.291e-08   1.049e-08
25- 50  4.766e-08   1.215e-08
50-150  6.439e-08   3.330e-08
15-150  1.450e-07   4.558e-08
Pre-slew spectrum (Pre-slew PHA with pre-slew DRM)
Power-law model

Spectral model in power-law:
------------------------------------------------------------
Parameters  : value       lower 90%   higher 90%
Photon index: 1.98685     ( -0.118378   0.121846 )
Norm@50keV  : 4.06275E-02    ( -0.00321186   0.0031712 )
------------------------------------------------------------
#Fit statistic : Chi-Squared =          76.07 using 59 PHA bins.
# Reduced chi-squared =          1.335 for     57 degrees of freedom
# Null hypothesis probability =   4.651458e-02

Photon flux (15-150 keV)    in 0.36 sec: 6.05759 ( -0.407357  0.407639 ) ph/cm2/s
Energy fluence (15-150 keV)             : 1.34789e-07 ( -1.01508e-08  1.02384e-08 ) ergs/cm2
Cutoff power-law model

Spectral model in the cutoff power-law:
------------------------------------------------------------
Parameters  : value       lower 90%   higher 90%
Photon index: 1.36140     ( -0.550402   0.483186 )
Epeak [keV] : 44.1688      ( -12.0153 16.1955 )
Norm@50keV  : 9.15838E-02    ( -0.0419691   0.0952279 )
------------------------------------------------------------
#Fit statistic : Chi-Squared =          71.01 using 59 PHA bins.
# Reduced chi-squared =          1.268 for     56 degrees of freedom
# Null hypothesis probability =   8.538761e-02

Photon flux (15-150 keV)    in 0.36 sec: 5.92004 ( -0.41985  0.42008 ) ph/cm2/s
Energy fluence (15-150 keV)             : 1.27848e-07 ( -1.1232e-08  1.1434e-08 ) ergs/cm2
Band function

Spectral model in the Band function:
------------------------------------------------------------
Parameters  : value       lower 90%   higher 90%
alpha       : -1.36127   ( -0.483837   0.539802 )
beta        : -10.0000    ( 10   7.10543e-15 )
Epeak [keV] : 44.1613      ( -11.9865 16.1941 )
Norm@50keV   : 9.15857E-02    ( -0.0434802   0.0952863 )
------------------------------------------------------------
#Fit statistic : Chi-Squared =          71.01 using 59 PHA bins.
# Reduced chi-squared =          1.291 for     55 degrees of freedom
# Null hypothesis probability =   7.198335e-02

Photon flux (15-150 keV)    in 0.36 sec:  (    ) ph/cm2/s
Energy fluence (15-150 keV)             : 1.29457e-07 ( -1.29455e-07  -1.07262e-08 ) ergs/cm2
S(25-50 keV) vs. S(50-100 keV) plot

S(25-50 keV)  = 4.04e-08
S(50-100 keV) = 4.08e-08
T90 vs. Hardness ratio plot

T90                                   = 0.295999944210052 sec.
Hardness ratio (energy fluence ratio) = 1.0099
Color vs. Color plot
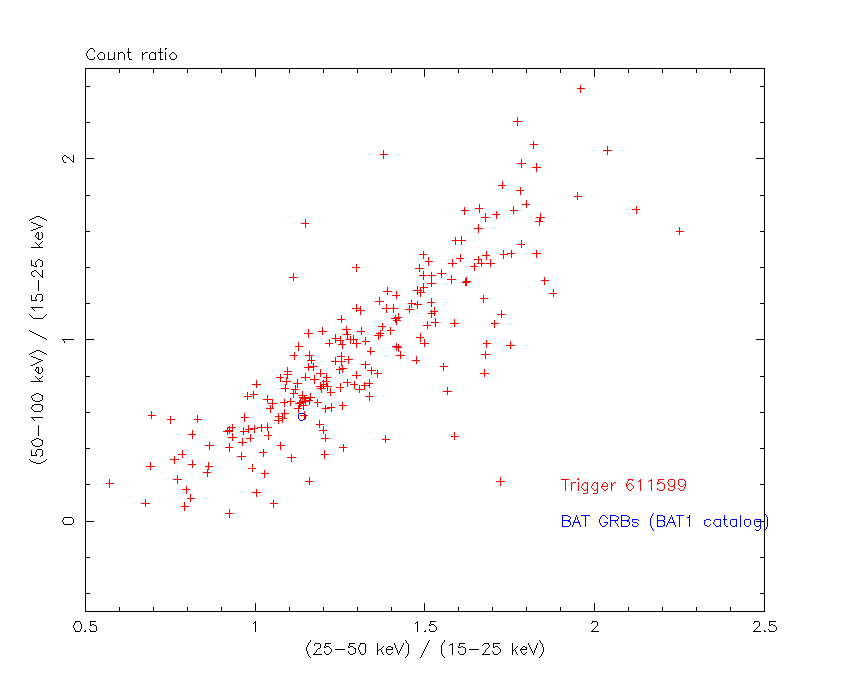
Count Ratio  (25-50 keV) / (15-25 keV) = 1.13752
Count Ratio (50-100 keV) / (15-25 keV) = 0.57652
Mask shadow pattern

IMX = -1.620241102932698E-01, IMY = -2.550032619289736E-01
TIME vs. PHA plot around the trigger time

TIME vs. DetID plot around the trigger time

100 us light curve (15-350 keV)

Spacecraft aspect plot

Bright source in the pre-burst/pre-slew/post-slew images
Pre-burst image of 15-350 keV band
Time interval of the image:
-153.999400 -0.012000

# RAcent  DECcent POSerr Theta    Phi  PeakCts   SNR AngSep     Name
#  [deg]    [deg]    ['] [deg]  [deg]                   [']
254.6661  35.4357    5.2  27.7   89.4  -0.4314  -2.2   11.6	Her X-1
272.9514  43.5229    2.8  40.6   71.6   2.3390   4.1 ------	UNKNOWN
228.3819  19.1458    2.6  17.7  164.4   0.5497   4.4 ------	UNKNOWN
Pre-slew background subtracted image of 15-350 keV band
Time interval of the image:
-0.012000 0.348000

# RAcent  DECcent POSerr Theta    Phi  PeakCts   SNR AngSep     Name
#  [deg]    [deg]    ['] [deg]  [deg]                   [']
254.5994  35.1856    6.8  27.7   90.0  -0.0265  -1.7   11.7	Her X-1
238.0212  27.6076    0.4  16.8  122.4   0.2810  29.0 ------	UNKNOWN
204.6608  19.0780    3.0  21.6 -125.8   0.0370   3.9 ------	UNKNOWN
Post-slew image of 15-350 keV band
Time interval of the image:
47.800600 962.368400

# RAcent  DECcent POSerr Theta    Phi  PeakCts   SNR AngSep     Name
#  [deg]    [deg]    ['] [deg]  [deg]                   [']
244.9742 -15.6414    0.4  43.8  170.5  28.4158  25.9    0.3	Sco X-1
254.3876  35.4999   32.8  16.0   56.5   0.1807   0.4   10.0	Her X-1
268.4907  -1.4930  789.9  41.3  130.0   0.0270   0.0    7.7	SW J1753.5-0127
244.0637 -28.9237    2.5  56.8  173.9  13.5415   4.5 ------	UNKNOWN
248.5759  38.1075    3.4  13.7   37.6   1.9017   3.4 ------	UNKNOWN
184.8288  65.4243    3.6  50.1  -25.5   3.7609   3.2 ------	UNKNOWN
205.5212  19.6617    3.9  30.7  -97.6   2.4357   3.0 ------	UNKNOWN
208.4495   1.6468    3.3  38.4 -127.2   3.3519   3.5 ------	UNKNOWN
202.6122  -6.0754    3.5  48.0 -129.0   9.4978   3.3 ------	UNKNOWN
Plot creation:
Sat May 30 12:41:47 EDT 2015