Special notes of this burst
Image
Pre-slew 15.0-350.0 keV image (Event data)
#   RAcent    DECcent   POSerr    Theta     Phi              Peak Cts       SNR   Name
   48.1308    46.5970   0.0089    36.8949  -161.2651         3.8271016     21.549 TRIG_00611933

Foreground time interval of the image:
-95.344  12.757 (delta_t = 108.101 [sec])
Background time interval of the image:
-239.344 -95.344 (delta_t = 144.000 [sec])
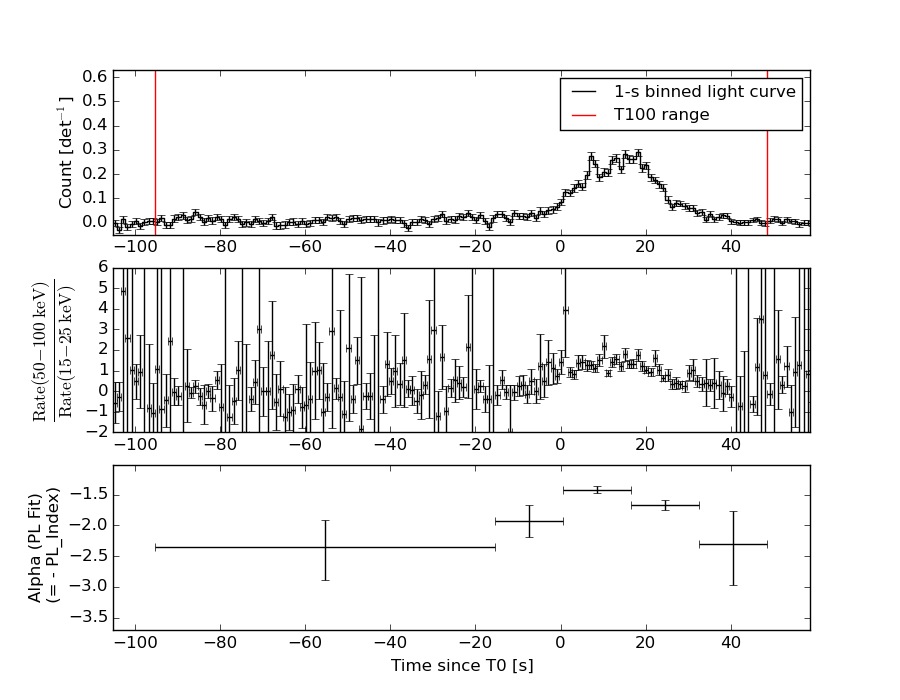
Lightcurves
Notes:
- 1) The mask-weighted light curves are using the flight position.
- 2) Multiple plots of different time binning/intervals are shown to cover all scenarios of short/long GRBs, rate/image triggers, and real/false positives.
- 3) For all the mask-weighted lightcurves, the y-axis units are counts/sec/det where a det is 0.4 x 0.4 = 0.16 sq cm.
- 4) The verticle lines correspond to following: green dotted lines are T50 interval, black dotted lines are T90 interval, blue solid line(s) is a spacecraft slew start time, and orange solid line(s) is a spacecraft slew end time.
- 5) Time of each bin is in the middle of the bin.
1 s binning
From T0-310 s to T0+310 s
From T100_start - 20 s to T100_end + 30 s
Full time interval
64 ms binning
Full time interval

From T100_start to T100_end
From T0-5 sec to T0+5 sec
16 ms binning
From T100_start-5 s to T100_start+5 s
Blue+Cyan dotted lines: Time interval of the scaled map
From 0.000000 to 1.024000
8 ms binning
From T100_start-3 s to T100_start+3 s
Blue+Cyan dotted lines: Time interval of the scaled map
From 0.000000 to 1.024000
2 ms binning
From T100_start-1 s to T100_start+1 s
Blue+Cyan dotted lines: Time interval of the scaled map
From 0.000000 to 1.024000
SN=5 or 10 sec. binning (whichever binning is satisfied first)
SN=5 or 10 sec. binning (T < 200 sec)
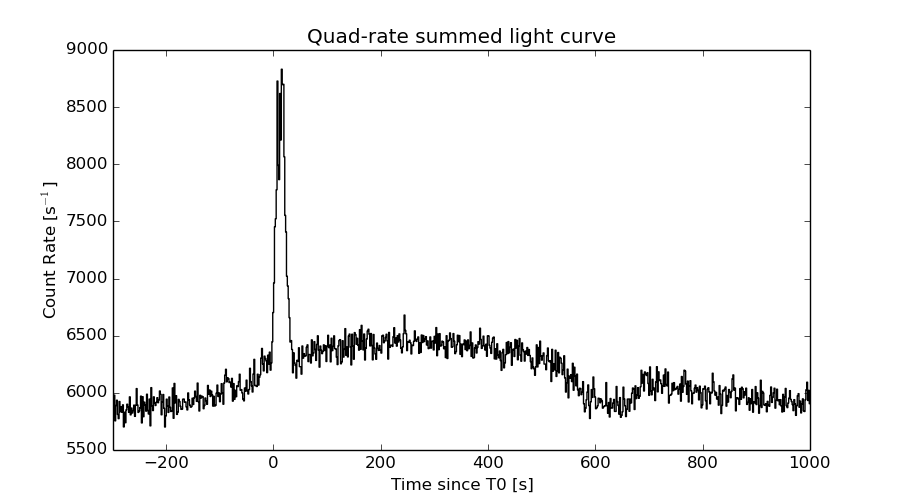
Quad-rate summed light curves (from T0-300s to T0+1000s)
Spectral Evolution
Spectra
Notes:
- 1) The fitting includes the systematic errors.
- 2) When the burst includes telescope slew time periods, the fitting uses an average response file made from multiple 5-s response files through out the slew time plus single time preiod for the non-slew times, and weighted by the total counts in the corresponding time period using addrmf. An average response file is needed becuase a spectral fit using the pre-slew DRM will introduce some errors in both a spectral shape and a normalization if the PHA file contains a lot of the slew/post-slew time interval.
- 3) For fits to more complicated models (e.g. a power-law over a cutoff power-law), the BAT team has decided to require a chi-square improvement of more than 6 for each extra dof.
Time averaged spectrum fit using the average DRM
Power-law model
Time interval is from  -95.344 sec. to   48.656 sec.

Spectral model in power-law:
------------------------------------------------------------
Parameters  : value       lower 90%   higher 90%
Photon index: 1.65033     ( -0.0699237   0.0702703 )
Norm@50keV  : 3.37030E-03    ( -0.000129108   0.000128759 )
------------------------------------------------------------
#Fit statistic : Chi-Squared =          39.05 using 59 PHA bins.
# Reduced chi-squared =         0.6851 for     57 degrees of freedom
# Null hypothesis probability =   9.667498e-01

Photon flux (15-150 keV)    in 144 sec: 0.440126 ( -0.017713  0.0177614 ) ph/cm2/s
Energy fluence (15-150 keV)             : 4.51354e-06 ( -1.81627e-07  1.82125e-07 ) ergs/cm2
Cutoff power-law model
Time interval is from  -95.344 sec. to   48.656 sec.
Spectral model in the cutoff power-law:
------------------------------------------------------------
Parameters  : value       lower 90%   higher 90%
Photon index: 1.42189     ( -0.29007   0.255303 )
Epeak [keV] : 129.598      ( -45.7596 -129.6 )
Norm@50keV  : 4.36152E-03    ( -0.00104961   0.00164133 )
------------------------------------------------------------
#Fit statistic : Chi-Squared =          37.01 using 59 PHA bins.
# Reduced chi-squared =         0.6610 for     56 degrees of freedom
# Null hypothesis probability =   9.764055e-01

Photon flux (15-150 keV)    in 144 sec: 0.433517 ( -0.019265  0.019299 ) ph/cm2/s
Energy fluence (15-150 keV)             : 4.4371e-06 ( -2.05618e-07  2.04264e-07 ) ergs/cm2
Band function
Time interval is from  -95.344 sec. to   48.656 sec.

Spectral model in the Band function:
------------------------------------------------------------
Parameters  : value       lower 90%   higher 90%
alpha       : -1.21996   ( 1.17103   1.17103 )
beta        : -1.77821    ( 1.77683   0.160613 )
Epeak [keV] : 78.8426      ( -74.7594 237.408 )
Norm@50keV   : 5.75765E-03    ( -0.00240418   226.368 )
------------------------------------------------------------
#Fit statistic : Chi-Squared =          36.39 using 59 PHA bins.
# Reduced chi-squared =         0.6617 for     55 degrees of freedom
# Null hypothesis probability =   9.750367e-01

Photon flux (15-150 keV)    in 144 sec:  (    ) ph/cm2/s
Energy fluence (15-150 keV)             : 4.43089e-06 ( -4.42989e-06  -2.03861e-07 ) ergs/cm2
Single BB
Spectral model blackbody:
------------------------------------------------------------
Parameters  : value    Lower 90%  Upper 90%
kT [keV]    : 14.4889  (  )
R^2/D10^2   : 5.28295E-02  (   )
(R is the radius in km and D10 is the distance to the source in units of 10 kpc)
------------------------------------------------------------
#Fit statistic : Chi-Squared =         189.66 using 59 PHA bins.
# Reduced chi-squared =         3.3274 for     57 degrees of freedom
# Null hypothesis probability =   3.711598e-16

Energy  Fluence     90% Error
[keV]   [erg/cm2]   [erg/cm2]
15- 25  3.361e-07   2.563e-08
25- 50  1.292e-06   5.789e-08
50-150  1.817e-06   1.411e-07
15-150  3.446e-06   1.440e-07
Thermal bremsstrahlung (OTTB)
Spectral model: thermal bremsstrahlung
------------------------------------------------------------
Parameters  : value         Lower 90%    Upper 90%
kT [keV]    : 160.996       (-28.2563      -161.476)
Norm        : 1.78377       (-0.0810892     0.0882346)
------------------------------------------------------------
#Fit statistic : Chi-Squared =          37.69 using 59 PHA bins.
# Reduced chi-squared =         0.6613 for     57 degrees of freedom
# Null hypothesis probability =   9.773082e-01

Energy  Fluence     90% Error
[keV]   [erg/cm2]   [erg/cm2]
15- 25  6.555e-07   4.212e-08
25- 50  1.227e-06   1.016e-07
50-150  2.492e-06   6.614e-07
15-150  4.375e-06   7.661e-07
Double BB
Spectral model: bbodyrad<1> + bbodyrad<2>
------------------------------------------------------------
Parameters  : value         Lower 90%    Upper 90%
kT1 [keV]   : 6.95751        (-1.03045      1.14047)
R1^2/D10^2  : 0.484920        (-0.191012      0.372927)
kT2 [keV]   : 25.1457        (-3.3882      5.21848)
R2^2/D10^2  : 5.67107E-03    (-0.00283715   0.00423343)
------------------------------------------------------------
#Fit statistic : Chi-Squared =          44.64 using 59 PHA bins.
# Reduced chi-squared =         0.8117 for     55 degrees of freedom
# Null hypothesis probability =   8.395316e-01

Energy  Fluence     90% Error
[keV]   [erg/cm2]   [erg/cm2]
15- 25  6.290e-07   8.035e-08
25- 50  1.239e-06   1.129e-07
50-150  2.502e-06   3.334e-07
15-150  4.370e-06   4.874e-07
Peak spectrum fit
Power-law model

Time interval is from    8.156 sec. to    9.156 sec.

Spectral model in power-law:
------------------------------------------------------------
Parameters  : value       lower 90%   higher 90%
Photon index: 1.32474     ( -0.212822   0.212526 )
Norm@50keV  : 1.30955E-02    ( -0.00166156   0.00165896 )
------------------------------------------------------------
#Fit statistic : Chi-Squared =          59.41 using 59 PHA bins.
# Reduced chi-squared =          1.042 for     57 degrees of freedom
# Null hypothesis probability =   3.880181e-01

Photon flux (15-150 keV)    in 1 sec: 1.56967 ( -0.204033  0.204534 ) ph/cm2/s
Energy fluence (15-150 keV)             : 1.28652e-07 ( -1.78718e-08  1.80082e-08 ) ergs/cm2
Cutoff power-law model

Time interval is from    8.156 sec. to    9.156 sec.
Spectral model in the cutoff power-law:
------------------------------------------------------------
Parameters  : value       lower 90%   higher 90%
Photon index: 0.538887     ( -1.07448   0.852047 )
Epeak [keV] : 100.152      ( -31.0664 -100.152 )
Norm@50keV  : 3.08472E-02    ( -0.0182766   0.0634645 )
------------------------------------------------------------
#Fit statistic : Chi-Squared =          57.02 using 59 PHA bins.
# Reduced chi-squared =          1.018 for     56 degrees of freedom
# Null hypothesis probability =   4.371034e-01

Photon flux (15-150 keV)    in 1 sec: 1.51998 ( -0.2127  0.212 ) ph/cm2/s
Energy fluence (15-150 keV)             : 1.23625e-07 ( -1.8977e-08  1.9054e-08 ) ergs/cm2
Band function
Time interval is from    8.156 sec. to    9.156 sec.

Spectral model in the Band function:
------------------------------------------------------------
Parameters  : value       lower 90%   higher 90%
alpha       : -0.540153   ( -0.614929   1.10396 )
beta        : -10.0000    ( 10   7.10543e-15 )
Epeak [keV] : 100.227      ( -25.7753 -100.227 )
Norm@50keV   : 3.08021E-02    ( -0.0182406   0.0634056 )
------------------------------------------------------------
#Fit statistic : Chi-Squared =          57.02 using 59 PHA bins.
# Reduced chi-squared =          1.037 for     55 degrees of freedom
# Null hypothesis probability =   4.000227e-01

Photon flux (15-150 keV)    in 1 sec:  (    ) ph/cm2/s
Energy fluence (15-150 keV)             : 0 ( 0  0 ) ergs/cm2
Single BB
Spectral model blackbody:
------------------------------------------------------------
Parameters  : value    Lower 90%  Upper 90%
kT [keV]    : 17.7741  (-2.52374  3.03376)
R^2/D10^2   : 0.106328  (-0.044107   0.0727316)
(R is the radius in km and D10 is the distance to the source in units of 10 kpc)
------------------------------------------------------------
#Fit statistic : Chi-Squared =          64.41 using 59 PHA bins.
# Reduced chi-squared =          1.130 for     57 degrees of freedom
# Null hypothesis probability =   2.332940e-01

Energy  Fluence     90% Error
[keV]   [erg/cm2]   [erg/cm2]
15- 25  6.753e-09   1.717e-09
25- 50  3.093e-08   6.245e-09
50-150  7.070e-08   1.644e-08
15-150  1.084e-07   2.056e-08
Thermal bremsstrahlung (OTTB)
Spectral model: thermal bremsstrahlung
------------------------------------------------------------
Parameters  : value         Lower 90%    Upper 90%
kT [keV]    : 200.000       (      )
Norm        : 6.53313       (-0.830592     0.830508)
------------------------------------------------------------
#Fit statistic : Chi-Squared =          61.39 using 59 PHA bins.
# Reduced chi-squared =          1.077 for     57 degrees of freedom
# Null hypothesis probability =   3.215870e-01

Energy  Fluence     90% Error
[keV]   [erg/cm2]   [erg/cm2]
15- 25  1.627e-08   9.130e-09
25- 50  3.131e-08   1.723e-08
50-150  6.866e-08   3.780e-08
15-150  1.162e-07   6.380e-08
Double BB
Spectral model: bbodyrad<1> + bbodyrad<2>
------------------------------------------------------------
Parameters  : value         Lower 90%    Upper 90%
kT1 [keV]   : 5.72016        (-3.33812      5.57977)
R1^2/D10^2  : 2.18263        (-1.92311      145.824)
kT2 [keV]   : 22.3249        (-4.62532      13.6804)
R2^2/D10^2  : 4.36060E-02    (-0.036833   0.0582166)
------------------------------------------------------------
#Fit statistic : Chi-Squared =          56.50 using 59 PHA bins.
# Reduced chi-squared =          1.027 for     55 degrees of freedom
# Null hypothesis probability =   4.185274e-01

Energy  Fluence     90% Error
[keV]   [erg/cm2]   [erg/cm2]
15- 25  1.283e-08   7.109e-09
25- 50  2.923e-08   1.430e-08
50-150  7.995e-08   4.145e-08
15-150  1.220e-07   5.716e-08
Pre-slew spectrum (Pre-slew PHA with pre-slew DRM)
Power-law model
Spectral model in power-law:
------------------------------------------------------------
Parameters  : value       lower 90%   higher 90%
Photon index: 1.66635     ( -0.110676   0.111906 )
Norm@50keV  : 2.30099E-03    ( -0.000145756   0.000144916 )
------------------------------------------------------------
#Fit statistic : Chi-Squared =          35.04 using 59 PHA bins.
# Reduced chi-squared =         0.6147 for     57 degrees of freedom
# Null hypothesis probability =   9.903129e-01

Photon flux (15-150 keV)    in 108.1 sec: 0.302092 ( -0.0188956  0.0189467 ) ph/cm2/s
Energy fluence (15-150 keV)             : 2.30969e-06 ( -1.5448e-07  1.5537e-07 ) ergs/cm2
Cutoff power-law model
Spectral model in the cutoff power-law:
------------------------------------------------------------
Parameters  : value       lower 90%   higher 90%
Photon index: 1.59871     ( -0.439921   0.446143 )
Epeak [keV] : 292.995      ( -293 -293 )
Norm@50keV  : 2.49164E-03    ( -0.00058157   0.0016325 )
------------------------------------------------------------
#Fit statistic : Chi-Squared =          34.96 using 59 PHA bins.
# Reduced chi-squared =         0.6243 for     56 degrees of freedom
# Null hypothesis probability =   9.876592e-01

Photon flux (15-150 keV)    in 108.1 sec: 0.300969 ( -0.019981  0.019318 ) ph/cm2/s
Energy fluence (15-150 keV)             : 2.29826e-06 ( -1.72982e-07  1.64852e-07 ) ergs/cm2
Band function
Spectral model in the Band function:
------------------------------------------------------------
Parameters  : value       lower 90%   higher 90%
alpha       : 4.97177   ( -4.97177   -4.97177 )
beta        : -1.68607    ( -0.118299   0.115136 )
Epeak [keV] : 20.0076      ( -20.0076 4.31967 )
Norm@50keV   : 1086.96    ( -65.2317   1.7451e+06 )
------------------------------------------------------------
#Fit statistic : Chi-Squared =          34.51 using 59 PHA bins.
# Reduced chi-squared =         0.6274 for     55 degrees of freedom
# Null hypothesis probability =   9.861859e-01

Photon flux (15-150 keV)    in 108.1 sec:  (    ) ph/cm2/s
Energy fluence (15-150 keV)             : 0 ( 0  0 ) ergs/cm2
S(25-50 keV) vs. S(50-100 keV) plot
S(25-50 keV)  = 1.20e-06
S(50-100 keV) = 1.52e-06
T90 vs. Hardness ratio plot
T90                                   = 80 sec.
Hardness ratio (energy fluence ratio) = 1.26667
Color vs. Color plot
Count Ratio  (25-50 keV) / (15-25 keV) = 1.36296
Count Ratio (50-100 keV) / (15-25 keV) = 0.95927
Mask shadow pattern
IMX = -7.109073642563704E-01, IMY = 2.411111187205032E-01
TIME vs. PHA plot around the trigger time
Blue+Cyan dotted lines: Time interval of the scaled map
From 0.000000 to 1.024000
TIME vs. DetID plot around the trigger time
Blue+Cyan dotted lines: Time interval of the scaled map
From 0.000000 to 1.024000
100 us light curve (15-350 keV)
Blue+Cyan dotted lines: Time interval of the scaled map
From 0.000000 to 1.024000
Spacecraft aspect plot
Bright source in the pre-burst/pre-slew/post-slew images
Pre-burst image of 15-350 keV band
Time interval of the image:
-239.344000 -95.344000

# RAcent  DECcent POSerr Theta    Phi  PeakCts   SNR AngSep     Name
#  [deg]    [deg]    ['] [deg]  [deg]                   [']
358.7980  16.9125    2.7  40.9  113.8   2.2430   4.3 ------	UNKNOWN
 29.5743 -21.5171    3.0  33.5   28.2   0.6824   3.8 ------	UNKNOWN
 43.2811  57.4362    3.1  47.2 -168.0   1.0053   3.7 ------	UNKNOWN
 53.5895  21.6029    2.8  17.0 -123.5   0.5598   4.2 ------	UNKNOWN
 81.5929  41.9568    2.4  47.9 -128.9   3.0697   4.9 ------	UNKNOWN
Pre-slew background subtracted image of 15-350 keV band
Time interval of the image:
-95.344000 12.756600

# RAcent  DECcent POSerr Theta    Phi  PeakCts   SNR AngSep     Name
#  [deg]    [deg]    ['] [deg]  [deg]                   [']
 48.1308  46.5970    0.5  36.9 -161.3   3.8275  21.6 ------	UNKNOWN
Post-slew image of 15-350 keV band
Time interval of the image:
72.156620 519.756600

# RAcent  DECcent POSerr Theta    Phi  PeakCts   SNR AngSep     Name
#  [deg]    [deg]    ['] [deg]  [deg]                   [']
 83.6328  22.0234    0.3  37.7  -36.4  18.6209  35.7    0.5	Crab
  2.9568  27.0550    4.4  40.4  102.5   4.4690   2.6 ------	UNKNOWN
 58.9305   2.2872    2.3  45.3   10.0   3.2380   5.1 ------	UNKNOWN
337.3386  68.2832    3.8  40.7  172.8   1.8277   3.0 ------	UNKNOWN
261.7502  73.7079    2.3  57.5 -165.4   8.9627   5.1 ------	UNKNOWN
142.6123  71.0267    2.4  48.0 -128.9   7.2069   4.8 ------	UNKNOWN
Plot creation:
Sat May 30 12:39:55 EDT 2015