Click here for the BAT GCN circular template
Image
Pre-slew 15.0-350.0 keV image (Event data)

#   RAcent    DECcent   POSerr    Theta     Phi              Peak Cts       SNR   Name
  291.8017   -65.3995   0.0190    36.6060   169.2671         0.4611118     10.063 TRIG_00613775

Foreground time interval of the image:
  0.428   8.696 (delta_t =   8.268 [sec])
Background time interval of the image:
-239.968   0.428 (delta_t = 240.396 [sec])
Lightcurves
Notes:
- 1) The mask-weighted light curves are using the flight position.
- 2) Multiple plots of different time binning/intervals are shown to cover all scenarios of short/long GRBs, rate/image triggers, and real/false positives.
- 3) For all the mask-weighted lightcurves, the y-axis units are counts/sec/det where a det is 0.4 x 0.4 = 0.16 sq cm.
- 4) The verticle lines correspond to following: green dotted lines are T50 interval, black dotted lines are T90 interval, blue solid line(s) is a spacecraft slew start time, and orange solid line(s) is a spacecraft slew end time.
- 5) Time of each bin is in the middle of the bin.
1 s binning
From T0-310 s to T0+310 s

From T100_start - 20 s to T100_end + 30 s

Full time interval

64 ms binning
Full time interval

From T100_start to T100_end

From T0-5 sec to T0+5 sec

16 ms binning
From T100_start-5 s to T100_start+5 s

8 ms binning
From T100_start-3 s to T100_start+3 s

2 ms binning
From T100_start-1 s to T100_start+1 s

SN=5 or 10 sec. binning (whichever binning is satisfied first)

SN=5 or 10 sec. binning (T < 200 sec)

Quad-rate summed light curves (from T0-300s to T0+1000s)

Spectral Evolution

Spectra
Notes:
- 1) The fitting includes the systematic errors.
- 2) When the burst includes telescope slew time periods, the fitting uses an average response file made from multiple 5-s response files through out the slew time plus single time preiod for the non-slew times, and weighted by the total counts in the corresponding time period using addrmf. An average response file is needed becuase a spectral fit using the pre-slew DRM will introduce some errors in both a spectral shape and a normalization if the PHA file contains a lot of the slew/post-slew time interval.
- 3) For fits to more complicated models (e.g. a power-law over a cutoff power-law), the BAT team has decided to require a chi-square improvement of more than 6 for each extra dof.
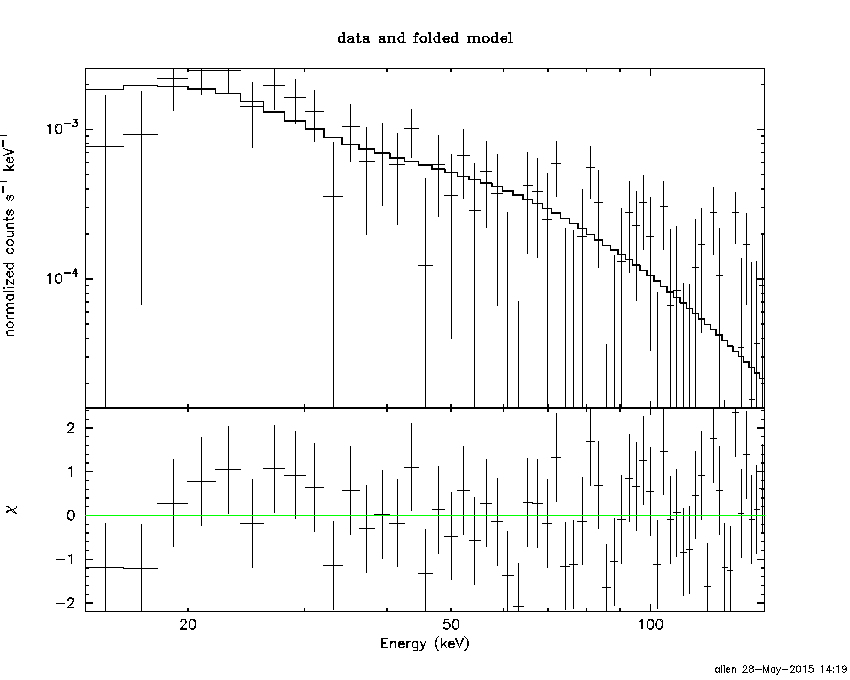
Time averaged spectrum fit using the average DRM
Power-law model

Time interval is from    0.428 sec. to    8.696 sec.

Spectral model in power-law:
------------------------------------------------------------
Parameters  : value       lower 90%   higher 90%
Photon index: 1.81761     ( -0.294043   0.302022 )
Norm@50keV  : 3.52682E-03    ( -0.000632374   0.000617518 )
------------------------------------------------------------
#Fit statistic : Chi-Squared =          56.64 using 59 PHA bins.
# Reduced chi-squared =         0.9937 for     57 degrees of freedom
# Null hypothesis probability =   4.885215e-01

Photon flux (15-150 keV)    in 8.268 sec: 0.489347 ( -0.0818898  0.082222 ) ph/cm2/s
Energy fluence (15-150 keV)             : 2.68297e-07 ( -4.79435e-08  4.86682e-08 ) ergs/cm2
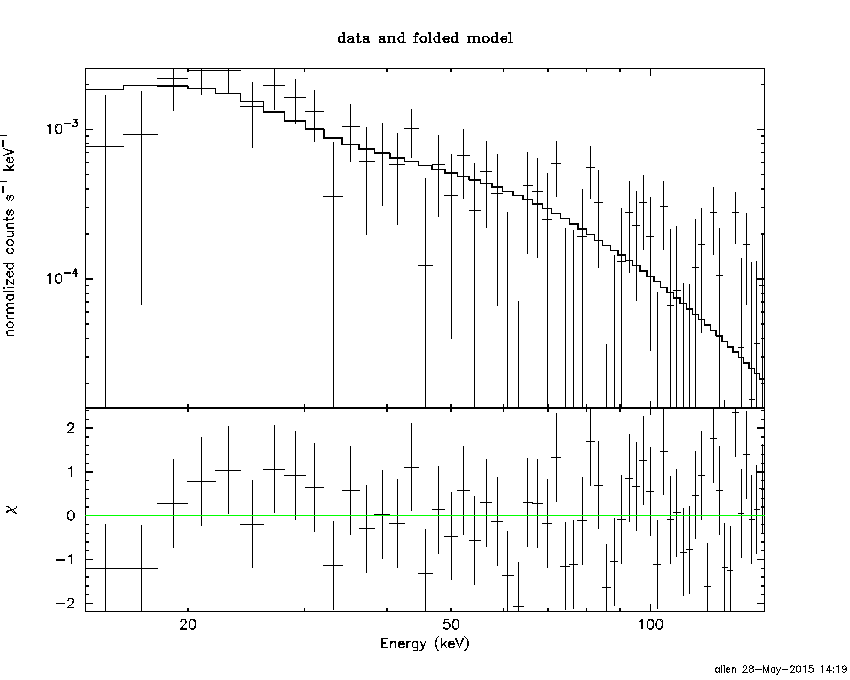
Cutoff power-law model

Time interval is from    0.428 sec. to    8.696 sec.
Spectral model in the cutoff power-law:
------------------------------------------------------------
Parameters  : value       lower 90%   higher 90%
Photon index: 1.82613     ( -0.999302   1.00416 )
Epeak [keV] : 9998.92      (   )
Norm@50keV  : 3.49364E-03    (     )
------------------------------------------------------------
#Fit statistic : Chi-Squared =          56.64 using 59 PHA bins.
# Reduced chi-squared =          1.011 for     56 degrees of freedom
# Null hypothesis probability =   4.508435e-01

Photon flux (15-150 keV)    in 8.268 sec: 0.489974 ( -0.082667  0.081393 ) ph/cm2/s
Energy fluence (15-150 keV)             : 2.6738e-07 ( -5.04662e-08  4.90607e-08 ) ergs/cm2
Band function

Time interval is from    0.428 sec. to    8.696 sec.

Spectral model in the Band function:
------------------------------------------------------------
Parameters  : value       lower 90%   higher 90%
alpha       : 4.94443   ( -14.292   -4.94443 )
beta        : -2.05407    ( -0.305508   0.377406 )
Epeak [keV] : 25.5315      ( -9.05817 5.73468 )
Norm@50keV   : 410.694    ( -65.4822   7194.86 )
------------------------------------------------------------
#Fit statistic : Chi-Squared =          53.76 using 59 PHA bins.
# Reduced chi-squared =         0.9775 for     55 degrees of freedom
# Null hypothesis probability =   5.220521e-01

Photon flux (15-150 keV)    in 8.268 sec:  (    ) ph/cm2/s
Energy fluence (15-150 keV)             : 0 ( 0  0 ) ergs/cm2
Single BB

Spectral model blackbody:
------------------------------------------------------------
Parameters  : value    Lower 90%  Upper 90%
kT [keV]    : 9.80775  (-1.84558  2.55685)
R^2/D10^2   : 0.244320  (-0.144744   0.309891)
(R is the radius in km and D10 is the distance to the source in units of 10 kpc)
------------------------------------------------------------
#Fit statistic : Chi-Squared =          68.11 using 59 PHA bins.
# Reduced chi-squared =          1.195 for     57 degrees of freedom
# Null hypothesis probability =   1.488435e-01

Energy  Fluence     90% Error
[keV]   [erg/cm2]   [erg/cm2]
15- 25  3.930e-08   1.296e-08
25- 50  9.504e-08   2.548e-08
50-150  4.688e-08   2.104e-08
15-150  1.812e-07   5.101e-08
Thermal bremsstrahlung (OTTB)

Spectral model: thermal bremsstrahlung
------------------------------------------------------------
Parameters  : value         Lower 90%    Upper 90%
kT [keV]    : 99.4244       (-44.761      -99.4391)
Norm        : 2.14658       (-0.474692     0.69171)
------------------------------------------------------------
#Fit statistic : Chi-Squared =          57.69 using 59 PHA bins.
# Reduced chi-squared =          1.012 for     57 degrees of freedom
# Null hypothesis probability =   4.494835e-01

Energy  Fluence     90% Error
[keV]   [erg/cm2]   [erg/cm2]
15- 25  4.639e-08   9.938e-09
25- 50  8.012e-08   1.831e-08
50-150  1.294e-07   7.362e-08
15-150  2.559e-07   9.822e-08
Double BB

Spectral model: bbodyrad<1> + bbodyrad<2>
------------------------------------------------------------
Parameters  : value         Lower 90%    Upper 90%
kT1 [keV]   : 7.43917        (-1.65352      1.9828)
R1^2/D10^2  : 0.623823        (-0.371217      0.990499)
kT2 [keV]   : 58.0380        (-33.1946      -58.038)
R2^2/D10^2  : 4.78951E-04    (-0.000442352   0.00492202)
------------------------------------------------------------
#Fit statistic : Chi-Squared =          51.51 using 59 PHA bins.
# Reduced chi-squared =         0.9365 for     55 degrees of freedom
# Null hypothesis probability =   6.088429e-01

Energy  Fluence     90% Error
[keV]   [erg/cm2]   [erg/cm2]
15- 25  4.993e-08   2.547e-08
25- 50  8.437e-08   4.024e-08
50-150  1.502e-07   7.986e-08
15-150  2.845e-07   1.262e-07
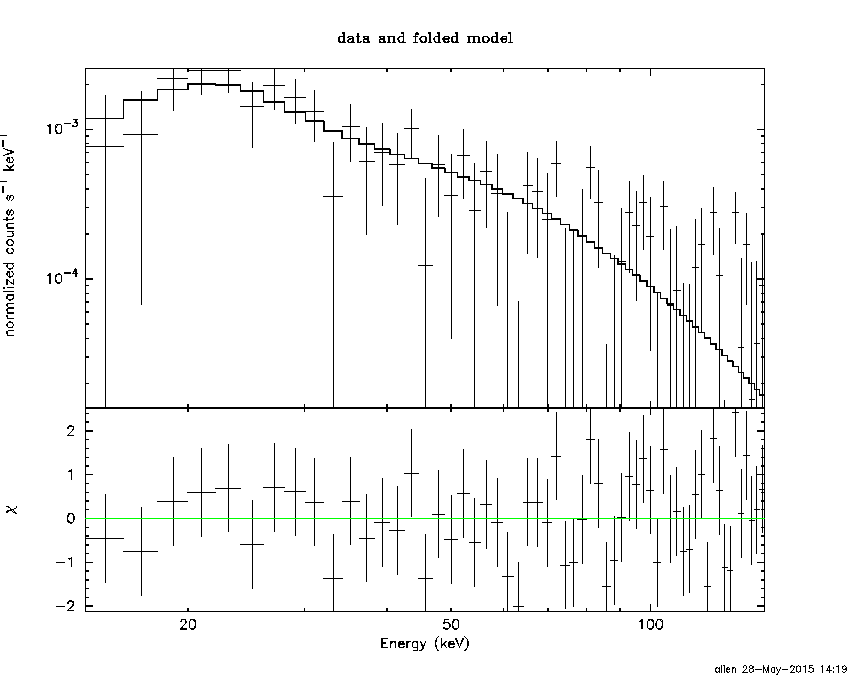
Peak spectrum fit
Power-law model

Time interval is from    7.696 sec. to    8.696 sec.

Spectral model in power-law:
------------------------------------------------------------
Parameters  : value       lower 90%   higher 90%
Photon index: 2.26778     ( -0.461914   0.52304 )
Norm@50keV  : 5.29515E-03    ( -0.00191462   0.00187971 )
------------------------------------------------------------
#Fit statistic : Chi-Squared =          68.89 using 59 PHA bins.
# Reduced chi-squared =          1.209 for     57 degrees of freedom
# Null hypothesis probability =   1.344005e-01

Photon flux (15-150 keV)    in 1 sec: 0.909062 ( -0.243659  0.243801 ) ph/cm2/s
Energy fluence (15-150 keV)             : 5.03192e-08 ( -1.52441e-08  1.60157e-08 ) ergs/cm2
Cutoff power-law model

Time interval is from    7.696 sec. to    8.696 sec.
Spectral model in the cutoff power-law:
------------------------------------------------------------
Parameters  : value       lower 90%   higher 90%
Photon index: -0.570234     ( 0.613919   2.51817 )
Epeak [keV] : 28.6080      (   )
Norm@50keV  : 0.446358    (     )
------------------------------------------------------------
#Fit statistic : Chi-Squared =          66.18 using 59 PHA bins.
# Reduced chi-squared =          1.182 for     56 degrees of freedom
# Null hypothesis probability =   1.657153e-01

Photon flux (15-150 keV)    in 1 sec: 0.867924 ( -0.119764  0.238656 ) ph/cm2/s
Energy fluence (15-150 keV)             : 3.87869e-08 ( -1.51005e-08  1.70466e-08 ) ergs/cm2
Band function

Time interval is from    7.696 sec. to    8.696 sec.

Spectral model in the Band function:
------------------------------------------------------------
Parameters  : value       lower 90%   higher 90%
alpha       : 5.00000   ( -4.681   -5 )
beta        : -3.04189    ( -2.54004   0.807956 )
Epeak [keV] : 24.3139      ( -4.59449 5.14271 )
Norm@50keV   : 1565.66    ( -388.81   4844.1 )
------------------------------------------------------------
#Fit statistic : Chi-Squared =          62.89 using 59 PHA bins.
# Reduced chi-squared =          1.143 for     55 degrees of freedom
# Null hypothesis probability =   2.170960e-01

Photon flux (15-150 keV)    in 1 sec:  (    ) ph/cm2/s
Energy fluence (15-150 keV)             : 0 ( 0  0 ) ergs/cm2
Single BB

Spectral model blackbody:
------------------------------------------------------------
Parameters  : value    Lower 90%  Upper 90%
kT [keV]    : 7.26292  (-1.674  2.25569)
R^2/D10^2   : 1.57847  (-1.07171   3.15918)
(R is the radius in km and D10 is the distance to the source in units of 10 kpc)
------------------------------------------------------------
#Fit statistic : Chi-Squared =          66.27 using 59 PHA bins.
# Reduced chi-squared =          1.163 for     57 degrees of freedom
# Null hypothesis probability =   1.875258e-01

Energy  Fluence     90% Error
[keV]   [erg/cm2]   [erg/cm2]
15- 25  1.388e-08   8.235e-09
25- 50  2.039e-08   1.055e-08
50-150  3.854e-09   3.126e-09
15-150  3.812e-08   2.321e-08
Thermal bremsstrahlung (OTTB)

Spectral model: thermal bremsstrahlung
------------------------------------------------------------
Parameters  : value         Lower 90%    Upper 90%
kT [keV]    : 36.4512       (-15.9764      41.2386)
Norm        : 6.43857       (-2.64985     4.68032)
------------------------------------------------------------
#Fit statistic : Chi-Squared =          67.36 using 59 PHA bins.
# Reduced chi-squared =          1.182 for     57 degrees of freedom
# Null hypothesis probability =   1.638266e-01

Energy  Fluence     90% Error
[keV]   [erg/cm2]   [erg/cm2]
15- 25  1.430e-08   4.994e-09
25- 50  1.804e-08   8.555e-09
50-150  1.257e-08   9.502e-09
15-150  4.490e-08   2.054e-08
Double BB

------------------------------------------------------------
Parameters  : value         Lower 90%    Upper 90%
kT1 [keV]   : 6.83313        (-5.1482      1.91377)
R1^2/D10^2  : 1.96381        (-1.03718      4.08807)
kT2 [keV]   : 200.000        (      )
R2^2/D10^2  : 5.53143E-05    (-5.5316e-05   -5.5316e-05)
------------------------------------------------------------
#Fit statistic : Chi-Squared =          64.04 using 59 PHA bins.
#Fit statistic : Chi-Squared =          64.02 using 59 PHA bins.
# Reduced chi-squared =          1.164 for     55 degrees of freedom
# Reduced chi-squared =          1.164 for     55 degrees of freedom
# Null hypothesis probability =   1.889689e-01
# Null hypothesis probability =   1.895703e-01

Energy  Fluence     90% Error
[keV]   [erg/cm2]   [erg/cm2]
15- 25  1.406e-08   8.460e-09
25- 50  1.974e-08   1.188e-08
50-150  1.723e-08   3.118e-09
15-150  5.103e-08   2.196e-08
Pre-slew spectrum (Pre-slew PHA with pre-slew DRM)
Power-law model
Spectral model in power-law:
------------------------------------------------------------
Parameters  : value       lower 90%   higher 90%
Photon index: 1.81761     ( -0.294043   0.302022 )
Norm@50keV  : 3.52682E-03    ( -0.000632374   0.000617518 )
------------------------------------------------------------
#Fit statistic : Chi-Squared =          56.64 using 59 PHA bins.
# Reduced chi-squared =         0.9937 for     57 degrees of freedom
# Null hypothesis probability =   4.885215e-01

Photon flux (15-150 keV)    in 8.268 sec: 0.489347 ( -0.0818898  0.082222 ) ph/cm2/s
Energy fluence (15-150 keV)             : 2.68297e-07 ( -4.79435e-08  4.86682e-08 ) ergs/cm2
Cutoff power-law model
Spectral model in the cutoff power-law:
------------------------------------------------------------
Parameters  : value       lower 90%   higher 90%
Photon index: 1.82613     ( -0.999302   1.00416 )
Epeak [keV] : 9998.92      (   )
Norm@50keV  : 3.49364E-03    (     )
------------------------------------------------------------
#Fit statistic : Chi-Squared =          56.64 using 59 PHA bins.
# Reduced chi-squared =          1.011 for     56 degrees of freedom
# Null hypothesis probability =   4.508435e-01

Photon flux (15-150 keV)    in 8.268 sec: 0.489974 ( -0.082667  0.081393 ) ph/cm2/s
Energy fluence (15-150 keV)             : 2.6738e-07 ( -5.04662e-08  4.90607e-08 ) ergs/cm2
Band function
Spectral model in the Band function:
------------------------------------------------------------
Parameters  : value       lower 90%   higher 90%
alpha       : 4.94443   ( -13.8474   -4.94443 )
beta        : -2.05407    ( -0.305508   0.377406 )
Epeak [keV] : 25.5315      ( -9.08046 5.73495 )
Norm@50keV   : 410.694    ( -65.4822   7194.86 )
------------------------------------------------------------
#Fit statistic : Chi-Squared =          53.76 using 59 PHA bins.
# Reduced chi-squared =         0.9775 for     55 degrees of freedom
# Null hypothesis probability =   5.220521e-01

Photon flux (15-150 keV)    in 8.268 sec:  (    ) ph/cm2/s
Energy fluence (15-150 keV)             : 0 ( 0  0 ) ergs/cm2
S(25-50 keV) vs. S(50-100 keV) plot

S(25-50 keV)  = 7.60e-08
S(50-100 keV) = 8.63e-08
T90 vs. Hardness ratio plot

T90                                   = 6.25599998235703 sec.
Hardness ratio (energy fluence ratio) = 1.13553
Color vs. Color plot

Count Ratio  (25-50 keV) / (15-25 keV) = 1.41088
Count Ratio (50-100 keV) / (15-25 keV) = 0.741713
Mask shadow pattern

IMX = -7.298330504303442E-01, IMY = -1.383374533288296E-01
TIME vs. PHA plot around the trigger time

TIME vs. DetID plot around the trigger time

100 us light curve (15-350 keV)

Spacecraft aspect plot

Bright source in the pre-burst/pre-slew/post-slew images
Pre-burst image of 15-350 keV band
Time interval of the image:
-239.968000 0.428000

# RAcent  DECcent POSerr Theta    Phi  PeakCts   SNR AngSep     Name
#  [deg]    [deg]    ['] [deg]  [deg]                   [']
244.9886 -15.6296    0.3  25.6  -48.2  11.2352  41.8    0.8	Sco X-1
255.9900 -37.8484    0.5  10.3 -119.7   5.6040  25.0    0.3	4U 1700-377
256.3797 -36.4412    1.5   9.4 -113.2   1.6842   7.6    2.9	GX 349+2
263.1750 -24.7642    6.5   8.0  -15.9   0.4126   1.8    9.1	GX 1+4
264.7029 -44.4832    3.4  12.4 -167.3   0.8021   3.4    2.6	4U 1735-44
268.4217  -1.5225    4.5  30.7   10.3   0.6926   2.6    5.3	SW J1753.5-0127
270.4454 -25.0485    7.0   7.9   33.4   0.4038   1.7    9.0	GX 5-1
270.4517 -25.6356    6.0   7.4   35.3   0.5312   2.2   10.3	GRS 1758-258
273.9412 -14.0737    2.5  19.3   28.8   1.1057   4.5    4.4	GX 17+2
275.8878 -30.3605    3.1   8.2   86.3   0.8113   3.8    2.0	H1820-303
285.0115 -25.0454    8.3  17.7   77.6   0.4080   1.4    7.6	HT1900.1-2455
288.8601  10.9132    3.2  48.1   36.7   3.7674   3.6    4.1	GRS 1915+105
262.9227 -33.8069    2.2   3.4 -112.8   1.1870   5.3    3.7	GX 354-0
323.0870 -46.8759    3.3  45.0  132.8   3.5665   3.5 ------	UNKNOWN
287.0729  -7.6587    2.4  31.1   49.0   1.9031   4.8 ------	UNKNOWN
266.5565 -32.2221    1.6   0.1  158.8   1.8419   7.4 ------	UNKNOWN
218.4658 -29.9756    3.5  40.9  -93.5   3.6897   3.3 ------	UNKNOWN
Pre-slew background subtracted image of 15-350 keV band
Time interval of the image:
0.428000 8.696000

# RAcent  DECcent POSerr Theta    Phi  PeakCts   SNR AngSep     Name
#  [deg]    [deg]    ['] [deg]  [deg]                   [']
244.9499 -15.7825    7.8  25.5  -48.6   0.0545   1.5    8.7	Sco X-1
255.8409 -37.9567    5.3  10.5 -119.9   0.0656   2.2    9.7	4U 1700-377
256.6241 -36.5174    3.2   9.3 -114.1   0.1072   3.6   10.7	GX 349+2
262.8594 -24.9079    0.0   7.9  -18.2   0.0133   0.4   12.7	GX 1+4
264.5452 -44.5136    3.4  12.4 -166.8  -0.1072  -3.4    9.3	4U 1735-44
268.4772  -1.3114    6.4  30.9   10.4   0.0711   1.8   10.7	SW J1753.5-0127
270.2637 -24.9307   10.5   7.9   31.9   0.0345   1.1    9.0	GX 5-1
270.1981 -25.9077    3.7   7.0   34.7  -0.0984  -3.1   11.4	GRS 1758-258
274.0395 -14.0634  197.7  19.4   29.1  -0.0020  -0.1    2.5	GX 17+2
275.7867 -30.3815    8.7   8.1   86.3  -0.0431  -1.3    7.2	H1820-303
285.0039 -24.9861    4.1  17.7   77.4  -0.1064  -2.8    4.3	HT1900.1-2455
288.7461  10.8103   28.0  47.9   36.6  -0.0585  -0.4    8.7	GRS 1915+105
262.8237 -33.9959    0.0   3.6 -114.9  -0.0741  -2.3   12.7	GX 354-0
291.8019 -65.3994    1.1  36.6  169.3   0.4612  10.1 ------	UNKNOWN
287.1856 -63.9899    2.3  34.3  170.7   0.2186   5.1 ------	UNKNOWN
288.2671 -84.2429    2.5  52.5 -176.1   0.4137   4.7 ------	UNKNOWN
250.6190 -15.2445    2.4  22.3  -37.6   0.1582   4.8 ------	UNKNOWN
Post-slew image of 15-350 keV band
Time interval of the image:
106.532600 907.032600

# RAcent  DECcent POSerr Theta    Phi  PeakCts   SNR AngSep     Name
#  [deg]    [deg]    ['] [deg]  [deg]                   [']
170.3076 -60.6240   25.6  46.8 -127.5   0.9449   0.5    0.2	Cen X-3
186.6624 -62.7027    6.2  40.7 -119.8   2.7069   1.9    4.1	GX 301-2
256.0467 -37.8483    1.9  34.5  -37.3   3.7856   6.2    2.9	4U 1700-377
256.5804 -36.4940    3.6  35.5  -35.6   1.9595   3.2    8.2	GX 349+2
263.1685 -24.6059    5.6  44.7  -20.9   1.7115   2.1   12.1	GX 1+4
264.6876 -44.5405    3.5  25.6  -31.4   1.5362   3.3    5.9	4U 1735-44
270.1590 -25.0928    3.9  42.6  -12.2   2.0715   3.0    6.9	GX 5-1
270.3238 -25.7260    3.3  41.9  -12.2   2.3030   3.6    1.5	GRS 1758-258
274.0190 -14.0382    4.0  52.7   -4.5   3.8626   2.9    0.8	GX 17+2
275.9545 -30.3795    3.1  36.3   -6.1   2.5329   3.7    1.7	H1820-303
285.0677 -25.0118    2.4  40.6    8.0   3.4140   4.9    5.7	HT1900.1-2455
263.0238 -33.8247    1.8  36.0  -25.6   3.9697   6.5    1.8	GX 354-0
352.2002 -41.9700    3.6  40.4  102.5   8.7184   3.2 ------	UNKNOWN
 50.7755 -56.7895    3.5  49.4  158.3   6.0305   3.3 ------	UNKNOWN
 82.4010 -65.7986    3.6  47.1 -178.5   3.3546   3.2 ------	UNKNOWN
 94.4015 -68.0319    2.8  46.0 -171.5   4.0806   4.0 ------	UNKNOWN
266.5738 -32.2264    1.5  36.5  -19.9   4.5187   7.6 ------	UNKNOWN
261.2762 -11.2843    2.5  58.0  -18.6   9.9115   4.6 ------	UNKNOWN
Plot creation:
Thu May 28 14:19:49 EDT 2015