Click here for the BAT GCN circular template
Image
Pre-slew 15.0-350.0 keV image (Event data)

#   RAcent    DECcent   POSerr    Theta     Phi              Peak Cts       SNR   Name
  241.9293   -72.1517   0.0197    45.2416  -174.5511         0.6937619      9.780 TRIG_00616061

Foreground time interval of the image:
 -0.384   9.172 (delta_t =   9.556 [sec])
Background time interval of the image:
-107.955  -0.384 (delta_t = 107.571 [sec])
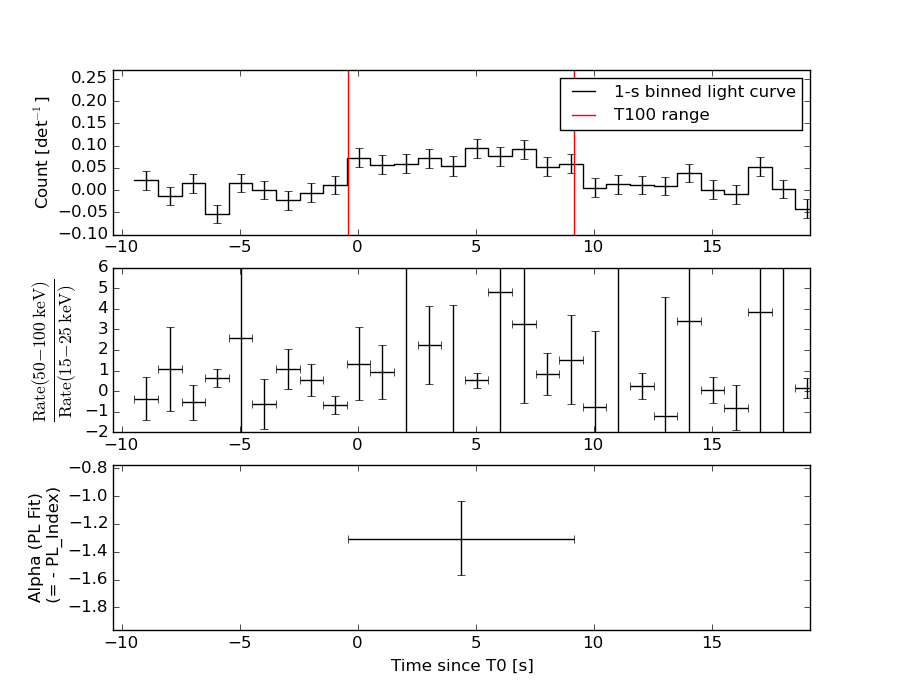
Lightcurves
Notes:
- 1) The mask-weighted light curves are using the flight position.
- 2) Multiple plots of different time binning/intervals are shown to cover all scenarios of short/long GRBs, rate/image triggers, and real/false positives.
- 3) For all the mask-weighted lightcurves, the y-axis units are counts/sec/det where a det is 0.4 x 0.4 = 0.16 sq cm.
- 4) The verticle lines correspond to following: green dotted lines are T50 interval, black dotted lines are T90 interval, blue solid line(s) is a spacecraft slew start time, and orange solid line(s) is a spacecraft slew end time.
- 5) Time of each bin is in the middle of the bin.
1 s binning
From T0-310 s to T0+310 s

From T100_start - 20 s to T100_end + 30 s

Full time interval

64 ms binning
Full time interval
From T100_start to T100_end

From T0-5 sec to T0+5 sec

16 ms binning
From T100_start-5 s to T100_start+5 s

Blue+Cyan dotted lines: Time interval of the scaled map
From 0.000000 to 8.192000
8 ms binning
From T100_start-3 s to T100_start+3 s
Blue+Cyan dotted lines: Time interval of the scaled map
From 0.000000 to 8.192000
2 ms binning
From T100_start-1 s to T100_start+1 s

Blue+Cyan dotted lines: Time interval of the scaled map
From 0.000000 to 8.192000
SN=5 or 10 sec. binning (whichever binning is satisfied first)

SN=5 or 10 sec. binning (T < 200 sec)

Quad-rate summed light curves (from T0-300s to T0+1000s)

Spectral Evolution
Spectra
Notes:
- 1) The fitting includes the systematic errors.
- 2) When the burst includes telescope slew time periods, the fitting uses an average response file made from multiple 5-s response files through out the slew time plus single time preiod for the non-slew times, and weighted by the total counts in the corresponding time period using addrmf. An average response file is needed becuase a spectral fit using the pre-slew DRM will introduce some errors in both a spectral shape and a normalization if the PHA file contains a lot of the slew/post-slew time interval.
- 3) For fits to more complicated models (e.g. a power-law over a cutoff power-law), the BAT team has decided to require a chi-square improvement of more than 6 for each extra dof.
Time averaged spectrum fit using the average DRM
Power-law model

Time interval is from   -0.384 sec. to    9.172 sec.

Spectral model in power-law:
------------------------------------------------------------
Parameters  : value       lower 90%   higher 90%
Photon index: 1.30918     ( -0.271062   0.260411 )
Norm@50keV  : 5.03804E-03    ( -0.000768186   0.000765856 )
------------------------------------------------------------
#Fit statistic : Chi-Squared =          73.18 using 59 PHA bins.
# Reduced chi-squared =          1.284 for     57 degrees of freedom
# Null hypothesis probability =   7.310356e-02

Photon flux (15-150 keV)    in 9.556 sec: 0.602078 ( -0.0995611  0.100726 ) ph/cm2/s
Energy fluence (15-150 keV)             : 4.74687e-07 ( -7.40681e-08  7.43808e-08 ) ergs/cm2
Cutoff power-law model

Time interval is from   -0.384 sec. to    9.172 sec.
Spectral model in the cutoff power-law:
------------------------------------------------------------
Parameters  : value       lower 90%   higher 90%
Photon index: 0.820570     ( -1.50369   0.711414 )
Epeak [keV] : 130.033      ( -130.092 -130.092 )
Norm@50keV  : 8.58116E-03    ( -0.00419469   0.0331015 )
------------------------------------------------------------
#Fit statistic : Chi-Squared =          72.69 using 59 PHA bins.
# Reduced chi-squared =          1.298 for     56 degrees of freedom
# Null hypothesis probability =   6.624294e-02

Photon flux (15-150 keV)    in 9.556 sec: 0.588710 ( -0.104891  0.105485 ) ph/cm2/s
Energy fluence (15-150 keV)             : 4.61542e-07 ( -8.45295e-08  8.09928e-08 ) ergs/cm2
Band function

Time interval is from   -0.384 sec. to    9.172 sec.

Spectral model in the Band function:
------------------------------------------------------------
Parameters  : value       lower 90%   higher 90%
alpha       : 4.97284   ( -14.8595   -4.97284 )
beta        : -1.48593    ( -0.382368   0.321328 )
Epeak [keV] : 31.2974      ( -12.4492 23.3191 )
Norm@50keV   : 115.722    ( -17.2291   2452.42 )
------------------------------------------------------------
#Fit statistic : Chi-Squared =          70.27 using 59 PHA bins.
# Reduced chi-squared =          1.278 for     55 degrees of freedom
# Null hypothesis probability =   8.054347e-02

Photon flux (15-150 keV)    in 9.556 sec:  (    ) ph/cm2/s
Energy fluence (15-150 keV)             : 4.5647e-07 ( -4.56403e-07  -7.8385e-08 ) ergs/cm2
Single BB

Spectral model blackbody:
------------------------------------------------------------
Parameters  : value    Lower 90%  Upper 90%
kT [keV]    : 17.5262  (-2.85228  3.72851)
R^2/D10^2   : 4.20236E-02  (-0.0207101   0.0367376)
(R is the radius in km and D10 is the distance to the source in units of 10 kpc)
------------------------------------------------------------
#Fit statistic : Chi-Squared =          78.01 using 59 PHA bins.
# Reduced chi-squared =          1.369 for     57 degrees of freedom
# Null hypothesis probability =   3.373889e-02

Energy  Fluence     90% Error
[keV]   [erg/cm2]   [erg/cm2]
15- 25  2.490e-08   7.879e-09
25- 50  1.129e-07   2.921e-08
50-150  2.498e-07   7.272e-08
15-150  3.876e-07   9.312e-08
Thermal bremsstrahlung (OTTB)

Spectral model: thermal bremsstrahlung
------------------------------------------------------------
Parameters  : value         Lower 90%    Upper 90%
kT [keV]    : 200.000       (      )
Norm        : 2.57586       (-0.391981     0.391872)
------------------------------------------------------------
#Fit statistic : Chi-Squared =          75.33 using 59 PHA bins.
# Reduced chi-squared =          1.322 for     57 degrees of freedom
# Null hypothesis probability =   5.242517e-02

Energy  Fluence     90% Error
[keV]   [erg/cm2]   [erg/cm2]
15- 25  6.130e-08   3.514e-08
25- 50  1.179e-07   6.699e-08
50-150  2.586e-07   1.424e-07
15-150  4.378e-07   2.420e-07
Double BB

------------------------------------------------------------
Parameters  : value         Lower 90%    Upper 90%
kT1 [keV]   : 12.9571        (-2.45596      3.4203)
R1^2/D10^2  : 9.88670E-02        (-0.0537532      0.107745)
kT2 [keV]   : 200.000        (      )
R2^2/D10^2  : 6.91987E-05    (-3.68703e-05   9.89992e-05)
------------------------------------------------------------
#Fit statistic : Chi-Squared =          69.69 using 59 PHA bins.
#Fit statistic : Chi-Squared =          69.67 using 59 PHA bins.
# Reduced chi-squared =          1.267 for     55 degrees of freedom
# Reduced chi-squared =          1.267 for     55 degrees of freedom
# Null hypothesis probability =   8.780183e-02
# Null hypothesis probability =   8.798820e-02

Energy  Fluence     90% Error
[keV]   [erg/cm2]   [erg/cm2]
15- 25  3.495e-08   1.974e-08
25- 50  1.231e-07   6.441e-08
50-150  2.955e-07   1.040e-07
15-150  4.535e-07   1.905e-07
Peak spectrum fit
Power-law model
Time interval is from    6.196 sec. to    7.196 sec.

Spectral model in power-law:
------------------------------------------------------------
Parameters  : value       lower 90%   higher 90%
Photon index: 1.10899     ( -0.662074   0.564664 )
Norm@50keV  : 7.93068E-03    ( -0.0026454   0.00242046 )
------------------------------------------------------------
#Fit statistic : Chi-Squared =          57.88 using 59 PHA bins.
# Reduced chi-squared =          1.015 for     57 degrees of freedom
# Null hypothesis probability =   4.424933e-01

Photon flux (15-150 keV)    in 1 sec: 0.920694 ( -0.307353  0.316359 ) ph/cm2/s
Energy fluence (15-150 keV)             : 8.26815e-08 ( -2.3915e-08  2.3943e-08 ) ergs/cm2
Cutoff power-law model

Time interval is from    6.196 sec. to    7.196 sec.
Spectral model in the cutoff power-law:
------------------------------------------------------------
Parameters  : value       lower 90%   higher 90%
Photon index: 1.12702     ( -1.19119   0.54739 )
Epeak [keV] : 9999.35      ( -9999.36 -9999.36 )
Norm@50keV  : 8.01103E-03    ( -0.00233984   0.0186806 )
------------------------------------------------------------
#Fit statistic : Chi-Squared =          57.90 using 59 PHA bins.
# Reduced chi-squared =          1.034 for     56 degrees of freedom
# Null hypothesis probability =   4.051611e-01

Photon flux (15-150 keV)    in 1 sec: 0.935473 ( -0.323227  0.293077 ) ph/cm2/s
Energy fluence (15-150 keV)             : 8.26317e-08 ( -2.38587e-08  2.35163e-08 ) ergs/cm2
Band function

Time interval is from    6.196 sec. to    7.196 sec.

Spectral model in the Band function:
------------------------------------------------------------
Parameters  : value       lower 90%   higher 90%
alpha       : -0.888887   ( 0.888734   0.888734 )
beta        : -1.10902    ( 1.10893   0.662171 )
Epeak [keV] : 47.8695      ( -47.9235 -47.9235 )
Norm@50keV   : 1.42512E-02    ( -0.0085922   0 )
------------------------------------------------------------
#Fit statistic : Chi-Squared =          57.88 using 59 PHA bins.
# Reduced chi-squared =          1.052 for     55 degrees of freedom
# Null hypothesis probability =   3.693665e-01

Photon flux (15-150 keV)    in 1 sec:  (    ) ph/cm2/s
Energy fluence (15-150 keV)             : 0 ( 0  0 ) ergs/cm2
Single BB
Spectral model blackbody:
------------------------------------------------------------
Parameters  : value    Lower 90%  Upper 90%
kT [keV]    : 27.6701  (-11.4273  31.3483)
R^2/D10^2   : 1.46056E-02  (-0.0143113   0.0660308)
(R is the radius in km and D10 is the distance to the source in units of 10 kpc)
------------------------------------------------------------
#Fit statistic : Chi-Squared =          62.61 using 59 PHA bins.
# Reduced chi-squared =          1.098 for     57 degrees of freedom
# Null hypothesis probability =   2.838822e-01

Energy  Fluence     90% Error
[keV]   [erg/cm2]   [erg/cm2]
15- 25  1.836e-09   1.188e-09
25- 50  1.094e-08   6.695e-09
50-150  6.078e-08   3.596e-08
15-150  7.355e-08   4.726e-08
Thermal bremsstrahlung (OTTB)

Spectral model: thermal bremsstrahlung
------------------------------------------------------------
Parameters  : value         Lower 90%    Upper 90%
kT [keV]    : 199.363       (-82.4431      -199.363)
Norm        : 4.08314       (-1.20627     1.20627)
------------------------------------------------------------
#Fit statistic : Chi-Squared =          60.37 using 59 PHA bins.
# Reduced chi-squared =          1.059 for     57 degrees of freedom
# Null hypothesis probability =   3.549368e-01

Energy  Fluence     90% Error
[keV]   [erg/cm2]   [erg/cm2]
15- 25  1.017e-08   6.320e-09
25- 50  1.956e-08   1.179e-08
50-150  4.290e-08   2.545e-08
15-150  7.262e-08   4.458e-08
Double BB

Spectral model: bbodyrad<1> + bbodyrad<2>
------------------------------------------------------------
Parameters  : value         Lower 90%    Upper 90%
kT1 [keV]   : 7.87247        (-4.48587      7.03666)
R1^2/D10^2  : 0.701699        (-0.639619      20.346)
kT2 [keV]   : 59.2541        (-57.2329      -60.6778)
R2^2/D10^2  : 1.58475E-03    (-0.00129265   0.0116771)
------------------------------------------------------------
#Fit statistic : Chi-Squared =          56.97 using 59 PHA bins.
# Reduced chi-squared =          1.036 for     55 degrees of freedom
# Null hypothesis probability =   4.016888e-01

Energy  Fluence     90% Error
[keV]   [erg/cm2]   [erg/cm2]
15- 25  8.299e-09   5.715e-09
25- 50  1.719e-08   9.925e-09
50-150  5.977e-08   3.191e-08
15-150  8.526e-08   4.080e-08
Pre-slew spectrum (Pre-slew PHA with pre-slew DRM)
Power-law model
Spectral model in power-law:
------------------------------------------------------------
Parameters  : value       lower 90%   higher 90%
Photon index: 1.30918     ( -0.271062   0.260411 )
Norm@50keV  : 5.03804E-03    ( -0.000768186   0.000765856 )
------------------------------------------------------------
#Fit statistic : Chi-Squared =          73.18 using 59 PHA bins.
# Reduced chi-squared =          1.284 for     57 degrees of freedom
# Null hypothesis probability =   7.310356e-02

Photon flux (15-150 keV)    in 9.556 sec: 0.602078 ( -0.0995611  0.100726 ) ph/cm2/s
Energy fluence (15-150 keV)             : 4.74687e-07 ( -7.40681e-08  7.43808e-08 ) ergs/cm2
Cutoff power-law model
Spectral model in the cutoff power-law:
------------------------------------------------------------
Parameters  : value       lower 90%   higher 90%
Photon index: 0.820570     ( -1.50369   0.711414 )
Epeak [keV] : 130.033      ( -130.092 -130.092 )
Norm@50keV  : 8.58116E-03    ( -0.00419469   0.0331015 )
------------------------------------------------------------
#Fit statistic : Chi-Squared =          72.69 using 59 PHA bins.
# Reduced chi-squared =          1.298 for     56 degrees of freedom
# Null hypothesis probability =   6.624294e-02

Photon flux (15-150 keV)    in 9.556 sec: 0.588710 ( -0.104891  0.105485 ) ph/cm2/s
Energy fluence (15-150 keV)             : 4.61542e-07 ( -8.45295e-08  8.09928e-08 ) ergs/cm2
Band function
Spectral model in the Band function:
------------------------------------------------------------
Parameters  : value       lower 90%   higher 90%
alpha       : 4.97284   ( -14.8192   -4.97284 )
beta        : -1.48593    ( -0.382368   0.321328 )
Epeak [keV] : 31.2974      ( -12.4492 23.3191 )
Norm@50keV   : 115.722    ( -17.2291   2452.42 )
------------------------------------------------------------
#Fit statistic : Chi-Squared =          70.27 using 59 PHA bins.
# Reduced chi-squared =          1.278 for     55 degrees of freedom
# Null hypothesis probability =   8.054347e-02

Photon flux (15-150 keV)    in 9.556 sec:  (    ) ph/cm2/s
Energy fluence (15-150 keV)             : 4.5647e-07 ( -4.56403e-07  -7.8385e-08 ) ergs/cm2
S(25-50 keV) vs. S(50-100 keV) plot

S(25-50 keV)  = 1.06e-07
S(50-100 keV) = 1.71e-07
T90 vs. Hardness ratio plot

T90                                   = 8.71599990129471 sec.
Hardness ratio (energy fluence ratio) = 1.61321
Color vs. Color plot

Count Ratio  (25-50 keV) / (15-25 keV) = 2.26621
Count Ratio (50-100 keV) / (15-25 keV) = 2.03104
Mask shadow pattern

IMX = -1.003910591461702E+00, IMY = 9.576218893147721E-02
TIME vs. PHA plot around the trigger time

Blue+Cyan dotted lines: Time interval of the scaled map
From 0.000000 to 8.192000
TIME vs. DetID plot around the trigger time

Blue+Cyan dotted lines: Time interval of the scaled map
From 0.000000 to 8.192000
100 us light curve (15-350 keV)

Blue+Cyan dotted lines: Time interval of the scaled map
From 0.000000 to 8.192000
Spacecraft aspect plot
Bright source in the pre-burst/pre-slew/post-slew images
Pre-burst image of 15-350 keV band
Time interval of the image:
-107.955400 -0.384000

# RAcent  DECcent POSerr Theta    Phi  PeakCts   SNR AngSep     Name
#  [deg]    [deg]    ['] [deg]  [deg]                   [']
244.9792 -15.6449    0.3  23.6  -65.3   5.8993  33.8    0.3	Sco X-1
256.0006 -37.8034    5.0  12.3 -143.9   0.3340   2.3    2.5	4U 1700-377
256.4948 -36.4087    5.5  11.1 -140.0   0.2999   2.1    3.0	GX 349+2
263.0294 -24.8981    6.3   4.9  -41.1   0.2561   1.8    9.2	GX 1+4
264.9408 -44.4902   15.0  15.7  178.6   0.1102   0.8    8.8	4U 1735-44
268.4124  -1.4438   77.1  27.5    0.0   0.0240   0.1    2.7	SW J1753.5-0127
270.3446 -25.2052    5.7   5.2   41.5   0.2876   2.2    8.2	GX 5-1
270.3600 -25.7316    4.6   4.8   46.0   0.4316   3.2    3.2	GRS 1758-258
273.8561 -14.0631    7.1  16.4   22.4   0.2338   1.6    8.9	GX 17+2
276.0988 -30.3956    5.3   8.7   97.8   0.3293   2.2    9.2	H1820-303
284.9874 -24.8963   17.5  17.2   76.3   0.1066   0.7    3.0	HT1900.1-2455
288.7899  10.9727    2.9  45.4   27.2   1.4868   3.9    1.7	GRS 1915+105
263.1481 -34.0006    0.0   5.8 -158.7   0.2342   1.7   12.7	GX 354-0
240.4458 -51.5800    2.6  29.7 -151.8   0.7100   4.4 ------	UNKNOWN
188.4839 -73.7394    3.2  59.0 -166.2   3.3909   3.6 ------	UNKNOWN
Pre-slew background subtracted image of 15-350 keV band
Time interval of the image:
-0.384000 9.172000

# RAcent  DECcent POSerr Theta    Phi  PeakCts   SNR AngSep     Name
#  [deg]    [deg]    ['] [deg]  [deg]                   [']
244.8985 -15.7658    4.8  23.6  -65.7  -0.1082  -2.4    8.9	Sco X-1
255.8080 -37.8673   42.3  12.5 -143.6  -0.0107  -0.3    8.6	4U 1700-377
256.6470 -36.3034    0.0  11.0 -140.0  -0.0184  -0.5   12.5	GX 349+2
263.1623 -24.7924    4.4   4.9  -39.2  -0.0986  -2.6    8.8	GX 1+4
264.5407 -44.4419    4.7  15.6  179.6   0.0917   2.5    8.7	4U 1735-44
268.3055  -1.3180    3.5  27.6   -0.2  -0.1357  -3.3    8.9	SW J1753.5-0127
270.4513 -25.0463    6.9   5.4   41.0  -0.0642  -1.7    9.3	GX 5-1
270.3176 -25.5939    3.7   4.9   44.4   0.1164   3.1    9.0	GRS 1758-258
274.1532 -14.1450    4.8  16.5   23.5   0.0931   2.4   10.8	GX 17+2
276.0901 -30.3413    9.9   8.7   97.4  -0.0462  -1.2    8.7	H1820-303
285.0978 -24.9758   24.6  17.3   76.7  -0.0199  -0.5    4.7	HT1900.1-2455
288.8736  10.8005  522.2  45.3   27.4   0.0022   0.0    9.8	GRS 1915+105
262.8058 -33.8830    6.7   5.8 -155.6  -0.0649  -1.7    9.6	GX 354-0
241.9292 -72.1517    1.2  45.2 -174.6   0.6940   9.8 ------	UNKNOWN
225.7877 -43.3258    2.1  35.3 -130.0   0.3291   5.5 ------	UNKNOWN
233.7602   7.7168    1.8  48.1  -50.3   1.1136   6.3 ------	UNKNOWN
Post-slew image of 15-350 keV band
Time interval of the image:
118.644600 962.559900

# RAcent  DECcent POSerr Theta    Phi  PeakCts   SNR AngSep     Name
#  [deg]    [deg]    ['] [deg]  [deg]                   [']
135.4746 -40.6413   27.5  56.4 -169.9   1.8576   0.4    5.8	Vela X-1
170.4477 -60.8023    0.0  28.6 -155.5   1.4565   1.5   11.4	Cen X-3
186.6085 -62.8155    4.4  22.1 -144.8   2.5805   2.6    3.0	GX 301-2
255.8448 -37.9413   10.7  34.9  -31.5   1.5148   1.1    8.9	4U 1700-377
256.6903 -36.3970    8.3  36.5  -30.7   2.0405   1.4   12.4	GX 349+2
262.8071 -24.7769    5.7  48.8  -25.4   5.1895   2.0   11.2	GX 1+4
264.5122 -44.4599    8.5  29.7  -17.3   1.3494   1.4    9.9	4U 1735-44
270.1628 -25.0565    6.1  49.6  -16.6  -3.7813  -1.9    6.7	GX 5-1
270.2507 -25.6738    5.2  49.0  -16.4   4.5672   2.2    5.0	GRS 1758-258
275.7900 -30.4177   10.3  45.4   -8.5   2.2863   1.1    7.6	H1820-303
285.0416 -24.9199  179.1  52.8    0.2   0.1873   0.1    0.3	HT1900.1-2455
262.9616 -33.9185   37.2  39.7  -23.1  -0.3957  -0.3    5.2	GX 354-0
 88.1945 -70.9081    3.1  36.0  143.4   5.8435   3.7 ------	UNKNOWN
148.0878 -73.3475    3.9  25.1  171.6   3.4949   2.9 ------	UNKNOWN
137.6229 -46.3090    3.1  50.5 -170.7   8.5903   3.7 ------	UNKNOWN
270.8875 -17.6827    2.8  57.0  -17.5  15.3278   4.1 ------	UNKNOWN
147.8938 -35.1869    4.2  58.0 -156.7  17.5644   2.8 ------	UNKNOWN
Plot creation:
Thu May 28 14:08:17 EDT 2015