Click here for the BAT GCN circular template
Image
Pre-slew 15.0-350.0 keV image (Event data)
#   RAcent    DECcent   POSerr    Theta     Phi              Peak Cts       SNR   Name
   44.0490    26.9252   0.0154    15.7411   128.8679         1.2234431     12.499 TRIG_00616502

Foreground time interval of the image:
 13.956  73.501 (delta_t =  59.545 [sec])
Background time interval of the image:
-239.000  13.956 (delta_t = 252.956 [sec])
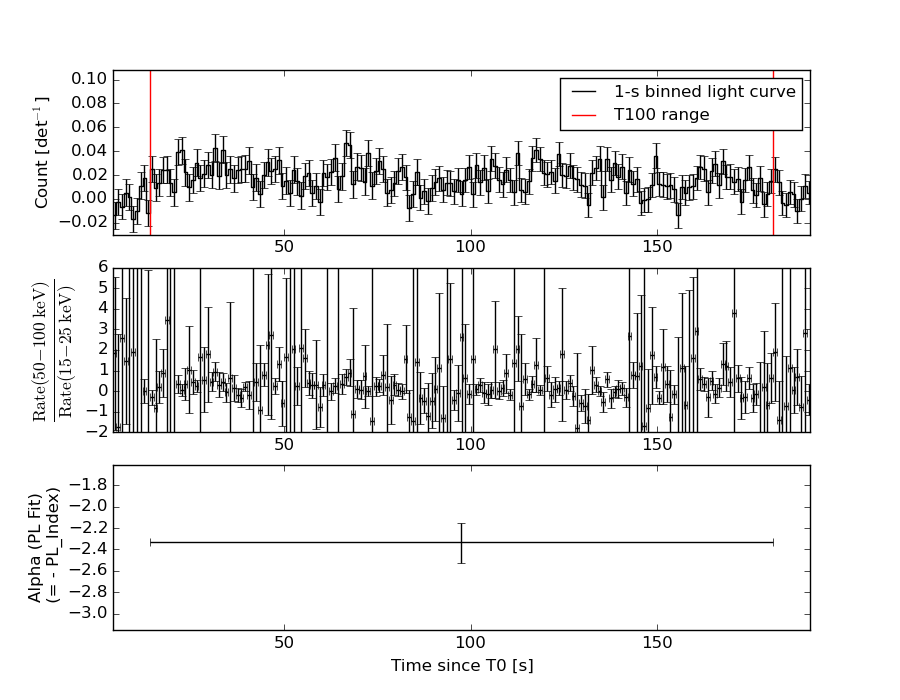
Lightcurves
Notes:
- 1) The mask-weighted light curves are using the flight position.
- 2) Multiple plots of different time binning/intervals are shown to cover all scenarios of short/long GRBs, rate/image triggers, and real/false positives.
- 3) For all the mask-weighted lightcurves, the y-axis units are counts/sec/det where a det is 0.4 x 0.4 = 0.16 sq cm.
- 4) The verticle lines correspond to following: green dotted lines are T50 interval, black dotted lines are T90 interval, blue solid line(s) is a spacecraft slew start time, and orange solid line(s) is a spacecraft slew end time.
- 5) Time of each bin is in the middle of the bin.
1 s binning
From T0-310 s to T0+310 s

From T100_start - 20 s to T100_end + 30 s

Full time interval
64 ms binning
Full time interval

From T100_start to T100_end

From T0-5 sec to T0+5 sec
16 ms binning
From T100_start-5 s to T100_start+5 s

8 ms binning
From T100_start-3 s to T100_start+3 s

2 ms binning
From T100_start-1 s to T100_start+1 s
SN=5 or 10 sec. binning (whichever binning is satisfied first)
SN=5 or 10 sec. binning (T < 200 sec)
Quad-rate summed light curves (from T0-300s to T0+1000s)

Spectral Evolution
Spectra
Notes:
- 1) The fitting includes the systematic errors.
- 2) When the burst includes telescope slew time periods, the fitting uses an average response file made from multiple 5-s response files through out the slew time plus single time preiod for the non-slew times, and weighted by the total counts in the corresponding time period using addrmf. An average response file is needed becuase a spectral fit using the pre-slew DRM will introduce some errors in both a spectral shape and a normalization if the PHA file contains a lot of the slew/post-slew time interval.
- 3) For fits to more complicated models (e.g. a power-law over a cutoff power-law), the BAT team has decided to require a chi-square improvement of more than 6 for each extra dof.
Time averaged spectrum fit using the average DRM
Power-law model

Time interval is from   13.956 sec. to  180.892 sec.

Spectral model in power-law:
------------------------------------------------------------
Parameters  : value       lower 90%   higher 90%
Photon index: 2.33101     ( -0.181645   0.192527 )
Norm@50keV  : 8.06691E-04    ( -0.000104014   0.000102215 )
------------------------------------------------------------
#Fit statistic : Chi-Squared =          62.02 using 59 PHA bins.
# Reduced chi-squared =          1.088 for     57 degrees of freedom
# Null hypothesis probability =   3.018389e-01

Photon flux (15-150 keV)    in 166.9 sec: 0.143449 ( -0.0117518  0.0117563 ) ph/cm2/s
Energy fluence (15-150 keV)             : 1.29424e-06 ( -1.30576e-07  1.34038e-07 ) ergs/cm2
Cutoff power-law model

Time interval is from   13.956 sec. to  180.892 sec.
Spectral model in the cutoff power-law:
------------------------------------------------------------
Parameters  : value       lower 90%   higher 90%
Photon index: 1.98906     ( -1.98906   -1.98906 )
Epeak [keV] : 1.25170      ( -0.492036 22.5139 )
Norm@50keV  : 1.28832E-03    ( -0.000239669   0.000230624 )
------------------------------------------------------------
#Fit statistic : Chi-Squared =          63.31 using 59 PHA bins.
# Reduced chi-squared =          1.131 for     56 degrees of freedom
# Null hypothesis probability =   2.341743e-01

Photon flux (15-150 keV)    in 166.9 sec: 0.143428 (    ) ph/cm2/s
Energy fluence (15-150 keV)             : 1.28989e-06 ( 0  0 ) ergs/cm2
Band function

Time interval is from   13.956 sec. to  180.892 sec.

Spectral model in the Band function:
------------------------------------------------------------
Parameters  : value       lower 90%   higher 90%
alpha       : -1.56993   ( 1.56473   1.56473 )
beta        : -2.35348    ( 2.3537   0.200785 )
Epeak [keV] : 12.6650      ( -12.8433 72.6542 )
Norm@50keV   : 3.22409E-03    ( -0.00335132   973.49 )
------------------------------------------------------------
#Fit statistic : Chi-Squared =          61.92 using 59 PHA bins.
# Reduced chi-squared =          1.126 for     55 degrees of freedom
# Null hypothesis probability =   2.428308e-01

Photon flux (15-150 keV)    in 166.9 sec:  (    ) ph/cm2/s
Energy fluence (15-150 keV)             : 0 ( 0  0 ) ergs/cm2
Single BB
Spectral model blackbody:
------------------------------------------------------------
Parameters  : value    Lower 90%  Upper 90%
kT [keV]    : 7.70293  (-0.759636  0.836201)
R^2/D10^2   : 0.173663  (-0.0598754   0.0934941)
(R is the radius in km and D10 is the distance to the source in units of 10 kpc)
------------------------------------------------------------
#Fit statistic : Chi-Squared =          94.86 using 59 PHA bins.
# Reduced chi-squared =          1.664 for     57 degrees of freedom
# Null hypothesis probability =   1.219303e-03

Energy  Fluence     90% Error
[keV]   [erg/cm2]   [erg/cm2]
15- 25  3.019e-07   3.922e-08
25- 50  4.943e-07   5.191e-08
50-150  1.144e-07   3.522e-08
15-150  9.106e-07   9.154e-08
Thermal bremsstrahlung (OTTB)

Spectral model: thermal bremsstrahlung
------------------------------------------------------------
Parameters  : value         Lower 90%    Upper 90%
kT [keV]    : 39.1067       (-8.36566      11.821)
Norm        : 0.921765       (-0.158232     0.201974)
------------------------------------------------------------
#Fit statistic : Chi-Squared =          67.56 using 59 PHA bins.
# Reduced chi-squared =          1.185 for     57 degrees of freedom
# Null hypothesis probability =   1.597014e-01

Energy  Fluence     90% Error
[keV]   [erg/cm2]   [erg/cm2]
15- 25  3.506e-07   3.789e-08
25- 50  4.567e-07   4.732e-08
50-150  3.446e-07   9.455e-08
15-150  1.152e-06   1.267e-07
Double BB
Spectral model: bbodyrad<1> + bbodyrad<2>
------------------------------------------------------------
Parameters  : value         Lower 90%    Upper 90%
kT1 [keV]   : 5.45218        (-1.68974      1.36267)
R1^2/D10^2  : 0.605785        (-0.337793      1.9809)
kT2 [keV]   : 22.4003        (-10.4843      39.4207)
R2^2/D10^2  : 1.62931E-03    (-0.00142784   0.00923328)
------------------------------------------------------------
#Fit statistic : Chi-Squared =          65.91 using 59 PHA bins.
# Reduced chi-squared =          1.198 for     55 degrees of freedom
# Null hypothesis probability =   1.488353e-01

Energy  Fluence     90% Error
[keV]   [erg/cm2]   [erg/cm2]
15- 25  3.684e-07   8.829e-08
25- 50  4.098e-07   9.747e-08
50-150  5.186e-07   2.903e-07
15-150  1.297e-06   4.157e-07
Peak spectrum fit
Power-law model

Time interval is from   65.640 sec. to   66.640 sec.

Spectral model in power-law:
------------------------------------------------------------
Parameters  : value       lower 90%   higher 90%
Photon index: 1.24339     ( -1.08134   0.82823 )
Norm@50keV  : 3.03213E-03    ( -0.00110554   0.00110553 )
------------------------------------------------------------
#Fit statistic : Chi-Squared =          50.88 using 59 PHA bins.
# Reduced chi-squared =         0.8926 for     57 degrees of freedom
# Null hypothesis probability =   7.026515e-01

Photon flux (15-150 keV)    in 1 sec: 0.358152 ( -0.35815  0.138132 ) ph/cm2/s
Energy fluence (15-150 keV)             : 3.04126e-08 ( -1.27164e-08  1.30335e-08 ) ergs/cm2
Cutoff power-law model
Time interval is from   65.640 sec. to   66.640 sec.
Spectral model in the cutoff power-law:
------------------------------------------------------------
Parameters  : value       lower 90%   higher 90%
Photon index: 2.08327     (     )
Epeak [keV] : 31.1886      (   )
Norm@50keV  : 1.17071E-03    (     )
------------------------------------------------------------
#Fit statistic : Chi-Squared =          50.56 using 59 PHA bins.
# Reduced chi-squared =         0.9029 for     56 degrees of freedom
# Null hypothesis probability =   6.801568e-01

Photon flux (15-150 keV)    in 1 sec: 0.358812 ( -0.133678  0.13748 ) ph/cm2/s
Energy fluence (15-150 keV)             : 2.96501e-08 ( -6.3734e-09  1.26253e-08 ) ergs/cm2
Band function

Time interval is from   65.640 sec. to   66.640 sec.

Spectral model in the Band function:
------------------------------------------------------------
Parameters  : value       lower 90%   higher 90%
alpha       : 4.98482   ( -4.98482   -4.98482 )
beta        : -1.31320    ( -1.23817   1.08535 )
Epeak [keV] : 23.9254      ( -23.9254 46.8245 )
Norm@50keV   : 334.623    ( -121.346   2.69606e+06 )
------------------------------------------------------------
#Fit statistic : Chi-Squared =          50.66 using 59 PHA bins.
# Reduced chi-squared =         0.9211 for     55 degrees of freedom
# Null hypothesis probability =   6.410939e-01

Photon flux (15-150 keV)    in 1 sec:  (    ) ph/cm2/s
Energy fluence (15-150 keV)             : 0 ( 0  0 ) ergs/cm2
Single BB

Spectral model blackbody:
------------------------------------------------------------
Parameters  : value    Lower 90%  Upper 90%
kT [keV]    : 40.1698  (-41.0141  -41.0141)
R^2/D10^2   : 1.94084E-03  (-0.00177263   0.337695)
(R is the radius in km and D10 is the distance to the source in units of 10 kpc)
------------------------------------------------------------
#Fit statistic : Chi-Squared =          55.85 using 59 PHA bins.
# Reduced chi-squared =         0.9798 for     57 degrees of freedom
# Null hypothesis probability =   5.182466e-01

Energy  Fluence     90% Error
[keV]   [erg/cm2]   [erg/cm2]
15- 25  4.029e-10   2.792e-10
25- 50  2.751e-09   1.791e-09
50-150  2.644e-08   1.745e-08
15-150  2.959e-08   1.780e-08
Thermal bremsstrahlung (OTTB)

Spectral model: thermal bremsstrahlung
------------------------------------------------------------
Parameters  : value         Lower 90%    Upper 90%
kT [keV]    : 199.361       (-199.362      -199.362)
Norm        : 1.47412       (-0.552122     0.553323)
------------------------------------------------------------
#Fit statistic : Chi-Squared =          51.97 using 59 PHA bins.
# Reduced chi-squared =         0.9118 for     57 degrees of freedom
# Null hypothesis probability =   6.637255e-01

Energy  Fluence     90% Error
[keV]   [erg/cm2]   [erg/cm2]
15- 25  3.671e-09   2.360e-09
25- 50  7.061e-09   4.510e-09
50-150  1.549e-08   9.945e-09
15-150  2.622e-08   1.682e-08
Double BB
------------------------------------------------------------
Parameters  : value         Lower 90%    Upper 90%
kT1 [keV]   : 5.37241        (-2.18688      4.07326)
R1^2/D10^2  : 1.49824        (-1.15185      10.7432)
kT2 [keV]   : 200.000        (      )
R2^2/D10^2  : 9.81885E-05    (-4.54108e-05   0.00021225)
------------------------------------------------------------
#Fit statistic : Chi-Squared =          46.85 using 59 PHA bins.
#Fit statistic : Chi-Squared =          46.62 using 59 PHA bins.
# Reduced chi-squared =         0.8519 for     55 degrees of freedom
# Reduced chi-squared =         0.8475 for     55 degrees of freedom
# Null hypothesis probability =   7.747271e-01
# Null hypothesis probability =   7.822127e-01

Energy  Fluence     90% Error
[keV]   [erg/cm2]   [erg/cm2]
15- 25  4.863e-09   3.088e-09
25- 50  5.253e-09   3.138e-09
50-150  2.594e-08   1.789e-08
15-150  3.606e-08   2.798e-08
Pre-slew spectrum (Pre-slew PHA with pre-slew DRM)
Power-law model

Spectral model in power-law:
------------------------------------------------------------
Parameters  : value       lower 90%   higher 90%
Photon index: 2.02750     ( -0.207454   0.220284 )
Norm@50keV  : 1.16913E-03    ( -0.000170587   0.000166245 )
------------------------------------------------------------
#Fit statistic : Chi-Squared =          60.59 using 59 PHA bins.
# Reduced chi-squared =          1.063 for     57 degrees of freedom
# Null hypothesis probability =   3.478285e-01

Photon flux (15-150 keV)    in 59.54 sec: 0.177623 ( -0.0189851  0.0189848 ) ph/cm2/s
Energy fluence (15-150 keV)             : 6.42967e-07 ( -8.56042e-08  8.80132e-08 ) ergs/cm2
Cutoff power-law model

Spectral model in the cutoff power-law:
------------------------------------------------------------
Parameters  : value       lower 90%   higher 90%
Photon index: 1.88073     ( -1.11752   0.232204 )
Epeak [keV] : 32.1497      (   )
Norm@50keV  : 1.43257E-03    (     )
------------------------------------------------------------
#Fit statistic : Chi-Squared =          60.51 using 59 PHA bins.
# Reduced chi-squared =          1.081 for     56 degrees of freedom
# Null hypothesis probability =   3.163276e-01

Photon flux (15-150 keV)    in 59.54 sec: 0.176554 ( -0.01982  0.019735 ) ph/cm2/s
Energy fluence (15-150 keV)             : 6.30802e-07 ( -1.13608e-07  9.82827e-08 ) ergs/cm2
Band function

Spectral model in the Band function:
------------------------------------------------------------
Parameters  : value       lower 90%   higher 90%
alpha       : -1.13304   ( 1.09434   1.09434 )
beta        : -2.26464    ( 2.27445   0.409583 )
Epeak [keV] : 32.2200      ( -32.3747 -32.3747 )
Norm@50keV   : 4.47137E-03    ( -0.00523155   377.932 )
------------------------------------------------------------
#Fit statistic : Chi-Squared =          59.54 using 59 PHA bins.
# Reduced chi-squared =          1.083 for     55 degrees of freedom
# Null hypothesis probability =   3.139543e-01

Photon flux (15-150 keV)    in 59.54 sec:  (    ) ph/cm2/s
Energy fluence (15-150 keV)             : 0 ( 0  0 ) ergs/cm2
S(25-50 keV) vs. S(50-100 keV) plot

S(25-50 keV)  = 4.20e-07
S(50-100 keV) = 3.34e-07
T90 vs. Hardness ratio plot

T90                                   = 139.475999951363 sec.
Hardness ratio (energy fluence ratio) = 0.795238
Color vs. Color plot

Count Ratio  (25-50 keV) / (15-25 keV) = 0.806814
Count Ratio (50-100 keV) / (15-25 keV) = 0.299592
Mask shadow pattern

IMX = -1.768756455081310E-01, IMY = -2.194556478470043E-01
TIME vs. PHA plot around the trigger time

TIME vs. DetID plot around the trigger time

100 us light curve (15-350 keV)

Spacecraft aspect plot

Bright source in the pre-burst/pre-slew/post-slew images
Pre-burst image of 15-350 keV band
Time interval of the image:
-239.000000 13.956000

# RAcent  DECcent POSerr Theta    Phi  PeakCts   SNR AngSep     Name
#  [deg]    [deg]    ['] [deg]  [deg]                   [']
 83.6244  22.0246    0.3  29.2 -126.5  10.5825  36.5    0.8	Crab
 12.7527  21.0362    2.2  39.8   89.3   5.1635   5.2 ------	UNKNOWN
 71.2178  65.7906    2.5  52.9  172.2   3.5691   4.6 ------	UNKNOWN
 84.7049 -18.8240    2.9  44.8  -59.9   3.8004   4.0 ------	UNKNOWN
 86.1607 -15.6261    3.1  43.6  -64.6   3.6974   3.7 ------	UNKNOWN
Pre-slew background subtracted image of 15-350 keV band
Time interval of the image:
13.956000 73.500590

# RAcent  DECcent POSerr Theta    Phi  PeakCts   SNR AngSep     Name
#  [deg]    [deg]    ['] [deg]  [deg]                   [']
 83.6603  22.1592   18.0  29.2 -126.7   0.0763   0.6    8.8	Crab
 44.0490  26.9252    0.9  15.7  128.9   1.2235  12.5 ------	UNKNOWN
 68.5836  60.6922    2.0  47.7  173.0   1.1244   5.6 ------	UNKNOWN
Post-slew image of 15-350 keV band
Time interval of the image:
143.500620 209.700600

# RAcent  DECcent POSerr Theta    Phi  PeakCts   SNR AngSep     Name
#  [deg]    [deg]    ['] [deg]  [deg]                   [']
 83.6558  22.0241    0.6  36.2  -44.8   2.5262  18.2    1.4	Crab
 55.6597   8.3687    2.7  21.6   13.6   0.3945   4.2 ------	UNKNOWN
 44.0727  26.8854    2.0   0.1   76.4   0.5237   5.7 ------	UNKNOWN
 51.4491  22.9167    2.7   7.8  -14.1   0.3738   4.3 ------	UNKNOWN
 53.4008  23.3313    3.0   9.1  -22.5   0.3298   3.8 ------	UNKNOWN
 69.0913  10.4814    2.4  28.7  -13.6   0.4742   4.9 ------	UNKNOWN
356.5166  57.6945    2.8  45.2 -167.6   0.6547   4.0 ------	UNKNOWN
 90.7826   4.3440    2.5  49.9  -25.3   0.9168   4.6 ------	UNKNOWN
Plot creation:
Thu May 28 14:06:21 EDT 2015