Special notes of this burst
Image
Pre-slew 15.0-50.0 keV image (Event data)
#RAcent DECcent POSerr Theta  Phi  Peak_Cts  SNR Name
144.507 -0.602 0.000 22.337 70.049 0.663 7.982 TRIG_00618024

Image time interval: 0.000 to 64.000 [sec]
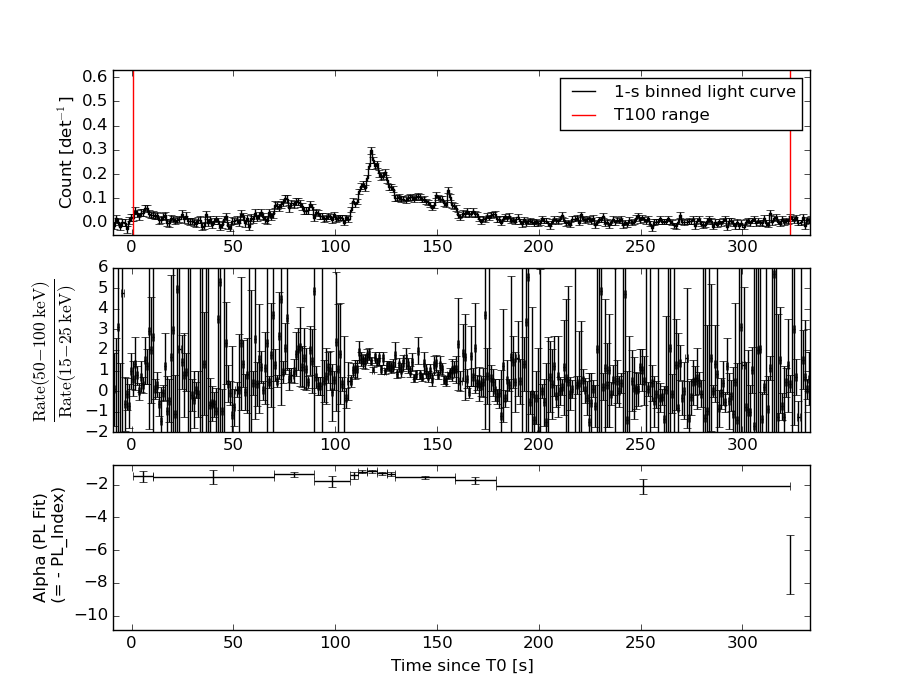
Lightcurves
Notes:
- 1) The mask-weighted light curves are using the flight position.
- 2) Multiple plots of different time binning/intervals are shown to cover all scenarios of short/long GRBs, rate/image triggers, and real/false positives.
- 3) For all the mask-weighted lightcurves, the y-axis units are counts/sec/det where a det is 0.4 x 0.4 = 0.16 sq cm.
- 4) The verticle lines correspond to following: green dotted lines are T50 interval, black dotted lines are T90 interval, blue solid line(s) is a spacecraft slew start time, and orange solid line(s) is a spacecraft slew end time.
- 5) Time of each bin is in the middle of the bin.
1 s binning
From T0-310 s to T0+310 s
From T100_start - 20 s to T100_end + 30 s
Full time interval

64 ms binning
Full time interval
From T100_start to T100_end
From T0-5 sec to T0+5 sec
16 ms binning
From T100_start-5 s to T100_start+5 s

Blue+Cyan dotted lines: Time interval of the scaled map
From 0.000000 to 64.000000
8 ms binning
From T100_start-3 s to T100_start+3 s

Blue+Cyan dotted lines: Time interval of the scaled map
From 0.000000 to 64.000000
2 ms binning
From T100_start-1 s to T100_start+1 s

Blue+Cyan dotted lines: Time interval of the scaled map
From 0.000000 to 64.000000
SN=5 or 10 sec. binning (whichever binning is satisfied first)
SN=5 or 10 sec. binning (T < 200 sec)
Quad-rate summed light curves (from T0-300s to T0+1000s)

Spectral Evolution
Spectra
Notes:
- 1) The fitting includes the systematic errors.
- 2) When the burst includes telescope slew time periods, the fitting uses an average response file made from multiple 5-s response files through out the slew time plus single time preiod for the non-slew times, and weighted by the total counts in the corresponding time period using addrmf. An average response file is needed becuase a spectral fit using the pre-slew DRM will introduce some errors in both a spectral shape and a normalization if the PHA file contains a lot of the slew/post-slew time interval.
- 3) For fits to more complicated models (e.g. a power-law over a cutoff power-law), the BAT team has decided to require a chi-square improvement of more than 6 for each extra dof.
Time averaged spectrum fit using the average DRM
Power-law model

Time interval is from    0.596 sec. to  323.152 sec.

Spectral model in power-law:
------------------------------------------------------------
Parameters  : value       lower 90%   higher 90%
Photon index: 1.50969     ( -0.0656952   0.0657611 )
Norm@50keV  : 2.18047E-03    ( -7.52901e-05   7.51969e-05 )
------------------------------------------------------------
#Fit statistic : Chi-Squared =          51.90 using 59 PHA bins.
# Reduced chi-squared =         0.9104 for     57 degrees of freedom
# Null hypothesis probability =   6.664733e-01

Photon flux (15-150 keV)    in 322.6 sec: 0.272924 ( -0.00995337  0.00998768 ) ph/cm2/s
Energy fluence (15-150 keV)             : 6.66256e-06 ( -2.49236e-07  2.50456e-07 ) ergs/cm2
Cutoff power-law model
Time interval is from    0.596 sec. to  323.152 sec.
Spectral model in the cutoff power-law:
------------------------------------------------------------
Parameters  : value       lower 90%   higher 90%
Photon index: 1.45684     ( -0.246087   0.0842337 )
Epeak [keV] : 536.349      ( -536.35 -536.35 )
Norm@50keV  : 2.31203E-03    ( -0.000353409   0.000699288 )
------------------------------------------------------------
#Fit statistic : Chi-Squared =          51.75 using 59 PHA bins.
# Reduced chi-squared =         0.9241 for     56 degrees of freedom
# Null hypothesis probability =   6.363506e-01

Photon flux (15-150 keV)    in 322.6 sec: 0.271889 ( -0.010856  0.005456 ) ph/cm2/s
Energy fluence (15-150 keV)             : 6.6363e-06 ( -2.81759e-07  2.70532e-07 ) ergs/cm2
Band function

Time interval is from    0.596 sec. to  323.152 sec.

Spectral model in the Band function:
------------------------------------------------------------
Parameters  : value       lower 90%   higher 90%
alpha       : -0.180648   ( 0.765264   0.765264 )
beta        : -1.54978    ( -0.0945613   0.0784289 )
Epeak [keV] : 38.3955      ( -38.2965 265.227 )
Norm@50keV   : 1.83338E-02    ( -0.0188533   142.358 )
------------------------------------------------------------
#Fit statistic : Chi-Squared =          49.85 using 59 PHA bins.
# Reduced chi-squared =         0.9063 for     55 degrees of freedom
# Null hypothesis probability =   6.713386e-01

Photon flux (15-150 keV)    in 322.6 sec:  (    ) ph/cm2/s
Energy fluence (15-150 keV)             : 0 ( 0  0 ) ergs/cm2
Single BB

Spectral model blackbody:
------------------------------------------------------------
Parameters  : value    Lower 90%  Upper 90%
kT [keV]    : 15.9313  (  )
R^2/D10^2   : 2.38295E-02  (   )
(R is the radius in km and D10 is the distance to the source in units of 10 kpc)
------------------------------------------------------------
#Fit statistic : Chi-Squared =         264.06 using 59 PHA bins.
# Reduced chi-squared =         4.6326 for     57 degrees of freedom
# Null hypothesis probability =   2.092896e-28

Energy  Fluence     90% Error
[keV]   [erg/cm2]   [erg/cm2]
15- 25  4.038e-07   2.871e-08
25- 50  1.693e-06   8.839e-08
50-150  2.998e-06   2.008e-07
15-150  5.095e-06   2.161e-07
Thermal bremsstrahlung (OTTB)

Spectral model: thermal bremsstrahlung
------------------------------------------------------------
Parameters  : value         Lower 90%    Upper 90%
kT [keV]    : 200.000       (-16.6055      -200)
Norm        : 1.11195       (-0.0380025     0.0380025)
------------------------------------------------------------
#Fit statistic : Chi-Squared =          57.03 using 59 PHA bins.
# Reduced chi-squared =          1.001 for     57 degrees of freedom
# Null hypothesis probability =   4.739384e-01

Energy  Fluence     90% Error
[keV]   [erg/cm2]   [erg/cm2]
15- 25  8.933e-07   3.597e-08
25- 50  1.718e-06   7.017e-08
50-150  3.769e-06   1.371e-07
15-150  6.380e-06   2.549e-07
Double BB

Spectral model: bbodyrad<1> + bbodyrad<2>
------------------------------------------------------------
Parameters  : value         Lower 90%    Upper 90%
kT1 [keV]   : 6.87340        (-0.692336      0.754612)
R1^2/D10^2  : 0.309594        (-0.0956181      0.147845)
kT2 [keV]   : 28.0513        (-2.91602      3.85577)
R2^2/D10^2  : 2.79566E-03    (-0.000984999   0.00130998)
------------------------------------------------------------
#Fit statistic : Chi-Squared =          45.44 using 59 PHA bins.
# Reduced chi-squared =         0.8262 for     55 degrees of freedom
# Null hypothesis probability =   8.174878e-01

Energy  Fluence     90% Error
[keV]   [erg/cm2]   [erg/cm2]
15- 25  8.591e-07   9.920e-08
25- 50  1.675e-06   1.269e-07
50-150  4.094e-06   4.355e-07
15-150  6.628e-06   5.387e-07
Peak spectrum fit
Power-law model

Time interval is from  117.392 sec. to  118.392 sec.

Spectral model in power-law:
------------------------------------------------------------
Parameters  : value       lower 90%   higher 90%
Photon index: 1.18091     ( -0.130296   0.128912 )
Norm@50keV  : 2.05871E-02    ( -0.00148821   0.00148795 )
------------------------------------------------------------
#Fit statistic : Chi-Squared =          51.18 using 59 PHA bins.
# Reduced chi-squared =         0.8979 for     57 degrees of freedom
# Null hypothesis probability =   6.920649e-01

Photon flux (15-150 keV)    in 1 sec: 2.41022 ( -0.17754  0.177782 ) ph/cm2/s
Energy fluence (15-150 keV)             : 2.10007e-07 ( -1.72671e-08  1.73723e-08 ) ergs/cm2
Cutoff power-law model
Time interval is from  117.392 sec. to  118.392 sec.
Spectral model in the cutoff power-law:
------------------------------------------------------------
Parameters  : value       lower 90%   higher 90%
Photon index: 1.18095     ( -0.135064   0.125866 )
Epeak [keV] : 9999.36      ( -9999.36 -9999.36 )
Norm@50keV  : 2.06522E-02    ( -0.00149344   0.00789236 )
------------------------------------------------------------
#Fit statistic : Chi-Squared =          51.21 using 59 PHA bins.
# Reduced chi-squared =         0.9145 for     56 degrees of freedom
# Null hypothesis probability =   6.563285e-01

Photon flux (15-150 keV)    in 1 sec: 2.41006 ( -0.17695  0.17706 ) ph/cm2/s
Energy fluence (15-150 keV)             : 2.09423e-07 ( -1.6732e-08  1.7653e-08 ) ergs/cm2
Band function
Time interval is from  117.392 sec. to  118.392 sec.

Spectral model in the Band function:
------------------------------------------------------------
Parameters  : value       lower 90%   higher 90%
alpha       : -0.521196   ( 0.812229   0.812229 )
beta        : -1.19905    ( 1.19445   0.141334 )
Epeak [keV] : 58.8253      ( -58.7495 365.087 )
Norm@50keV   : 6.19319E-02    ( -0.0644607   1.16974e+06 )
------------------------------------------------------------
#Fit statistic : Chi-Squared =          51.05 using 59 PHA bins.
# Reduced chi-squared =         0.9282 for     55 degrees of freedom
# Null hypothesis probability =   6.262948e-01

Photon flux (15-150 keV)    in 1 sec:  (    ) ph/cm2/s
Energy fluence (15-150 keV)             : 0 ( 0  0 ) ergs/cm2
Single BB
Spectral model blackbody:
------------------------------------------------------------
Parameters  : value    Lower 90%  Upper 90%
kT [keV]    : 18.5013  (-1.94321  2.26197)
R^2/D10^2   : 0.140383  (-0.0440096   0.0620967)
(R is the radius in km and D10 is the distance to the source in units of 10 kpc)
------------------------------------------------------------
#Fit statistic : Chi-Squared =         106.06 using 59 PHA bins.
# Reduced chi-squared =         1.8607 for     57 degrees of freedom
# Null hypothesis probability =   8.640957e-05

Energy  Fluence     90% Error
[keV]   [erg/cm2]   [erg/cm2]
15- 25  9.534e-09   1.393e-09
25- 50  4.499e-08   4.880e-09
50-150  1.125e-07   1.443e-08
15-150  1.671e-07   1.740e-08
Thermal bremsstrahlung (OTTB)
Spectral model: thermal bremsstrahlung
------------------------------------------------------------
Parameters  : value         Lower 90%    Upper 90%
kT [keV]    : 200.000       (-15.8384      -200)
Norm        : 9.84073       (-0.727717     0.727717)
------------------------------------------------------------
#Fit statistic : Chi-Squared =          74.73 using 59 PHA bins.
# Reduced chi-squared =          1.311 for     57 degrees of freedom
# Null hypothesis probability =   5.762642e-02

Energy  Fluence     90% Error
[keV]   [erg/cm2]   [erg/cm2]
15- 25  2.450e-08   2.245e-09
25- 50  4.713e-08   4.525e-09
50-150  1.034e-07   3.218e-08
15-150  1.750e-07   4.730e-08
Double BB

Spectral model: bbodyrad<1> + bbodyrad<2>
------------------------------------------------------------
Parameters  : value         Lower 90%    Upper 90%
kT1 [keV]   : 8.84666        (-2.04811      2.46247)
R1^2/D10^2  : 1.10650        (-0.559162      1.381)
kT2 [keV]   : 47.2661        (-16.3247      117.898)
R2^2/D10^2  : 6.61890E-03    (-0.00514495   0.0156469)
------------------------------------------------------------
#Fit statistic : Chi-Squared =          51.43 using 59 PHA bins.
# Reduced chi-squared =         0.9350 for     55 degrees of freedom
# Null hypothesis probability =   6.119428e-01

Energy  Fluence     90% Error
[keV]   [erg/cm2]   [erg/cm2]
15- 25  1.839e-08   4.945e-09
25- 50  4.659e-08   1.238e-08
50-150  1.514e-07   7.029e-08
15-150  2.163e-07   8.094e-08
Pre-slew spectrum (Pre-slew PHA with pre-slew DRM)
Power-law model

Spectral model in power-law:
------------------------------------------------------------
Parameters  : value       lower 90%   higher 90%
Photon index: 1.45856     ( -0.243515   0.246197 )
Norm@50keV  : 1.21644E-03    ( -0.000172933   0.00017114 )
------------------------------------------------------------
#Fit statistic : Chi-Squared =          47.28 using 59 PHA bins.
# Reduced chi-squared =         0.8295 for     57 degrees of freedom
# Null hypothesis probability =   8.170222e-01

Photon flux (15-150 keV)    in 73.3 sec: 0.150231 ( -0.0206896  0.020719 ) ph/cm2/s
Energy fluence (15-150 keV)             : 8.51922e-07 ( -1.3412e-07  1.36365e-07 ) ergs/cm2
Cutoff power-law model
Spectral model in the cutoff power-law:
------------------------------------------------------------
Parameters  : value       lower 90%   higher 90%
Photon index: 1.30860     ( -1.04374   0.390951 )
Epeak [keV] : 228.268      ( -228.265 -228.265 )
Norm@50keV  : 1.45218E-03    ( -0.000403078   0.00336388 )
------------------------------------------------------------
#Fit statistic : Chi-Squared =          47.20 using 59 PHA bins.
# Reduced chi-squared =         0.8429 for     56 degrees of freedom
# Null hypothesis probability =   7.925159e-01

Photon flux (15-150 keV)    in 73.3 sec: 0.149243 ( -0.021547  0.021299 ) ph/cm2/s
Energy fluence (15-150 keV)             : 8.41616e-07 ( -1.49506e-07  1.44885e-07 ) ergs/cm2
Band function

Spectral model in the Band function:
------------------------------------------------------------
Parameters  : value       lower 90%   higher 90%
alpha       : -1.30786   ( 1.15208   1.15208 )
beta        : -1.65903    ( 1.63548   11.6147 )
Epeak [keV] : 227.207      ( -226.434 -226.434 )
Norm@50keV   : 1.45338E-03    ( -0.000414567   0 )
------------------------------------------------------------
#Fit statistic : Chi-Squared =          47.20 using 59 PHA bins.
# Reduced chi-squared =         0.8582 for     55 degrees of freedom
# Null hypothesis probability =   7.635390e-01

Photon flux (15-150 keV)    in 73.3 sec:  (    ) ph/cm2/s
Energy fluence (15-150 keV)             : 0 ( 0  0 ) ergs/cm2
S(25-50 keV) vs. S(50-100 keV) plot

S(25-50 keV)  = 1.66e-06
S(50-100 keV) = 2.33e-06
T90 vs. Hardness ratio plot
T90                                   = 200.187999904156 sec.
Hardness ratio (energy fluence ratio) = 1.40361
Color vs. Color plot
Count Ratio  (25-50 keV) / (15-25 keV) = 1.38971
Count Ratio (50-100 keV) / (15-25 keV) = 1.06673
Mask shadow pattern

IMX = 0.140201622092, IMY = -0.38623325455
TIME vs. PHA plot around the trigger time
Blue+Cyan dotted lines: Time interval of the scaled map
From 0.000000 to 64.000000
TIME vs. DetID plot around the trigger time
Blue+Cyan dotted lines: Time interval of the scaled map
From 0.000000 to 64.000000
100 us light curve (15-350 keV)
Blue+Cyan dotted lines: Time interval of the scaled map
From 0.000000 to 64.000000
Spacecraft aspect plot

Bright source in the pre-burst/pre-slew/post-slew images
Pre-burst image of 15-350 keV band
Time interval of the image:
-17.499410 0.596000

# RAcent  DECcent POSerr Theta    Phi  PeakCts   SNR AngSep     Name
#  [deg]    [deg]    ['] [deg]  [deg]                   [']
135.6902 -40.4569    8.0  51.8   18.8   0.2976   1.5    9.4	Vela X-1
127.8659  15.3657    2.5  40.1   99.5   0.9227   4.6 ------	UNKNOWN
149.2154  53.4782    2.8  52.5  156.1   1.0301   4.2 ------	UNKNOWN
200.7789  46.4804    2.2  52.7 -161.9   0.6374   5.2 ------	UNKNOWN
Pre-slew background subtracted image of 15-350 keV band
Time interval of the image:
0.596000 73.900600

# RAcent  DECcent POSerr Theta    Phi  PeakCts   SNR AngSep     Name
#  [deg]    [deg]    ['] [deg]  [deg]                   [']
135.4689 -40.4681    5.8  51.9   18.9   1.8138   2.0    5.9	Vela X-1
144.5581  -0.5858    1.8  22.3   70.1   1.7040   6.4 ------	UNKNOWN
181.7213  55.5027    3.0  53.9  179.6   2.7169   3.9 ------	UNKNOWN
213.8152  35.4277    2.5  54.4 -143.6   4.9608   4.6 ------	UNKNOWN
Post-slew image of 15-350 keV band
Time interval of the image:
118.300590 520.800680

# RAcent  DECcent POSerr Theta    Phi  PeakCts   SNR AngSep     Name
#  [deg]    [deg]    ['] [deg]  [deg]                   [']
135.5309 -40.5491    0.6  40.8   -6.3   9.7194  19.9    0.4	Vela X-1
144.5246  -0.6068    0.6   0.0  173.9   6.8833  20.0 ------	UNKNOWN
184.3653  47.0385    3.9  59.0 -166.2   6.9393   3.0 ------	UNKNOWN
167.8610  -6.9441    2.6  24.1  -91.0   1.8100   4.5 ------	UNKNOWN
184.7662  21.3466    2.8  45.0 -138.5   3.1592   4.1 ------	UNKNOWN
174.1213 -34.0324    2.8  43.4  -53.4   4.3099   4.1 ------	UNKNOWN
Plot creation:
Thu Oct  8 19:28:19 EDT 2015