Special notes of this burst
Image
Pre-slew 15.0-50.0 keV image (Event data)
#RAcent DECcent POSerr Theta  Phi  Peak_Cts  SNR Name
222.361 73.125 0.000 16.959 71.644 0.802 7.770 TRIG_00618032

Image time interval: 0.000 to 120.000 [sec]
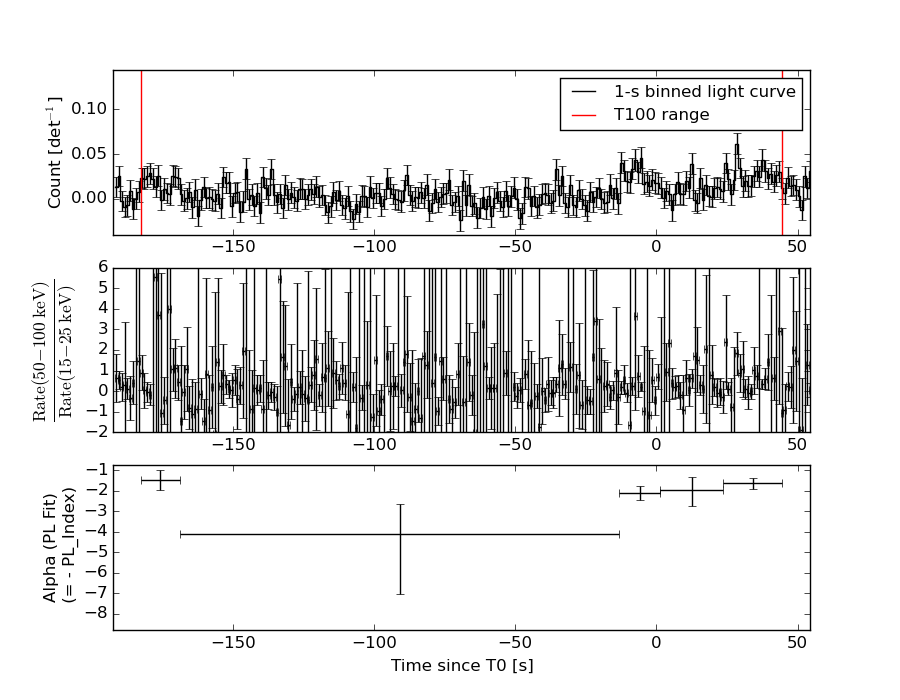
Lightcurves
Notes:
- 1) The mask-weighted light curves are using the flight position.
- 2) Multiple plots of different time binning/intervals are shown to cover all scenarios of short/long GRBs, rate/image triggers, and real/false positives.
- 3) For all the mask-weighted lightcurves, the y-axis units are counts/sec/det where a det is 0.4 x 0.4 = 0.16 sq cm.
- 4) The verticle lines correspond to following: green dotted lines are T50 interval, black dotted lines are T90 interval, blue solid line(s) is a spacecraft slew start time, and orange solid line(s) is a spacecraft slew end time.
- 5) Time of each bin is in the middle of the bin.
1 s binning
From T0-310 s to T0+310 s
From T100_start - 20 s to T100_end + 30 s
Full time interval
64 ms binning
Full time interval
From T100_start to T100_end
From T0-5 sec to T0+5 sec
16 ms binning
From T100_start-5 s to T100_start+5 s
8 ms binning
From T100_start-3 s to T100_start+3 s
2 ms binning
From T100_start-1 s to T100_start+1 s
SN=5 or 10 sec. binning (whichever binning is satisfied first)
SN=5 or 10 sec. binning (T < 200 sec)
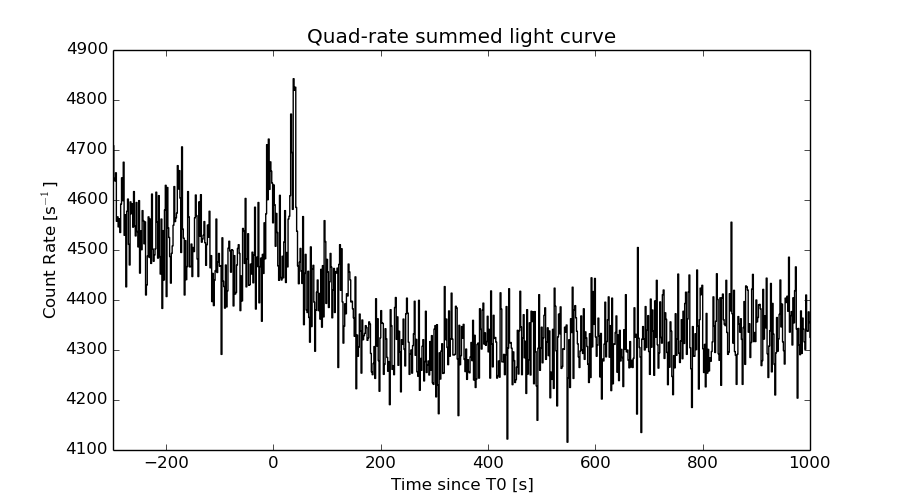
Quad-rate summed light curves (from T0-300s to T0+1000s)
Spectral Evolution
Spectra
Notes:
- 1) The fitting includes the systematic errors.
- 2) When the burst includes telescope slew time periods, the fitting uses an average response file made from multiple 5-s response files through out the slew time plus single time preiod for the non-slew times, and weighted by the total counts in the corresponding time period using addrmf. An average response file is needed becuase a spectral fit using the pre-slew DRM will introduce some errors in both a spectral shape and a normalization if the PHA file contains a lot of the slew/post-slew time interval.
- 3) For fits to more complicated models (e.g. a power-law over a cutoff power-law), the BAT team has decided to require a chi-square improvement of more than 6 for each extra dof.
Time averaged spectrum fit using the average DRM
Power-law model
Time interval is from -182.784 sec. to   44.408 sec.

Spectral model in power-law:
------------------------------------------------------------
Parameters  : value       lower 90%   higher 90%
Photon index: 2.18042     ( -0.315755   0.359451 )
Norm@50keV  : 3.86038E-04    ( -9.51674e-05   9.15925e-05 )
------------------------------------------------------------
#Fit statistic : Chi-Squared =          61.66 using 59 PHA bins.
# Reduced chi-squared =          1.082 for     57 degrees of freedom
# Null hypothesis probability =   3.132065e-01

Photon flux (15-150 keV)    in 227.2 sec: 6.32592E-02 ( -0.00997662  0.00997958 ) ph/cm2/s
Energy fluence (15-150 keV)             : 8.22437e-07 ( -1.68572e-07  1.77028e-07 ) ergs/cm2
Cutoff power-law model
Time interval is from -182.784 sec. to   44.408 sec.
Spectral model in the cutoff power-law:
------------------------------------------------------------
Parameters  : value       lower 90%   higher 90%
Photon index: 1.97281     (     )
Epeak [keV] : 5.24088      ( -4.32987 -5.24088 )
Norm@50keV  : 5.13915E-04    (     )
------------------------------------------------------------
#Fit statistic : Chi-Squared =          61.57 using 59 PHA bins.
# Reduced chi-squared =          1.099 for     56 degrees of freedom
# Null hypothesis probability =   2.836860e-01

Photon flux (15-150 keV)    in 227.2 sec: 6.28871E-02 ( -0.0100434  0.0101415 ) ph/cm2/s
Energy fluence (15-150 keV)             : 8.06292e-07 ( -1.83732e-07  1.8923e-07 ) ergs/cm2
Band function
Time interval is from -182.784 sec. to   44.408 sec.

Spectral model in the Band function:
------------------------------------------------------------
Parameters  : value       lower 90%   higher 90%
alpha       : -1.96182   ( -3.27593   0.489223 )
beta        : -10.00000    ( 10   20 )
Epeak [keV] : 7.02604      ( -4.44297 -7.02604 )
Norm@50keV   : 5.21066E-04    ( -8.19383e-05   0.000750318 )
------------------------------------------------------------
#Fit statistic : Chi-Squared =          61.57 using 59 PHA bins.
# Reduced chi-squared =          1.119 for     55 degrees of freedom
# Null hypothesis probability =   2.527745e-01

Photon flux (15-150 keV)    in 227.2 sec:  (    ) ph/cm2/s
Energy fluence (15-150 keV)             : 8.09214e-07 ( 0  0 ) ergs/cm2
Single BB
Spectral model blackbody:
------------------------------------------------------------
Parameters  : value    Lower 90%  Upper 90%
kT [keV]    : 7.99941  (-1.67915  2.2065)
R^2/D10^2   : 6.74269E-02  (-0.0408502   0.104455)
(R is the radius in km and D10 is the distance to the source in units of 10 kpc)
------------------------------------------------------------
#Fit statistic : Chi-Squared =          73.67 using 59 PHA bins.
# Reduced chi-squared =          1.292 for     57 degrees of freedom
# Null hypothesis probability =   6.784987e-02

Energy  Fluence     90% Error
[keV]   [erg/cm2]   [erg/cm2]
15- 25  1.773e-07   5.369e-08
25- 50  3.102e-07   8.717e-08
50-150  8.143e-08   4.535e-08
15-150  5.689e-07   1.471e-07
Thermal bremsstrahlung (OTTB)
Spectral model: thermal bremsstrahlung
------------------------------------------------------------
Parameters  : value         Lower 90%    Upper 90%
kT [keV]    : 50.1775       (-19.1058      38.4557)
Norm        : 0.357336       (-0.0890639     0.137921)
------------------------------------------------------------
#Fit statistic : Chi-Squared =          62.46 using 59 PHA bins.
# Reduced chi-squared =          1.096 for     57 degrees of freedom
# Null hypothesis probability =   2.884094e-01

Energy  Fluence     90% Error
[keV]   [erg/cm2]   [erg/cm2]
15- 25  1.987e-07   4.092e-08
25- 50  2.857e-07   6.590e-08
50-150  2.783e-07   1.274e-07
15-150  7.627e-07   2.047e-07
Double BB
Spectral model: bbodyrad<1> + bbodyrad<2>
------------------------------------------------------------
Parameters  : value         Lower 90%    Upper 90%
kT1 [keV]   : 4.50557        (-1.50896      1.7615)
R1^2/D10^2  : 0.519828        (-0.381861      2.98598)
kT2 [keV]   : 17.6690        (-5.71132      10.6289)
R2^2/D10^2  : 2.32952E-03    (-0.00194405   0.00879988)
------------------------------------------------------------
#Fit statistic : Chi-Squared =          60.32 using 59 PHA bins.
# Reduced chi-squared =          1.097 for     55 degrees of freedom
# Null hypothesis probability =   2.893742e-01

Energy  Fluence     90% Error
[keV]   [erg/cm2]   [erg/cm2]
15- 25  2.191e-07   1.231e-07
25- 50  2.448e-07   1.268e-07
50-150  3.444e-07   2.103e-07
15-150  8.082e-07   4.292e-07
Peak spectrum fit
Power-law model
Time interval is from   28.472 sec. to   29.472 sec.

Spectral model in power-law:
------------------------------------------------------------
Parameters  : value       lower 90%   higher 90%
Photon index: 1.55048     ( -0.68807   0.732391 )
Norm@50keV  : 3.19583E-03    ( -0.00127594   0.00118161 )
------------------------------------------------------------
#Fit statistic : Chi-Squared =          52.86 using 59 PHA bins.
# Reduced chi-squared =         0.9274 for     57 degrees of freedom
# Null hypothesis probability =   6.309151e-01

Photon flux (15-150 keV)    in 1 sec: 0.404629 ( -0.142951  0.143202 ) ph/cm2/s
Energy fluence (15-150 keV)             : 3.00837e-08 ( -1.23173e-08  1.27796e-08 ) ergs/cm2
Cutoff power-law model
Time interval is from   28.472 sec. to   29.472 sec.
Spectral model in the cutoff power-law:
------------------------------------------------------------
Parameters  : value       lower 90%   higher 90%
Photon index: 2.02428     (     )
Epeak [keV] : 9.69749      (   )
Norm@50keV  : 1.78847E-03    (     )
------------------------------------------------------------
#Fit statistic : Chi-Squared =          52.69 using 59 PHA bins.
# Reduced chi-squared =         0.9408 for     56 degrees of freedom
# Null hypothesis probability =   6.010970e-01

Photon flux (15-150 keV)    in 1 sec: 0.405741 ( -0.144158  0.142263 ) ph/cm2/s
Energy fluence (15-150 keV)             : 3.01555e-08 ( -1.24364e-08  1.2455e-08 ) ergs/cm2
Band function
Time interval is from   28.472 sec. to   29.472 sec.

Spectral model in the Band function:
------------------------------------------------------------
Parameters  : value       lower 90%   higher 90%
alpha       : -1.12590   ( 1.12079   1.12079 )
beta        : -1.56117    ( 1.56592   0.700579 )
Epeak [keV] : 47.2472      ( -45.4076 -45.4076 )
Norm@50keV   : 6.85127E-03    ( -0.00733132   510522 )
------------------------------------------------------------
#Fit statistic : Chi-Squared =          52.85 using 59 PHA bins.
# Reduced chi-squared =         0.9609 for     55 degrees of freedom
# Null hypothesis probability =   5.573238e-01

Photon flux (15-150 keV)    in 1 sec:  (    ) ph/cm2/s
Energy fluence (15-150 keV)             : 0 ( 0  0 ) ergs/cm2
Single BB
Spectral model blackbody:
------------------------------------------------------------
Parameters  : value    Lower 90%  Upper 90%
kT [keV]    : 12.6886  (-7.18742  21.0803)
R^2/D10^2   : 7.59342E-02  (-0.0754302   1.65194)
(R is the radius in km and D10 is the distance to the source in units of 10 kpc)
------------------------------------------------------------
#Fit statistic : Chi-Squared =          57.80 using 59 PHA bins.
# Reduced chi-squared =          1.014 for     57 degrees of freedom
# Null hypothesis probability =   4.454039e-01

Energy  Fluence     90% Error
[keV]   [erg/cm2]   [erg/cm2]
15- 25  2.975e-09   2.029e-09
25- 50  8.923e-09   5.705e-09
50-150  6.937e-09   5.265e-09
15-150  1.883e-08   1.233e-08
Thermal bremsstrahlung (OTTB)
Spectral model: thermal bremsstrahlung
------------------------------------------------------------
Parameters  : value         Lower 90%    Upper 90%
kT [keV]    : 199.363       (-199.363      -199.363)
Norm        : 1.63871       (-0.577995     0.885657)
------------------------------------------------------------
#Fit statistic : Chi-Squared =          53.21 using 59 PHA bins.
# Reduced chi-squared =         0.9335 for     57 degrees of freedom
# Null hypothesis probability =   6.179924e-01

Energy  Fluence     90% Error
[keV]   [erg/cm2]   [erg/cm2]
15- 25  4.080e-09   2.599e-09
25- 50  7.850e-09   4.957e-09
50-150  1.721e-08   1.094e-08
15-150  2.915e-08   1.800e-08
Double BB
Spectral model: bbodyrad<1> + bbodyrad<2>
------------------------------------------------------------
Parameters  : value         Lower 90%    Upper 90%
kT1 [keV]   : 5.88790        (-2.69828      5.17841)
R1^2/D10^2  : 1.06670        (-0.966082      13.6166)
kT2 [keV]   : 40.2706        (-40.2753      -40.2756)
R2^2/D10^2  : 1.50959E-03    (-0.00147616   0.0232221)
------------------------------------------------------------
#Fit statistic : Chi-Squared =          51.65 using 59 PHA bins.
# Reduced chi-squared =         0.9391 for     55 degrees of freedom
# Null hypothesis probability =   6.033820e-01

Energy  Fluence     90% Error
[keV]   [erg/cm2]   [erg/cm2]
15- 25  5.094e-09   3.142e-09
25- 50  6.722e-09   3.800e-09
50-150  2.110e-08   1.290e-08
15-150  3.291e-08   1.769e-08
Pre-slew spectrum (Pre-slew PHA with pre-slew DRM)
Power-law model

Spectral model in power-law:
------------------------------------------------------------
Parameters  : value       lower 90%   higher 90%
Photon index: 2.18042     ( -0.315755   0.359451 )
Norm@50keV  : 3.86038E-04    ( -9.51674e-05   9.15925e-05 )
------------------------------------------------------------
#Fit statistic : Chi-Squared =          61.66 using 59 PHA bins.
# Reduced chi-squared =          1.082 for     57 degrees of freedom
# Null hypothesis probability =   3.132065e-01

Photon flux (15-150 keV)    in 227.2 sec: 6.32592E-02 ( -0.00997662  0.00997958 ) ph/cm2/s
Energy fluence (15-150 keV)             : 8.22437e-07 ( -1.68572e-07  1.77028e-07 ) ergs/cm2
Cutoff power-law model

Spectral model in the cutoff power-law:
------------------------------------------------------------
Parameters  : value       lower 90%   higher 90%
Photon index: 1.97281     (     )
Epeak [keV] : 5.24088      (   )
Norm@50keV  : 5.13915E-04    (     )
------------------------------------------------------------
#Fit statistic : Chi-Squared =          61.57 using 59 PHA bins.
# Reduced chi-squared =          1.099 for     56 degrees of freedom
# Null hypothesis probability =   2.836860e-01

Photon flux (15-150 keV)    in 227.2 sec: 6.28871E-02 ( -0.0100434  0.0101415 ) ph/cm2/s
Energy fluence (15-150 keV)             : 8.06292e-07 ( -1.83732e-07  1.8923e-07 ) ergs/cm2
Band function

Spectral model in the Band function:
------------------------------------------------------------
Parameters  : value       lower 90%   higher 90%
alpha       : -1.96182   ( -3.27593   0.489218 )
beta        : -10.00000    ( 10   20 )
Epeak [keV] : 7.02604      ( -4.44297 -7.02604 )
Norm@50keV   : 5.21066E-04    ( -8.19383e-05   0.000750323 )
------------------------------------------------------------
#Fit statistic : Chi-Squared =          61.57 using 59 PHA bins.
# Reduced chi-squared =          1.119 for     55 degrees of freedom
# Null hypothesis probability =   2.527745e-01

Photon flux (15-150 keV)    in 227.2 sec:  (    ) ph/cm2/s
Energy fluence (15-150 keV)             : 8.09214e-07 ( 0  0 ) ergs/cm2
S(25-50 keV) vs. S(50-100 keV) plot
S(25-50 keV)  = 2.59e-07
S(50-100 keV) = 2.29e-07
T90 vs. Hardness ratio plot

T90                                   = 220.503999948502 sec.
Hardness ratio (energy fluence ratio) = 0.88417
Color vs. Color plot

Count Ratio  (25-50 keV) / (15-25 keV) = 0.951725
Count Ratio (50-100 keV) / (15-25 keV) = 0.490313
Mask shadow pattern
IMX = 0.0960353381593, IMY = -0.289433727127
TIME vs. PHA plot around the trigger time
TIME vs. DetID plot around the trigger time
100 us light curve (15-350 keV)
Spacecraft aspect plot

Bright source in the pre-burst/pre-slew/post-slew images
Pre-burst image of 15-350 keV band
Time interval of the image:
-658.499390 -641.258100
-239.000000 -182.784000

# RAcent  DECcent POSerr Theta    Phi  PeakCts   SNR AngSep     Name
#  [deg]    [deg]    ['] [deg]  [deg]                   [']
254.4266  35.3848    6.1  27.2 -151.9   0.1856   1.9    3.0	Her X-1
299.5695  35.2427    5.9  50.9  161.3   0.7125   2.0    2.7	Cyg X-1
308.0997  40.9620   44.2  51.3  150.0   0.1396   0.3    0.7	Cyg X-3
140.7853  50.3625    2.8  49.3   20.9   1.2942   4.1 ------	UNKNOWN
250.3696  10.8906    2.4  48.4 -130.4   2.1756   4.7 ------	UNKNOWN
251.5612  10.5095    2.3  49.1 -131.8   2.4371   5.1 ------	UNKNOWN
Pre-slew background subtracted image of 15-350 keV band
Time interval of the image:
-182.784000 44.408000

# RAcent  DECcent POSerr Theta    Phi  PeakCts   SNR AngSep     Name
#  [deg]    [deg]    ['] [deg]  [deg]                   [']
254.5248  35.1588    0.0  27.4 -151.8  -0.1168  -0.3   11.5	Her X-1
299.4541  35.3049    4.7  50.8  161.3  -2.8440  -2.5    9.1	Cyg X-1
307.9657  40.9048    5.0  51.3  150.1   4.2286   2.3    7.2	Cyg X-3
222.1858  73.1717    2.4  17.0   71.5   1.8143   4.8 ------	UNKNOWN
272.0286  10.7380    2.5  56.5 -155.4   6.0434   4.5 ------	UNKNOWN
253.4361  10.1043    2.3  50.0 -133.9   8.0436   5.1 ------	UNKNOWN
Post-slew image of 15-350 keV band
Time interval of the image:
168.700600 963.040000

# RAcent  DECcent POSerr Theta    Phi  PeakCts   SNR AngSep     Name
#  [deg]    [deg]    ['] [deg]  [deg]                   [']
254.4190  35.4963   20.2  40.9 -129.2  -0.5325  -0.6    9.4	Her X-1
299.5971  35.1883    2.4  52.9 -177.5   6.8839   4.8    0.9	Cyg X-1
308.0634  40.9369    3.2  50.0  171.8   4.3593   3.6    2.3	Cyg X-3
 63.0547  70.6182    2.9  35.7   80.5   5.0375   4.0 ------	UNKNOWN
237.3776  64.8178    2.5   9.8 -128.2   1.9452   4.6 ------	UNKNOWN
270.9505  43.9856    2.4  36.6 -152.8   2.5907   4.9 ------	UNKNOWN
211.2737  31.3100    2.4  42.2  -73.8   8.6616   4.8 ------	UNKNOWN
Plot creation:
Mon Oct  5 00:58:47 EDT 2015