Special notes of this burst
Image
Pre-slew 15.0-350.0 keV image (Event data)
#   RAcent    DECcent   POSerr    Theta     Phi              Peak Cts       SNR   Name
  122.6472    22.2107   0.0236    31.2293   116.2961         2.8631846      8.117 TRIG_00619182

Foreground time interval of the image:
110.328 299.501 (delta_t = 189.173 [sec])
Background time interval of the image:
-239.000 110.328 (delta_t = 349.328 [sec])
Lightcurves
Notes:
- 1) All plots contain as much data as has been downloaded to date.
- 2) The mask-weighted light curves are using the flight position.
- 3) Multiple plots of different time binning/intervals are shown to cover all scenarios of short/long GRBs, rate/image triggers, and real/false positives.
- 4) For all the mask-weighted lightcurves, the y-axis units are counts/sec/det where a det is 0.4 x 0.4 = 0.16 sq cm.
- 5) The verticle lines correspond to following: green dotted lines are T50 interval, black dotted lines are T90 interval, blue solid line(s) is a spacecraft slew start time, and orange solid line(s) is a spacecraft slew end time.
- 6) Time of each bin is in the middle of the bin.
1 s binning
From T0-310 s to T0+310 s
From T100_start - 20 s to T100_end + 30 s

Full time interval

64 ms binning
Full time interval

From T100_start to T100_end

From T0-5 sec to T0+5 sec
16 ms binning
From T100_start-5 s to T100_start+5 s

8 ms binning
From T100_start-3 s to T100_start+3 s
2 ms binning
From T100_start-1 s to T100_start+1 s

SN=5 or 10 sec. binning (whichever binning is satisfied first)

SN=5 or 10 sec. binning (T < 200 sec)

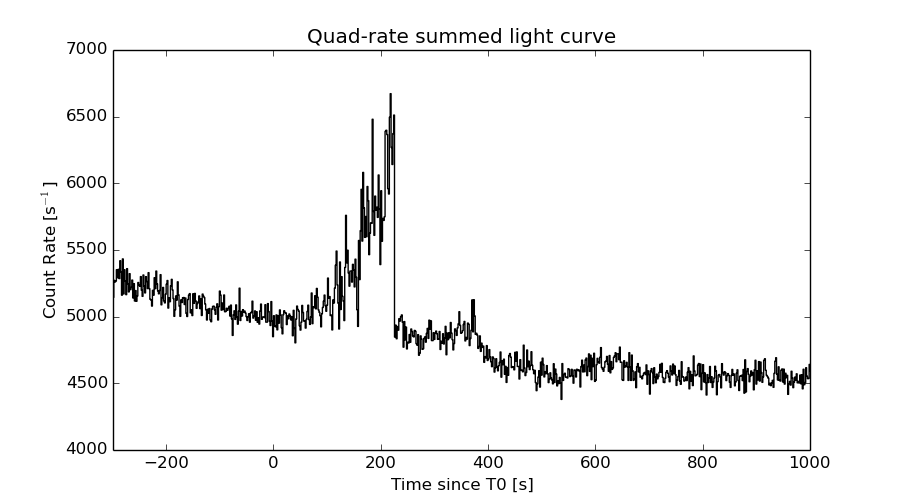
Quad-rate summed light curves (from T0-300s to T0+1000s)
Spectral Evolution

Spectra
Notes:
- 1) The fitting includes the systematic errors.
- 2) For long bursts, a spectral fit of the pre-slew DRM will introduce some errors in both a spectral shape and a normalization if the PHA file contains a lot of the slew/post-slew time interval.
- 3) For fits to more complicated models (e.g. a power-law over a cutoff power-law), the BAT team has decided to require a chi-square improvement of more than 6 for each extra dof.
- 4) For short bursts (T90<1sec), the specrtum is also fit with Blackbody, OTTB, and Double Blackbody.
Time averaged spectrum fit using the pre-slew DRM
Power-law model

Time interval is from  110.328 sec. to  663.040 sec.

Spectral model in power-law:
------------------------------------------------------------
Parameters  : value       lower 90%   higher 90%
Photon index: 1.73826     ( -0.127621   0.13089 )
Norm@50keV  : 8.50459E-04    ( -7.28712e-05   7.18454e-05 )
------------------------------------------------------------
#Fit statistic : Chi-Squared =          67.06 using 59 PHA bins.
# Reduced chi-squared =          1.176 for     57 degrees of freedom
# Null hypothesis probability =   1.702774e-01

Photon flux (15-150 keV)    in 552.7 sec: 0.114503 ( -0.00832613  0.0083261 ) ph/cm2/s
Energy fluence (15-150 keV)             : 4.34036e-06 ( -3.85692e-07  3.90719e-07 ) ergs/cm2
Cutoff power-law model

Time interval is from  110.328 sec. to  663.040 sec.
Spectral model in the cutoff power-law:
------------------------------------------------------------
Parameters  : value       lower 90%   higher 90%
Photon index: 1.41616     ( -0.577127   0.389788 )
Epeak [keV] : 77.8705      ( -27.267 -77.8821 )
Norm@50keV  : 1.30151E-03    ( -0.000504568   0.00147508 )
------------------------------------------------------------
#Fit statistic : Chi-Squared =          65.88 using 59 PHA bins.
# Reduced chi-squared =          1.176 for     56 degrees of freedom
# Null hypothesis probability =   1.720734e-01

Photon flux (15-150 keV)    in 552.7 sec: 0.113300 ( -0.008549  0.008523 ) ph/cm2/s
Energy fluence (15-150 keV)             : 4.1868e-06 ( -4.54756e-07  4.5758e-07 ) ergs/cm2
Band function

Time interval is from  110.328 sec. to  663.040 sec.

Spectral model in the Band function:
------------------------------------------------------------
Parameters  : value       lower 90%   higher 90%
alpha       : -0.697008   ( -1.36346   0.695939 )
beta        : -1.99610    ( 1.99491   0.356744 )
Epeak [keV] : 43.7551      ( -18.9375 86.9151 )
Norm@50keV   : 3.88913E-03    ( -0.00243808   53.7816 )
------------------------------------------------------------
#Fit statistic : Chi-Squared =          63.85 using 59 PHA bins.
# Reduced chi-squared =          1.161 for     55 degrees of freedom
# Null hypothesis probability =   1.934873e-01

Photon flux (15-150 keV)    in 552.7 sec:  (    ) ph/cm2/s
Energy fluence (15-150 keV)             : 4.18142e-06 ( 0  0 ) ergs/cm2
Single BB

Spectral model blackbody:
------------------------------------------------------------
Parameters  : value    Lower 90%  Upper 90%
kT [keV]    : 10.7967  (-0.922397  1.03358)
R^2/D10^2   : 4.12230E-02  (-0.0118716   0.0162264)
(R is the radius in km and D10 is the distance to the source in units of 10 kpc)
------------------------------------------------------------
#Fit statistic : Chi-Squared =         103.63 using 59 PHA bins.
# Reduced chi-squared =         1.8181 for     57 degrees of freedom
# Null hypothesis probability =   1.575501e-04

Energy  Fluence     90% Error
[keV]   [erg/cm2]   [erg/cm2]
15- 25  5.528e-07   6.353e-08
25- 50  1.526e-06   1.280e-07
50-150  9.900e-07   1.918e-07
15-150  3.068e-06   2.775e-07
Thermal bremsstrahlung (OTTB)

Spectral model: thermal bremsstrahlung
------------------------------------------------------------
Parameters  : value         Lower 90%    Upper 90%
kT [keV]    : 111.612       (-30.0571      45.0221)
Norm        : 0.494270       (-0.0446568     0.0557119)
------------------------------------------------------------
#Fit statistic : Chi-Squared =          65.96 using 59 PHA bins.
# Reduced chi-squared =          1.157 for     57 degrees of freedom
# Null hypothesis probability =   1.946799e-01

Energy  Fluence     90% Error
[keV]   [erg/cm2]   [erg/cm2]
15- 25  7.132e-07   7.683e-08
25- 50  1.259e-06   1.194e-07
50-150  2.167e-06   8.017e-07
15-150  4.139e-06   8.708e-07
Double BB

Spectral model: bbodyrad<1> + bbodyrad<2>
------------------------------------------------------------
Parameters  : value         Lower 90%    Upper 90%
kT1 [keV]   : 7.61942        (-1.33956      1.26853)
R1^2/D10^2  : 0.117310        (-0.046005      0.0548071)
kT2 [keV]   : 32.2920        (-10.7792      31.2095)
R2^2/D10^2  : 5.31012E-04    (-0.000446762   0.00114974)
------------------------------------------------------------
#Fit statistic : Chi-Squared =          64.10 using 59 PHA bins.
# Reduced chi-squared =          1.165 for     55 degrees of freedom
# Null hypothesis probability =   1.876464e-01

Energy  Fluence     90% Error
[keV]   [erg/cm2]   [erg/cm2]
15- 25  7.005e-07   1.345e-07
25- 50  1.342e-06   3.023e-07
50-150  2.304e-06   1.103e-06
15-150  4.346e-06   1.362e-06
Peak spectrum fit
Power-law model

Time interval is from    0.000 sec. to    0.000 sec.

Spectral model in power-law:
------------------------------------------------------------
Parameters  : value       lower 90%   higher 90%
Photon index: 1.84620     ( -0.500962   0.609175 )
Norm@50keV  : 6.27911E-03    ( -0.00236307   0.00218631 )
------------------------------------------------------------
#Fit statistic : Chi-Squared =          62.79 using 59 PHA bins.
# Reduced chi-squared =          1.102 for     57 degrees of freedom
# Null hypothesis probability =   2.785910e-01

Photon flux (15-150 keV)    in 1 sec: 0.881234 ( -0.252982  0.252983 ) ph/cm2/s
Energy fluence (15-150 keV)             : 5.77384e-08 ( -2.03206e-08  2.13879e-08 ) ergs/cm2
Cutoff power-law model

Time interval is from    0.000 sec. to    0.000 sec.
Spectral model in the cutoff power-law:
------------------------------------------------------------
Parameters  : value       lower 90%   higher 90%
Photon index: 1.03738     ( -3.60239   1.15704 )
Epeak [keV] : 56.5417      (   )
Norm@50keV  : 1.69157E-02    (     )
------------------------------------------------------------
#Fit statistic : Chi-Squared =          62.39 using 59 PHA bins.
# Reduced chi-squared =          1.114 for     56 degrees of freedom
# Null hypothesis probability =   2.594372e-01

Photon flux (15-150 keV)    in 1 sec: 0.861905 ( -0.263056  0.255215 ) ph/cm2/s
Energy fluence (15-150 keV)             : 5.55387e-08 ( -1.95168e-08  2.20956e-08 ) ergs/cm2
Band function

Time interval is from    0.000 sec. to    0.000 sec.

Spectral model in the Band function:
------------------------------------------------------------
Parameters  : value       lower 90%   higher 90%
alpha       : -1.07195   ( -1.63661   3.27629 )
beta        : -9.37122    ( 9.37159   19.3716 )
Epeak [keV] : 56.8003      ( -28.8235 -56.4029 )
Norm@50keV   : 1.62464E-02    ( -0.016794   0.0136113 )
------------------------------------------------------------
#Fit statistic : Chi-Squared =          62.39 using 59 PHA bins.
# Reduced chi-squared =          1.134 for     55 degrees of freedom
# Null hypothesis probability =   2.300532e-01

Photon flux (15-150 keV)    in 1 sec:  (    ) ph/cm2/s
Energy fluence (15-150 keV)             : 5.54593e-08 ( 0  0 ) ergs/cm2
Single BB

Spectral model blackbody:
------------------------------------------------------------
Parameters  : value    Lower 90%  Upper 90%
kT [keV]    : 13.3957  (-3.53492  4.59292)
R^2/D10^2   : 0.150427  (-0.15043   0.293186)
(R is the radius in km and D10 is the distance to the source in units of 10 kpc)
------------------------------------------------------------
#Fit statistic : Chi-Squared =          63.92 using 59 PHA bins.
# Reduced chi-squared =          1.121 for     57 degrees of freedom
# Null hypothesis probability =   2.466357e-01

Energy  Fluence     90% Error
[keV]   [erg/cm2]   [erg/cm2]
15- 25  5.720e-09   3.455e-09
25- 50  2.034e-08   1.215e-08
50-150  2.347e-08   1.577e-08
15-150  4.953e-08   2.939e-08
Thermal bremsstrahlung (OTTB)

Spectral model: thermal bremsstrahlung
------------------------------------------------------------
Parameters  : value         Lower 90%    Upper 90%
kT [keV]    : 93.9022       (-55.5636      -93.9081)
Norm        : 3.99015       (-1.29443     2.04969)
------------------------------------------------------------
#Fit statistic : Chi-Squared =          62.46 using 59 PHA bins.
# Reduced chi-squared =          1.096 for     57 degrees of freedom
# Null hypothesis probability =   2.884847e-01

Energy  Fluence     90% Error
[keV]   [erg/cm2]   [erg/cm2]
15- 25  1.042e-08   6.395e-09
25- 50  1.779e-08   1.077e-08
50-150  2.779e-08   2.243e-08
15-150  5.600e-08   3.880e-08
Double BB

Spectral model: bbodyrad<1> + bbodyrad<2>
------------------------------------------------------------
Parameters  : value         Lower 90%    Upper 90%
kT1 [keV]   : 2.63701        (-2.38085      2.8285)
R1^2/D10^2  : 82.7201        (-82.1465      -83.6636)
kT2 [keV]   : 15.5644        (-4.24881      7.02859)
R2^2/D10^2  : 7.87185E-02    (-0.0599158   0.174255)
------------------------------------------------------------
#Fit statistic : Chi-Squared =          59.24 using 59 PHA bins.
# Reduced chi-squared =          1.077 for     55 degrees of freedom
# Null hypothesis probability =   3.237589e-01

Energy  Fluence     90% Error
[keV]   [erg/cm2]   [erg/cm2]
15- 25  1.059e-08   5.330e-09
25- 50  1.689e-08   1.022e-08
50-150  2.729e-08   1.805e-08
15-150  5.478e-08   3.027e-08
Pre-slew spectrum (Pre-slew PHA with pre-slew DRM)
Power-law model

Spectral model in power-law:
------------------------------------------------------------
Parameters  : value       lower 90%   higher 90%
Photon index: 1.69242     ( -0.181499   0.185505 )
Norm@50keV  : 1.43457E-03    ( -0.000161193   0.000158654 )
------------------------------------------------------------
#Fit statistic : Chi-Squared =          56.87 using 59 PHA bins.
# Reduced chi-squared =         0.9977 for     57 degrees of freedom
# Null hypothesis probability =   4.800189e-01

Photon flux (15-150 keV)    in 189.2 sec: 0.190025 ( -0.0193296  0.0193423 ) ph/cm2/s
Energy fluence (15-150 keV)             : 2.51456e-06 ( -2.95827e-07  3.00189e-07 ) ergs/cm2
Cutoff power-law model

Spectral model in the cutoff power-law:
------------------------------------------------------------
Parameters  : value       lower 90%   higher 90%
Photon index: 1.65088     ( -0.762966   0.769685 )
Epeak [keV] : 357.961      (   )
Norm@50keV  : 1.51321E-03    (     )
------------------------------------------------------------
#Fit statistic : Chi-Squared =          56.87 using 59 PHA bins.
# Reduced chi-squared =          1.015 for     56 degrees of freedom
# Null hypothesis probability =   4.426201e-01

Photon flux (15-150 keV)    in 189.2 sec: 0.189751 ( -0.019992  0.019561 ) ph/cm2/s
Energy fluence (15-150 keV)             : 2.49814e-06 ( -3.44666e-07  3.14621e-07 ) ergs/cm2
Band function

Spectral model in the Band function:
------------------------------------------------------------
Parameters  : value       lower 90%   higher 90%
alpha       : 2.29518   ( -2.29523   -2.29523 )
beta        : -1.82621    ( -0.308425   0.240663 )
Epeak [keV] : 27.2714      ( -27.2727 76.051 )
Norm@50keV   : 1.29537    ( -1.296   65.1372 )
------------------------------------------------------------
#Fit statistic : Chi-Squared =          55.10 using 59 PHA bins.
# Reduced chi-squared =          1.002 for     55 degrees of freedom
# Null hypothesis probability =   4.707830e-01

Photon flux (15-150 keV)    in 189.2 sec:  (    ) ph/cm2/s
Energy fluence (15-150 keV)             : 0 ( 0  0 ) ergs/cm2
S(25-50 keV) vs. S(50-100 keV) plot

S(25-50 keV)  = 1.19e-06
S(50-100 keV) = 1.43e-06
T90 vs. Hardness ratio plot
T90                                   = 481.003999948502 sec.
Hardness ratio (energy fluence ratio) = 1.20168
Color vs. Color plot
Count Ratio  (25-50 keV) / (15-25 keV) = 1.32747
Count Ratio (50-100 keV) / (15-25 keV) = 0.68573
Mask shadow pattern

IMX = -2.686058087698555E-01, IMY = -5.435764145163795E-01
TIME vs. PHA plot around the trigger time

TIME vs. DetID plot around the trigger time
100 us light curve (15-350 keV)

Spacecraft aspect plot

Bright source in the pre-burst/pre-slew/post-slew images
Pre-burst image of 15-350 keV band
Time interval of the image:
-239.000000 110.328000

# RAcent  DECcent POSerr Theta    Phi  PeakCts   SNR AngSep     Name
#  [deg]    [deg]    ['] [deg]  [deg]                   [']
135.4625 -40.5880    3.5  40.8  -11.4   1.3638   3.3    3.6	Vela X-1
146.1964  22.7657    2.8  23.4  161.9   1.2073   4.2 ------	UNKNOWN
131.6486 -19.4066    2.9  22.7   11.1   1.0546   4.0 ------	UNKNOWN
188.4159  43.6033    2.6  59.0 -166.1   8.7204   4.4 ------	UNKNOWN
194.6181  26.2664    7.4  55.2 -145.1   3.4277   1.6 ------	UNKNOWN
Pre-slew background subtracted image of 15-350 keV band
Time interval of the image:
110.328000 299.500600

# RAcent  DECcent POSerr Theta    Phi  PeakCts   SNR AngSep     Name
#  [deg]    [deg]    ['] [deg]  [deg]                   [']
135.4188 -40.5813   26.3  40.8  -11.4  -0.1202  -0.4    5.3	Vela X-1
122.6471  22.2107    1.4  31.2  116.3   2.8621   8.1 ------	UNKNOWN
104.2405 -36.8199    2.5  51.9   19.1   3.6200   4.6 ------	UNKNOWN
Post-slew image of 15-350 keV band
Time interval of the image:
351.500600 572.300610

# RAcent  DECcent POSerr Theta    Phi  PeakCts   SNR AngSep     Name
#  [deg]    [deg]    ['] [deg]  [deg]                   [']
 83.7837  22.1441    0.0  35.9   86.4  -0.7722  -1.5   11.4	Crab
 92.0572  15.6373    2.8  29.7   71.6   1.3627   4.1 ------	UNKNOWN
 97.9439  74.2756    3.3  53.7  160.9   4.2111   3.5 ------	UNKNOWN
110.1124  18.3954    2.6  12.4   63.3   0.8436   4.4 ------	UNKNOWN
122.7423  22.2497    1.8   0.1 -140.3   1.2488   6.5 ------	UNKNOWN
119.5489  -9.0052    2.8  31.4   -5.1   0.9217   4.2 ------	UNKNOWN
132.3098 -19.2780    2.7  42.5  -24.5   1.3363   4.3 ------	UNKNOWN
184.7770  48.0930    2.6  55.2 -145.1   5.4872   4.4 ------	UNKNOWN
162.7339   8.3172    3.1  40.9  -87.6   3.3982   3.7 ------	UNKNOWN
Plot creation:
Sun Dec 14 18:01:50 EST 2014